. 2021 Apr 12;40(1):129.
doi: 10.1186/s13046-021-01937-3.

Resolvin D1 reduces cancer growth stimulating a protective neutrophil-dependent recruitment of anti-tumor monocytes

Affiliations

Resolvin D1 reduces cancer growth stimulating a protective neutrophil-dependent recruitment of anti-tumor monocytes

Domenico Mattoscio et al. J Exp Clin Cancer Res. .

Abstract

Background: Innovative therapies to target tumor-associated neutrophils (PMN) are of clinical interest, since these cells are centrally involved in cancer inflammation and tumor progression. Resolvin D1 (RvD1) is a lipid autacoid that promotes resolution of inflammation by regulating the activity of distinct immune and non-immune cells. Here, using human papilloma virus (HPV) tumorigenesis as a model, we investigated whether RvD1 modulates PMN to reduce tumor progression.

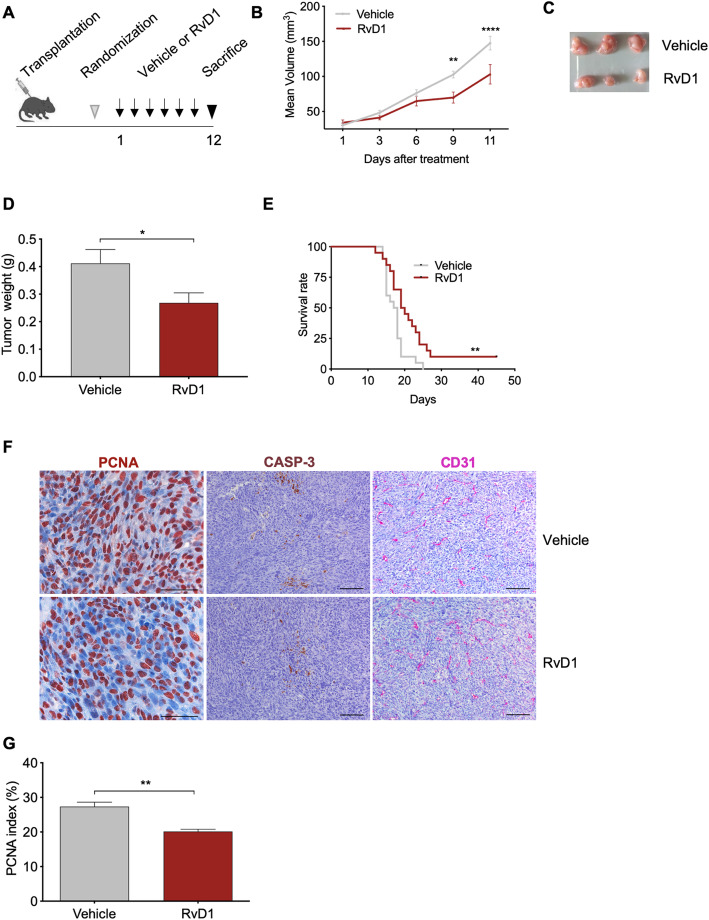
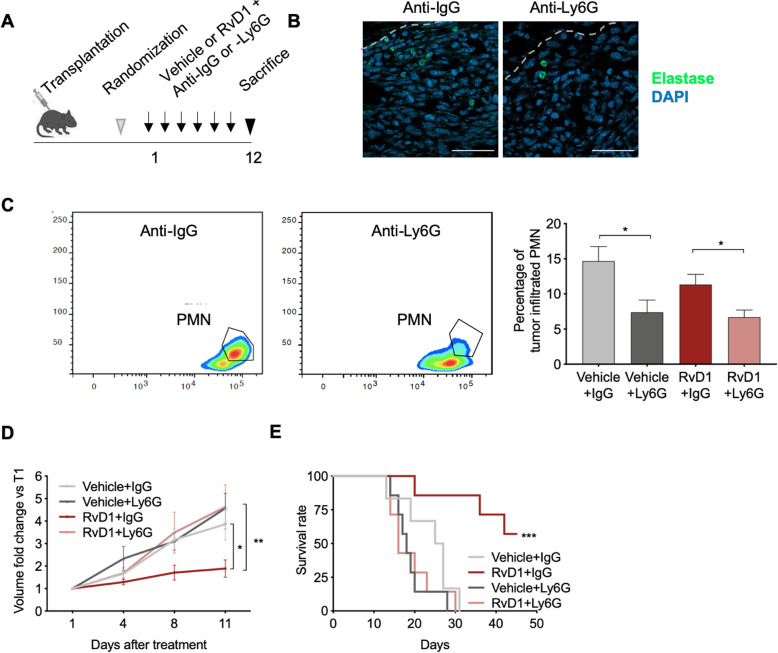
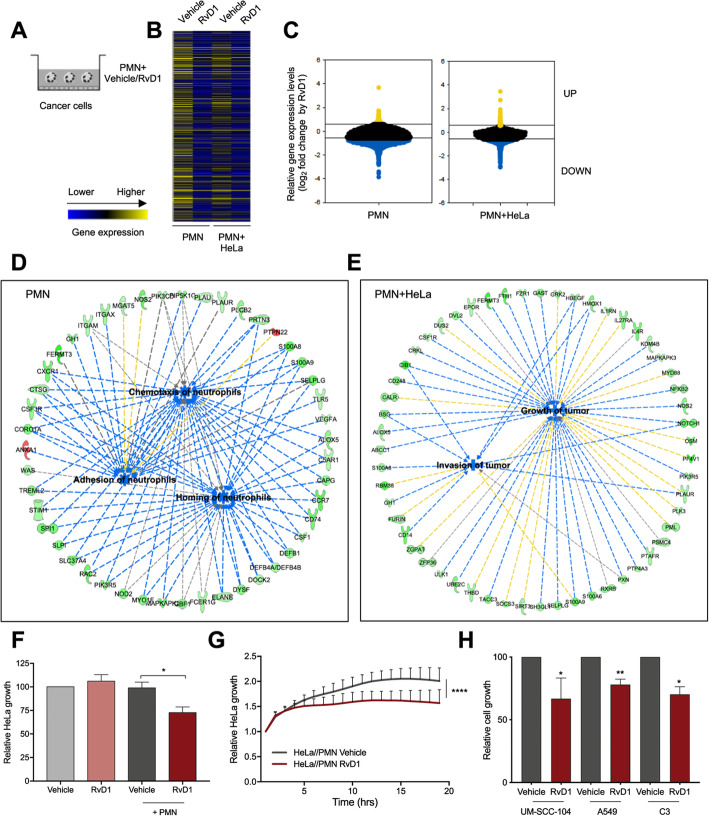
Methods: Growth-curve assays with multiple cell lines and in vivo grafting of two distinct HPV-positive cells in syngeneic mice were used to determine if RvD1 reduced cancer growth. To investigate if and how RvD1 modulates PMN activities, RNA sequencing and multiplex cytokine ELISA of human PMN in co-culture with HPV-positive cells, coupled with pharmacological depletion of PMN in vivo, were performed. The mouse intratumoral immune cell composition was evaluated through FACS analysis. Growth-curve assays and in vivo pharmacological depletion were used to evaluate anti-tumor activities of human and mouse monocytes, respectively. Bioinformatic analysis of The Cancer Genome Atlas (TCGA) database was exploited to validate experimental findings in patients.

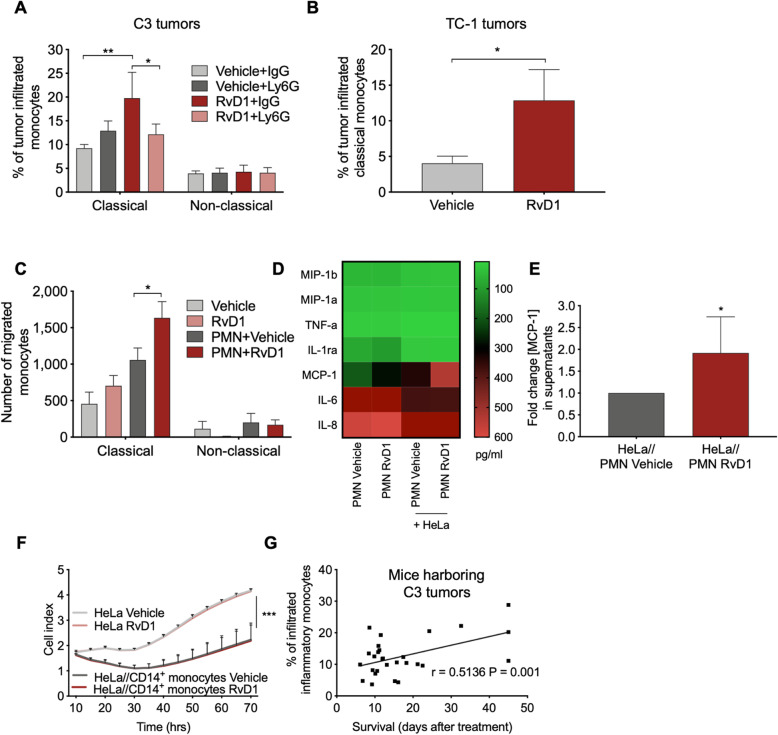
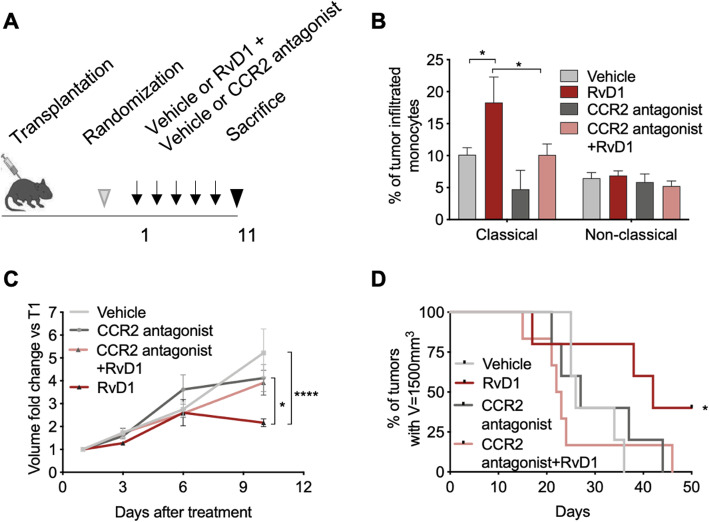
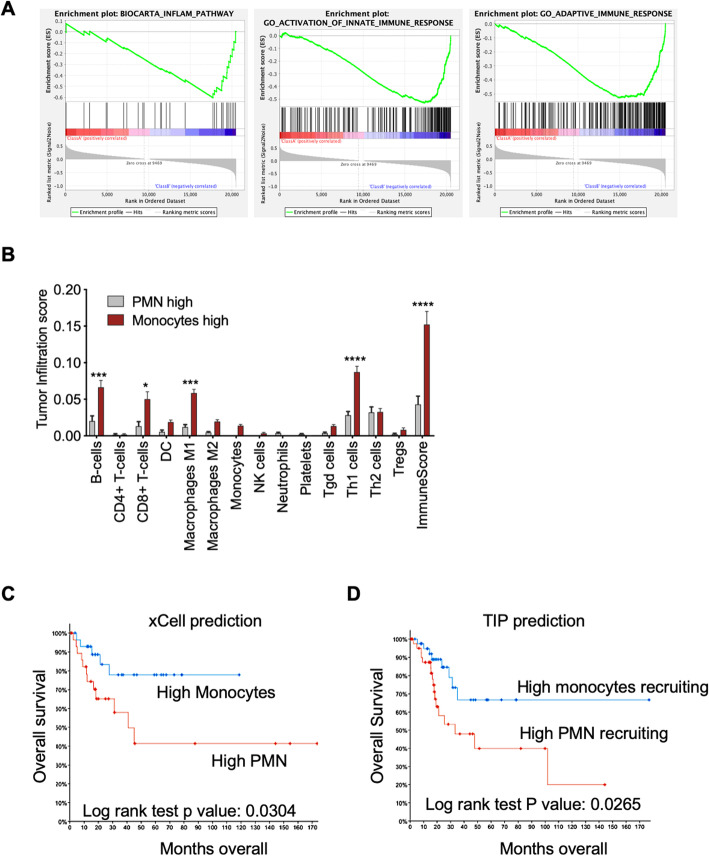
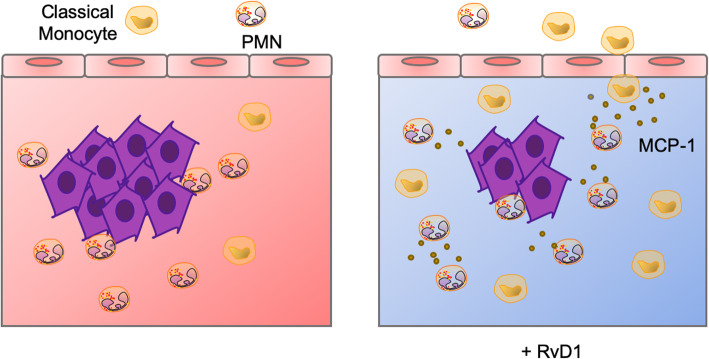
Results: RvD1 decreased in vitro and in vivo proliferation of human and mouse HPV-positive cancer cells through stimulation of PMN anti-tumor activities. In addition, RvD1 stimulated a PMN-dependent recruitment of classical monocytes as key determinant to reduce tumor growth in vivo. In human in vitro systems, exposure of PMN to RvD1 increased the production of the monocyte chemoattractant protein-1 (MCP-1), and enhanced transmigration of classical monocytes, with potent anti-tumor actions, toward HPV-positive cancer cells. Consistently, mining of immune cells infiltration levels in cervical cancer patients from the TCGA database evidenced an enhanced immune reaction and better clinical outcomes in patients with higher intratumoral monocytes as compared to patients with higher PMN infiltration.

Conclusions: RvD1 reduces cancer growth by activating PMN anti-cancer activities and encouraging a protective PMN-dependent recruitment of anti-tumor monocytes. These findings demonstrate efficacy of RvD1 as an innovative therapeutic able to stimulate PMN reprogramming to an anti-cancer phenotype that restrains tumor growth.

Keywords: Classical monocytes; HPV cancers; Neutrophils; Resolution of inflammation; Resolvin D1.


Conflict of interest statement

The authors declare that they have no competing interests.

Figures

Fig. 1
Fig. 1
RvD1 reduces tumor growth in syngeneic mice transplanted with HPV-positive C3 cells. a Scheme showing in vivo transplantation and treatment protocols, as detailed in Materials and Methods. b Mean tumor volume from mice subcutaneously transplanted with C3 cells and treated with Vehicle or RvD1. n = 19 mice per group. **, P < 0.01; ****, P < 0.0001(two-way ANOVA and Sidak’s multiple comparisons test). c Representative image showing tumors at sacrifice. d Weight of tumors at sacrifice. n = 7–10 mice per group *, P < 0.05 (Unpaired t test with Welch’s correction). e Kaplan-Meier curve survival analysis reporting the time for tumors to reach a volume of 1500 mm3 (humanized endpoint). n = 18–20 mice per group **, P < 0.01 (Log-rank Mantel-Cox test). f Representative microsections of tumors biopsies from mice treated with vehicle or RvD1 and stained with antibodies against PCNA (proliferation marker), CASP-3 (apoptotic marker), and CD31 (blood vessels marker). g Semiquantitative proliferation score. n = 5–7 tumors per group. **, P < 0.01
Fig. 2
Fig. 2
PMN depletion abolishes RvD1 anti-cancer effects. a Scheme of the in vivo transplantation of C3 cells in the right flank of C57BL/6 mice, treated with vehicle or RvD1 plus anti-IgG or -Ly6G antibodies three times a week. b Representative IF analysis of tumor slides from mice treated with anti-IgG or anti-Ly6G and stained with an anti-elastase antibody to detect tumor-infiltrated PMN. Nuclei were counterstained with DAPI. Tumor edges were marked with dotted lines. Scale bar: 50 μM. c Left and middle: Representative flow cytometric counter plot of single-cell dissociated tumors from mice treated with anti-IgG or anti-Ly6G, as indicated, and identified using the strategy reported in Fig. S6. Right: Percentage of tumor-infiltrated PMN determined by FACS analysis of CD66a+ cells. Data are expressed as percentage of CD11b+ cells. n = 4–7 mice per group. *, P < 0.05 (two-tailed unpaired t test). d Tumor growth of C3 cells in mice treated with vehicle/RvD1 plus anti-IgG/−Ly6G antibodies. Data are expressed as volume fold change as compared to the initial tumor volume at the start of treatments (T1). n = 5–6 mice per group. * P < 0.05 vehicle+IgG vs RvD1 + IgG at day 11 (two-way ANOVA and Tukey’s multiple comparison test); ** P < 0.01 RvD1 + IgG vs RvD1 + Ly6G at day 11 (two-way ANOVA and Tukey’s multiple comparison test). d Kaplan-Meier curve survival analysis reporting the time for tumors to reach a volume of 1500 mm3 (humanized endpoint). n = 6–7 mice tumors per group. ***, P < 0.001 RvD1 + IgG vs RvD1 + Ly6G (Log-rank Mantel-Cox test)
Fig. 3
Fig. 3
RvD1 regulates PMN gene expression and activity during co-incubation with cancer cell lines. a Scheme depicting in vitro PMN/cancer cell co-incubations and treatment. b Heatmap view (Morpheus, https://software.broadinstitute.org/morpheus) of gene expression levels (mean of RPKM values of n = 4–6 biological replicates pooled in 2–3 samples, respectively) of blood-derived PMN, treated with vehicle or RvD1, alone (PMN) or during co-incubation with HeLa cells (PMN + HeLa), as determined by RNAseq analysis. Color code is reported at the bottom. c Violin plot (SPSS Statistics) of gene expression patterns reporting RvD1 up- (yellow) or down-regulated (blue) genes in PMN with a fold-change cut-off of 1.5 (corresponding to 0.58 in the log2 scale reported in the figure) as compared to vehicle-treated PMN. PMN: 241 transcripts up- and 6018 down-regulated by RvD1. PMN + HeLa: 74 up, 2813 down-regulated by RvD1. d RvD1-regulated genes and significantly associated biological functions in PMN (IPA analysis). Adhesion of neutrophils p-value 4.99E-04, activation z-score − 3.057. Homing of PMN p-value 9.64E-03, activation z-score − 5.222. Chemotaxis of PMN p-value 1.45E-02, activation z-score − 5.222. Green symbols: down-regulated genes; red symbols: up-regulated genes. Blue dotted lines: expression leading to inhibition; yellow dotted lines: expression leading to activation; grey dotted lines: expression leading to unpredictable effect of function. Blue boxes: inhibited functions. e RvD1-regulated genes and biological functions related to cancer in PMN during co-incubations with HeLa cells (IPA analysis). Invasion of tumor, p-value 3.94E-02, activation z-score − 1.983. Growth of tumor, p-value 2.57E-02, activation z-score − 1.877. See above for symbol codes. f Relative HeLa cell growth during co-incubations with vehicle- or 100 nM RvD1-treated blood-derived PMN, as determined by crystal violet staining after 18 h of coincubation. HeLa cells treated with vehicle or RvD1 w/o PMN are shown for comparison. Data are expressed as fold over HeLa cells treated with vehicle n = 12. *, P < 0.05 (Mann Whitney test). g Relative growth of HeLa cells during co-incubations with freshly isolated blood-derived human PMN treated with vehicle or RvD1 (100 nM) and analyzed with impedance-based real time cell analysis (ACEA). Data are expressed as relative HeLa cell growth normalized at the time of addition of vehicle- or RvD1-treated PMN. n = 3. ****, P < 0.0001 (Wilcoxon matched-pairs signed rank test). h Relative growth of human HPV-positive head and neck cells UM-SCC-104, human lung A549 cells, and murine HPV-positive C3 cells, co-incubated with freshly isolated blood-derived human or bone marrow-derived mouse PMN. Data are expressed as fold over cancer cell lines co-incubated with vehicle-treated PMN, indicated in the graph with a dashed line, and determined by crystal violet staining after 18 h of PMN-cancer cells coincubations. n = 4 (UM-SCC-104), 8 (A549), and 3 (C3). *, P < 0.05; **, P < 0.01 (one-sample t test)
Fig. 4
Fig. 4
RvD1 prompts a PMN-dependent recruitment of anti-tumor monocytes in cancer models. a Percentage of classical (Ly6Chigh) and non-classical (Ly6Clow) infiltrated monocyte subtypes in tumors from C57BL/6 mice subcutaneously transplanted with C3 cells and treated with vehicle or RvD1 (1 μg/kg) plus anti-IgG or anti-Ly6G, as reported in Fig. 3a. Data are expressed as percentage of myeloid cells as determined by FACS analysis using the gating strategy reported in panel (a). n = 4–6 mice tumors per group. *, P < 0.05; **, P < 0.01 (two-way ANOVA with Tukey’s multiple comparisons test). b Percentage of classical (Ly6Chigh) infiltrated monocyte subtypes in tumors from C57BL/6 mice subcutaneously transplanted with TC-1 cells and treated with vehicle or RvD1(1 μg/kg) plus anti-IgG or anti-Ly6G as reported in Fig. 3a. Data are expressed as percentage of myeloid cells. n = 5–9 mice tumors per group. *, P < 0.05 (Mann Whitney test). c Number of human monocyte subsets transmigrated in the lower chamber of the Transwell insert 16 h after co-incubations with HeLa cells in the presence or not of PMN and treated with vehicle or RvD1 (100 nM). Number of monocytes are determined by measurements of CD14+CD16 (classical) and CD14lowCD16+ (non-classical) events recorded in 30 s of FACS acquisition. n = 4. *, P < 0.05 (two-way ANOVA and Tukey’s multiple comparison test). d Heatmap reporting the average concentration (pg/ml) of the indicated proteins in supernatants from PMN or PMN co-cultured with HeLa cells. e MCP-1 concentration in supernatants form HeLa/PMN coculture treated with vehicle or RvD1 (100 nM), as determined by ELISA. Data are expressed as fold change in MCP-1 concentration (pg/ml) compared to HeLa/PMN treated with vehicle. n = 6. *, P < 0.05 (Kolmogorov-Smirnov test). f Growth of HeLa cells during co-incubations with purified human CD14+monocytes exposed to vehicle or RvD1 (100 nM) and analyzed with an impedance-based real time cell analysis (ACEA). HeLa cells treated with vehicle or RvD1 in the absence of monocytes were used as control. n = 4. ***, P < 0.001 (HeLa Vehicle vs HeLa/classical monocytes Vehicle; HeLa RvD1 vs HeLa//classical monocytes RvD1; Wilcoxon matched-pairs signed rank test). g Correlation between the percentage of intratumor inflammatory monocytes and survival in mice transplanted with C3 cells. n = 26 XY pairs. Pearson r rank correlation was applied to analyze association between variables. Scattered plots with linear regression lines, Pearson r correlation coefficient, and two-tailed p value are reported
Fig. 5
Fig. 5
Depletion of tumor-infiltrated Ly6Chigh monocytes dampens RvD1 anticancer effects. a Scheme showing in vivo transplantation of C3 cells in C57BL/6 mice and treatment with vehicle or RvD1 (1 μg/kg) plus vehicle or the CCR2 antagonist SC-202525 (2 mg/kg). b Percentage of intratumor classical monocytes as determined by FACS analysis of single-cell dissociated tumors. Data are expressed as percentage of CD45+ leukocytes. n = 5–6 mice per group. *, P < 0.05 (two-way ANOVA with Tukey’s multiple comparison test). c Growth of tumors from C3 cells transplanted in syngeneic mice and treated with vehicle/RvD1 plus vehicle/CCR2 inhibitor. Data are expressed as volume fold change as compared to the initial tumor volume at the start of treatments (T1). n = 5–6 mice per group. *, P < 0.05 RvD1 vs CCR2 antagonist+RvD1 at day 11. ****, P < 0.0001 vehicle vs RvD1 at day 11 (two-way ANOVA and Tukey’s multiple comparison test). d Kaplan-Meier curve survival analysis reporting the time for tumors to reach a volume of 1500 mm3 (humanized endpoint). n = 5–6 mice tumors per group. *, P < 0.05 (Log-rank Mantel-Cox test)
Fig. 6
Fig. 6
Higher monocyte infiltration predicts stronger immunity and better prognosis in CESC. a Gene sets significantly enriched (nominal P value < 1%) in CESC patients with higher monocyte infiltration compared to patients with high PMN infiltration, as determined by GSEA. Infiltration levels of immune population were determined by xCell analysis. Patients with the higher monocyte or PMN infiltration levels were selected for the analysis, while samples with overlapping higher monocytes and PMN were excluded. n = 41 monocytes high, n = 20 PMN high. Gene sets significantly enriched with a nominal P value < 1% were considered significant. b Tumor infiltration score of key immune cell populations in CESC samples with high monocytes or high PMN, as inferred by xCell. n = 41 monocytes high, n = 20 PMN high. *, P < 0.05; ***, P < 0.001; ****, P < 0.0001(two-way ANOVA and Sidak’s multiple comparisons test. c Kaplan-Meier curve survival analysis of CESC patients stratified as high monocytes (n = 41) vs high PMN (n = 20) predicted infiltrated cells accordingly to xCell. d Kaplan-Meier curve survival analysis of CESC patients stratified as high monocyte recruiting (n = 46) vs high PMN recruiting (n = 46) accordingly to TIP. Overlapping samples were excluded from the analysis. Clinical data were extracted from the TCGA CESC database and analyzed using the cBioportal software
Fig. 7
Fig. 7
Model of the RvD1-governed PMN-mediated recruitment of anti-cancer monocytes and reduction in tumor growth. In HPV cancers, tumor-infiltrated PMN contribute to fuel cancer growth also by hampering classical monocyte infiltration and by sustaining chronic inflammation. Supplementation of RvD1 activates PMN anticancer activities and stimulates MCP-1 release that, in turn, increases the recruitment of antitumoral monocytes to reduce cancer growth

Similar articles

Cited by

References

    1. Fishbein A, Hammock BD, Serhan CN, Panigrahy D. Carcinogenesis: failure of resolution of inflammation? Pharmacol Ther. 2020;218:107670. doi: 10.1016/j.pharmthera.2020.107670. - DOI - PMC - PubMed
    1. Lawrence T. Inflammation and cancer: a failure of resolution? Trends Pharmacol Sci. 2007;28(4):162–165. doi: 10.1016/j.tips.2007.02.003. - DOI - PubMed
    1. Jones HR, Robb CT, Perretti M, Rossi AG. The role of neutrophils in inflammation resolution. Semin Immunol. 2016;28(2):137–145. doi: 10.1016/j.smim.2016.03.007. - DOI - PubMed
    1. Coffelt SB, Wellenstein MD, de Visser KE. Neutrophils in cancer: neutral no more. Nat Rev Cancer. 2016;16(7):431–446. doi: 10.1038/nrc.2016.52. - DOI - PubMed
    1. Soehnlein O, Lindbom L, Weber C. Mechanisms underlying neutrophil-mediated monocyte recruitment. Blood. 2009;114(21):4613–4623. doi: 10.1182/blood-2009-06-221630. - DOI - PubMed