. 2021 Apr 12;22(1):102.
doi: 10.1186/s13059-021-02290-6.

A benchmark for RNA-seq deconvolution analysis under dynamic testing environments

Affiliations

A benchmark for RNA-seq deconvolution analysis under dynamic testing environments

Haijing Jin et al. Genome Biol. .

Abstract

Background: Deconvolution analyses have been widely used to track compositional alterations of cell types in gene expression data. Although a large number of novel methods have been developed, due to a lack of understanding of the effects of modeling assumptions and tuning parameters, it is challenging for researchers to select an optimal deconvolution method suitable for the targeted biological conditions.

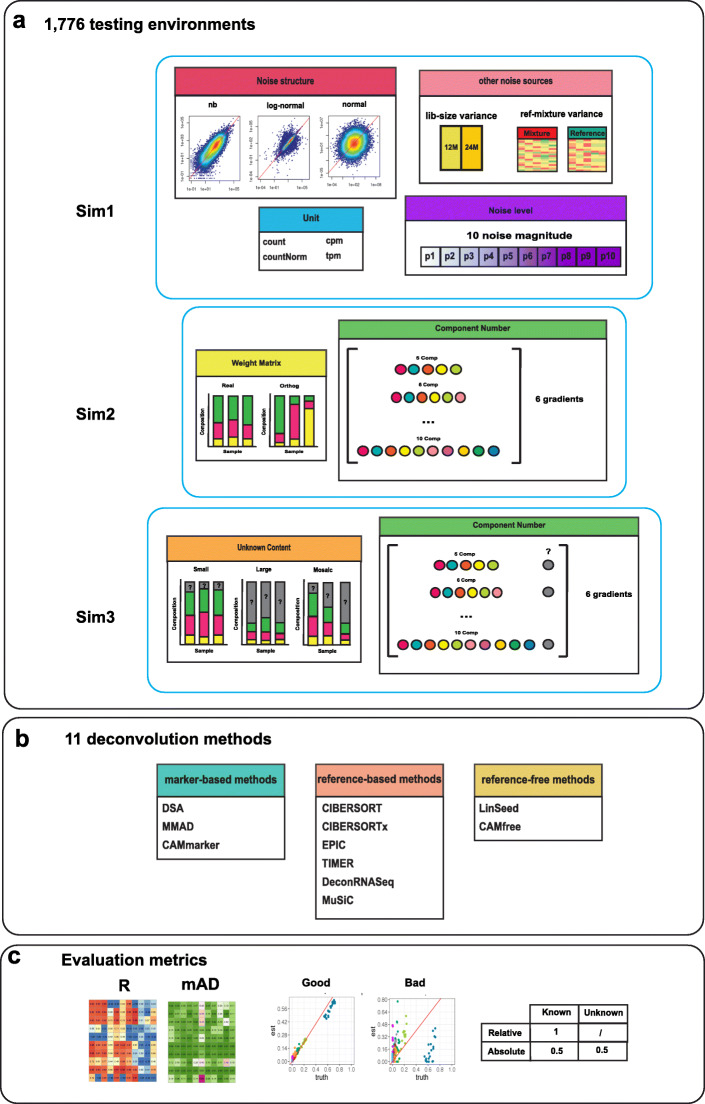
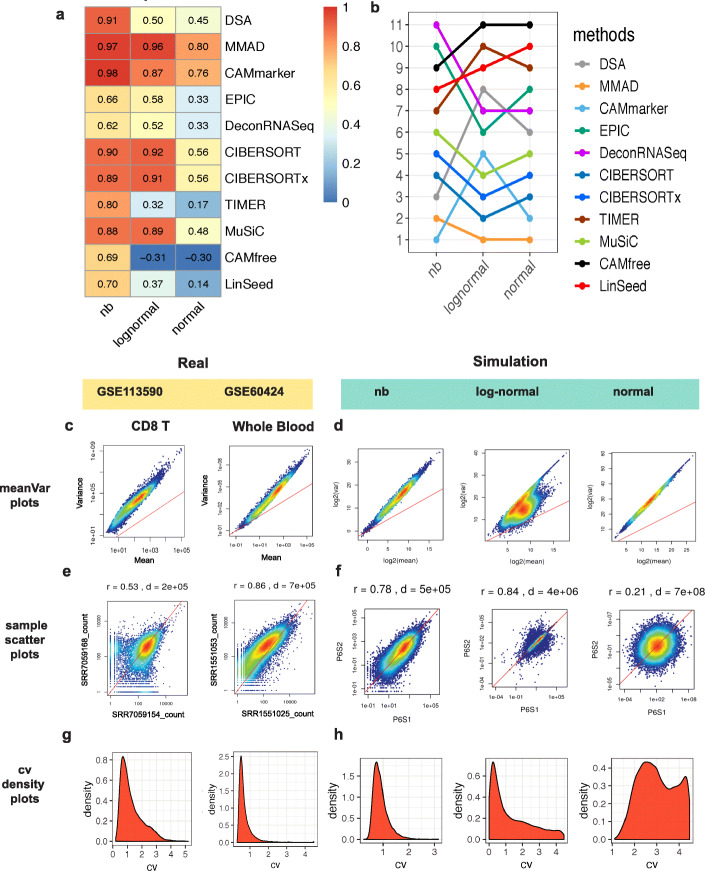
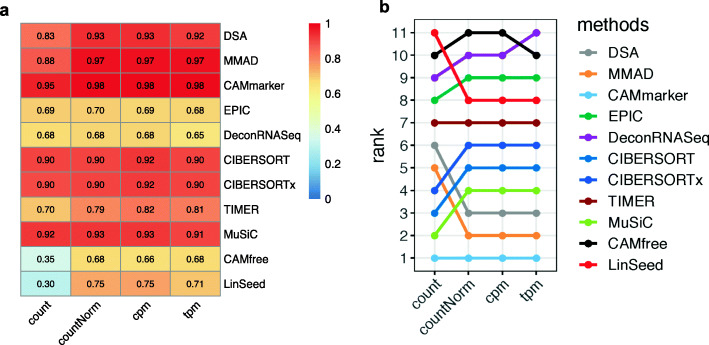
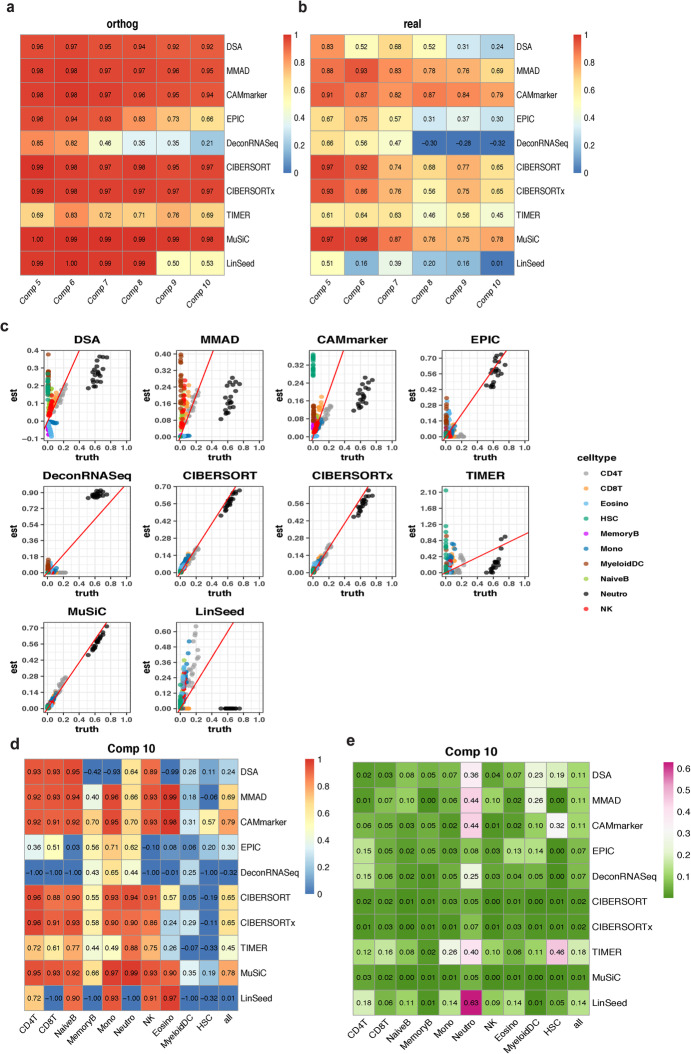
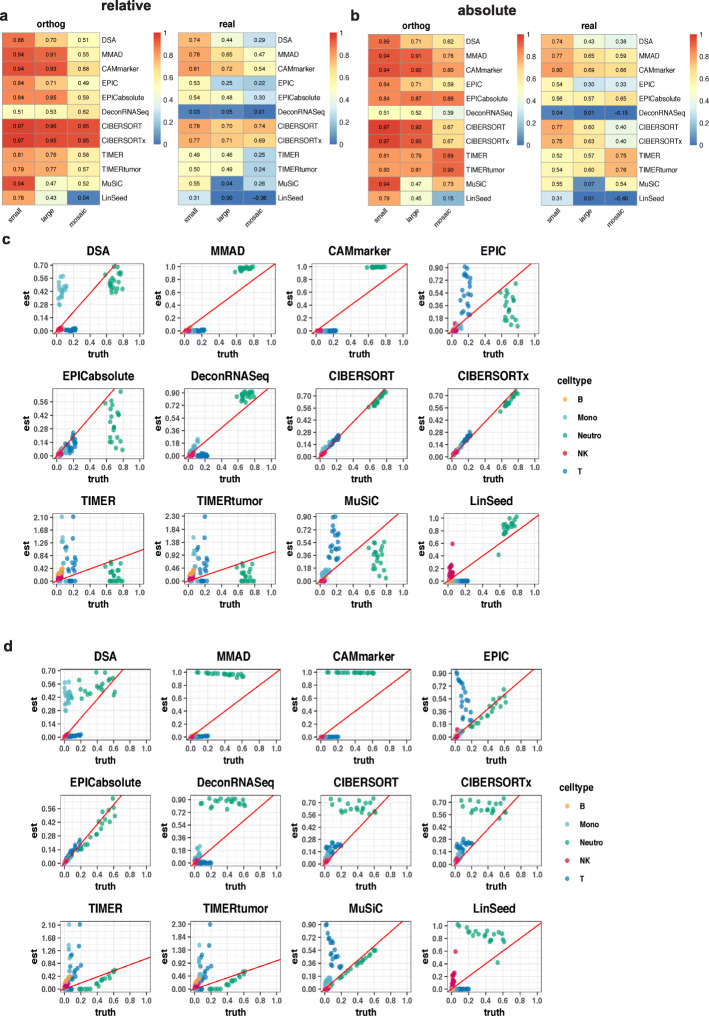
Results: To systematically reveal the pitfalls and challenges of deconvolution analyses, we investigate the impact of several technical and biological factors including simulation model, quantification unit, component number, weight matrix, and unknown content by constructing three benchmarking frameworks. These frameworks cover comparative analysis of 11 popular deconvolution methods under 1766 conditions.

Conclusions: We provide new insights to researchers for future application, standardization, and development of deconvolution tools on RNA-seq data.


Conflict of interest statement

The authors declare that they have no competing interests.

Figures

Fig. 1
Fig. 1
Overview of three in silico testing frameworks. a Three benchmarking frameworks were constructed to investigate the impact of seven factors that affect deconvolution analysis: noise level, noise structure, other noise sources, quantification unit, unknown content, component number, and weight matrix. b Eleven deconvolution methods are tested and have been categorized based on the required reference input: marker-based, reference-based, and reference-free. c Performance of the methods is assessed through Pearson’s correlation coefficient (R) and mean absolute deviance (mAD). Evaluation results are illustrated by heatmaps and scatter plots. When unknown content is involved, we derive evaluation metrics in both relative and absolute measurement scales
Fig. 2
Fig. 2
Evaluation results of Sim1_simModel and noise structure comparisons between real and simulated data. a Heatmap of the summarized evaluation results based on the Pearson’s correlation coefficients and b rankings of the tested deconvolution methods in the Sim1_simModel. In each heatmap, row indexes refer to the tested methods and column indexes refer to the simulation models (negative binomial, log-normal, and normal). c, d Mean-variance plots of c real and d simulated data. e, f Sample-sample scatter plots of e real and f simulated data. r, Spearman’s correlation coefficient; d, Euclidean distance. g, h Density plots of CV (coefficient of variation) of g real and d simulated data. Real data are derived from GSE113590 and GSE60424 (Additional file 1: Figures S6 and S7 contain detailed variance analysis results for each dataset). All simulated data in Fig. 2 are based on simulations derived from GSE51984 with the P6 noise level. Results in a and b are in the tpm unit; results in ch are in count unit
Fig. 3
Fig. 3
Evaluation results of Sim1_libSize. a Heatmap of the summarized evaluation results based on the Pearson’s correlation coefficients and b rankings of the tested deconvolution methods. In each heatmap, row indexes refer to the tested methods, and column indexes refer to the quantification units (count, countNorm, cpm, and tpm)
Fig. 4
Fig. 4
Evaluation results of Sim2. a, b Heatmaps of the summarized evaluation results based on the Pearson’s correlation coefficients with a “orthog” weight matrix and b real weight matrix. In each heatmap, row indexes refer to the tested methods, and column indexes refer to the cellular component numbers. c Scatter plots of estimated weights vs. ground truths of “real” mixtures with 10 cellular components. d, e Cell type-specific evaluation results of “real” mixtures consist of 10 cellular components based on d Pearson’s correlation coefficient and e mean absolute deviance. In each heatmap, row indexes refer to the tested methods, column indexes refer to the cell types, and the last column “all” refers to the averaged evaluation results across all cell types
Fig. 5
Fig. 5
Evaluation results of Sim3. a, b Heatmaps of the summarized evaluation results based on the Pearson’s correlation coefficients on the a relative measurement scale and b absolute measurement scale. In each heatmap, row indexes refer to the tested methods, and column indexes refer to the types of tumor spike-ins (small, large, and mosaic). c, d Scatter plots of the estimated weights vs. ground truths of mixtures consist of 5 cellular components and mosaic tumor spike-ins. c Estimated weights vs. relative ground truth. d Estimated weights vs. absolute ground truth

References

    1. Vallania F, et al. Leveraging heterogeneity across multiple datasets increases cell-mixture deconvolution accuracy and reduces biological and technical biases. Nat Commun. 2018;9(1):4735. - PMC - PubMed
    1. Avila Cobos F, Vandesompele J, Mestdagh P, De Preter K. Computational deconvolution of transcriptomics data from mixed cell populations. Bioinformatics. 2018;34(11):1969–79. - PubMed
    1. Sturm G, et al. Comprehensive evaluation of transcriptome-based cell-type quantification methods for immuno-oncology. Bioinformatics. 2019;35:i436–i445. doi: 10.1093/bioinformatics/btz363. - DOI - PMC - PubMed
    1. Schelker M, et al. Estimation of immune cell content in tumour tissue using single-cell RNA-seq data. Nat Commun. 2017;8:2032. doi: 10.1038/s41467-017-02289-3. - DOI - PMC - PubMed
    1. Weber LM, et al. Essential guidelines for computational method benchmarking. Genome Biol. 2019;20:125. doi: 10.1186/s13059-019-1738-8. - DOI - PMC - PubMed

Publication types

LinkOut - more resources