. 2021 Apr 20;118(16):e2016131118.
doi: 10.1073/pnas.2016131118.

Helicase-like functions in phosphate loop containing beta-alpha polypeptides

Affiliations

Helicase-like functions in phosphate loop containing beta-alpha polypeptides

Pratik Vyas et al. Proc Natl Acad Sci U S A. .

Abstract

The P-loop Walker A motif underlies hundreds of essential enzyme families that bind nucleotide triphosphates (NTPs) and mediate phosphoryl transfer (P-loop NTPases), including the earliest DNA/RNA helicases, translocases, and recombinases. What were the primordial precursors of these enzymes? Could these large and complex proteins emerge from simple polypeptides? Previously, we showed that P-loops embedded in simple βα repeat proteins bind NTPs but also, unexpectedly so, ssDNA and RNA. Here, we extend beyond the purely biophysical function of ligand binding to demonstrate rudimentary helicase-like activities. We further constructed simple 40-residue polypeptides comprising just one β-(P-loop)-α element. Despite their simplicity, these P-loop prototypes confer functions such as strand separation and exchange. Foremost, these polypeptides unwind dsDNA, and upon addition of NTPs, or inorganic polyphosphates, release the bound ssDNA strands to allow reformation of dsDNA. Binding kinetics and low-resolution structural analyses indicate that activity is mediated by oligomeric forms spanning from dimers to high-order assemblies. The latter are reminiscent of extant P-loop recombinases such as RecA. Overall, these P-loop prototypes compose a plausible description of the sequence, structure, and function of the earliest P-loop NTPases. They also indicate that multifunctionality and dynamic assembly were key in endowing short polypeptides with elaborate, evolutionarily relevant functions.

Keywords: P-loop; Walker A; multifunctionality; polyphosphate; protein evolution.


Conflict of interest statement

The authors declare no competing interest.

Figures

Fig. 1.
Fig. 1.
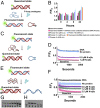
The molecular beacon assay reports the strand separation of P-loop prototypes. (A) Simplified schematic of the strand-separation molecular beacon assay (30). In the initial dsDNA state, the quencher of the beacon strand is held apart from the fluorophore resulting in energy transfer (high fluorescence). The preferential binding of P-loop prototypes to ssDNA induces strand separation, allowing the beacon strand to assume a hairpin state wherein the fluorophore is quenched. The oligos used in this assay and the assays described in the subsequent figures are listed in SI Appendix, Table S1. (B) A representative strand separation experiment using the intact 110 residue P-loop prototype (D-P-loop; ref. 16). Strand separation is reported by the change in FRET (Förster Resonance Energy Transfer) signal (i.e., fluorescence quenching in our experimental setup) upon addition of the P-loop prototype at increasing protein concentrations. All assays were performed with 5 nM beacon dsDNA, in 50 mM Tris (pH 8), at 24 °C. Shown are normalized F/F0 values, whereby the initial fluorescence of beacon dsDNA prior to protein addition takes the value of 1. Baseline represents the signal of the fully quenched hairpin beacon. Digested DNA represents the signal upon addition of 0.5 μM P-loop prototype to the beacon dsDNA pretreated with Benzonase nuclease. Traces were fitted to a biphasic exponential decay model (SI Appendix) and the apparent rate constants are given in SI Appendix, Table S4. (C) New P-loop prototypes were constructed by systematic truncation and circular permutation of the intact prototype. The numbered arrows indicate sequential steps in the engineering of new constructs as follows: 1) Truncation of the intact 110 residue prototype into half (16) (N-half indicates N-terminal half). 2) Circular permutation (red arrow) of N-half to a construct with ‘αβαβ’ architecture. 3) Truncation of the C-terminal β-strand to give N-αβα. 4 and 5) Incremental truncations of N-terminal helix of N-αβα down to a βα fragment. The structural models indicate the ancestral P-loop element in yellow (β1), red (the Walker A P-loop) and green (α1), while the remaining parts are in blue. (D) Strand separation by truncated P-loop prototypes, at 1 µM protein concentration, and under the stringent condition (with 100 mM NaCl; other assay conditions as in A). The lines represent the average from two to six independent experiments, and the error bars represent the SD values.
Fig. 2.
Fig. 2.
Binding affinities and kinetics of strand separation by P-loop prototypes. (A) A representative strand-separation experiment with varying concentrations of N-αβα (the beacon dsDNA is described in Fig. 1A, and assay conditions are as in Fig. 1D). The values shown are the average from two to six independent experiments, and the error bars represent the SD values (the number of experiments in the subsequent panels is denoted as n). (B) Traces shown in A were fitted to a one phase exponential decay model (SI Appendix, Eq. 1), and the apparent rate constants were plotted against protein concentration (SI Appendix, Table S5). (C) Binding isotherms of P-loop prototypes (for their topology, see Fig. 1C). End point F/F0 values (2 h), from strand separation experiments (e.g., A) were normalized (fluorescence of the starting beacon dsDNA equals 0, and of the fully quenched ssDNA hairpin equals 1) to derive the relative fraction of unwound dsDNA and were then plotted versus protein concentration (n = 2 to 6; error bars represent SD values). (D) Simultaneous monitoring of the changes in fluorescence intensity and in anisotropy of the beacon dsDNA. Fluorescence polarization and quenching were monitored for 2 h after incubating the beacon dsDNA with varying concentrations of N-αβα. Changes in anisotropy (pink trace) and in the fraction unwound (black trace; as in C) were measured as described in Materials and Methods (n = 4 to 8; error bars represent SD values). Shown here are 2 h end point values plotted against N-αβα concentration. (E) As above but with a dsDNA construct having the fluorophore and quencher on the opposite strands (here, strand separation should result in an increase in fluorescence rather than decrease as in D and in all other beacon assays; n = 4 to 8; error bars represent SD values). (F) Binding to the individual strands of the dsDNA beacon as monitored by fluorescence anisotropy assay. Fluorescence polarization was monitored for 2 h after incubation of the GA-beacon sense strand and the TC-beacon antisense strand, with varying concentrations of N-αβα Changes in anisotropy were measured as described in Materials and Methods (n = 4 to 8; error bars represent SD values). Shown here are 2 h end point values for GA-beacon sense strand (pink trace) and the TC-beacon antisense strand (black trace) plotted against N-αβα concentration.
Fig. 3.
Fig. 3.
The N-αβα P-loop prototype mediates strand exchanges. (A) A schematic of the strand exchange reaction between a quenched dsDNA and a nonlabeled complementary strand (hairpin-forming). (B) The exchange reaction was monitored by increase in fluorescence upon addition of N-αβα to a premix of quenched dsDNA and 100-fold excess of unlabeled complementary antisense strand. Fluorescence was normalized (F/F0) to quenched dsDNA (equals 1) and plotted versus time (n = 2 to 4; error bars represent SD values). (C) A schematic of the strand exchange reaction between a fluorescent dsDNA and a quencher-containing complementary strand (hairpin-forming). (D) Fluorescence quenching (F/F0) was monitored upon addition of N-αβα to a premix of fluorescently labeled dsDNA and 10-fold excess of a quencher-containing competing strand (hairpin-forming) (n = 2 to 4; error bars represent SD values). Data were fit to a one-phase exponential decay (SI Appendix, Table S8). (E) A schematic of the strand exchange reaction between a fluorescent dsDNA and a quencher-containing complementary strand (linear). (F) Fluorescence quenching (F/F0) was monitored upon addition of N-αβα to a premix of fluorescently labeled dsDNA and 10-fold excess of a linear quencher-containing competing strand (n = 2; error bars represent SD values). Data were fit to a two-phase exponential decay. (G) Native EMSA gel of the strand-exchange reaction shown in B. The reactions were allowed to reach completion (24 h) and DNA products were resolved on native polyacrylamide TBE gels (see Materials and Methods). The lanes are as follows: 1) Quenched dsDNA (FAM-GA sense strand plus BHQ-1 antisense strand); 2) DNA Premix (quenched dsDNA with 100-fold excess of unlabeled antisense strand); 3 through 6) DNA Premix with N-αβα (0.6, 1.2, 5, and 10 µM, respectively); 7) Fluorescent beacon dsDNA; 8) Fluorescent ssDNA (FAM-GA sense strand) (SI Appendix, Table S1). Short dsDNA duplexes comprising of A/T rich regions are prone to improper annealing and/or formation of internal hairpins due to self-complementary regions. This is likely the reason for the visible lower band in lane 7. (H) Native EMSA gel of a strand-exchange reaction as shown in E but with both strands fluorescently labeled. Strand-exchange reactions were carried out as described above, allowed to reach steady state (14 h), and analyzed on a native polyacrylamide TBE gel. The lanes are as follows: 1) Fluorescent ssDNA (FAM-TC-linear antisense strand); 2) Fluorescent dsDNA (FAM-GA-linear sense strand plus FAM-TC-linear antisense strand); 3) DNA premix (fluorescent dsDNA with 10-fold excess of BHQ-1-linear antisense strand); 4) DNA Premix with 0.6 µM N-αβα and 5) with 1.25 µM N-αβα; 6) Quenched dsDNA (FAM-GA-linear sense strand plus BHQ-1-linear antisense strand) with FAM-TC-linear antisense strand (5 nM; 1:1 ratio).
Fig. 4.
Fig. 4.
Release of bound ssDNA by phosphoranhydride ligands. (A) A schematic description of the induction of strand separation by a P-loop prototype (first step) followed by the displacement of the bound ssDNA by various phosphoanhydrides (Pn) and relaxation to the initial dsDNA state (second step). (B) Representative strand separation experiments with 0.4 μM N-αβα added at time 0. Subsequent addition of ATP (turquoise) and GTP (pink, both at 9 mM concentration) after 90 min, leads to the release of the bound ssDNA and its relaxation to the initial dsDNA state. (C) The apparent affinities (KDApp) of binding of various phosphoanhydride ligands to P-loop prototype N-αβα. The fraction of released ssDNA upon addition of phospho-ligands was calculated by normalizing the F/F0 values from the plot in B. Complete release (= 1) corresponds to the initial unbound dsDNA state and no release (= 0) corresponds to the steady-state value of F/F0 prior to ligand addition. The apparent binding affinities (KDapp) were calculated by SI Appendix, Eq. 3. Vertical error bars, and values in parenthesis, represent SD from two independent experiments. (D) Inhibition of ssDNA binding. Preincubation of 0.125 μM N-αβα with increasing concentrations of hexametaphosphate shows abrogation of binding to 24 base biotinylated ssDNA (SI Appendix, Table S1) in an ELISA-format as detected by anti-Histag antibodies (n = 2 to 4; error bars represent SD values).
Fig. 5.
Fig. 5.
Quaternary structural characterization of N-αβα. (A) Native MS analysis of N-αβα prototype. Under nondissociative conditions, charge series corresponding to 10 and 30 N-αβα oligomers were unambiguously assigned in the MS spectrum (green and purple dots, respectively). The 30+ charge state that was selected for tandem MS analysis is shadowed in red. (B) Tandem MS of the N-αβα 30-mer oligomer releases a highly charged monomer (blue; at the lower m/z range) and a stripped 29-mer oligomer (red), confirming the oligomer stoichiometry. The spectra are magnified threefold above 7,000 and below 2,000 m/z.
Fig. 6.
Fig. 6.
Instances of P-loops binding to ssDNA in extant P-loop NTPases. (A) The Helicase_C_2 domain of XPD helicases (F-groups, ECOD: 2004.1.1.106, Pfam: PF13307). Shown here is a fragment taken from a representative structure (ATP dependent DinG helicase; ECOD domain ID: e6fwrA1, residues 448 to 703; the fragment shown, residues 535 to 599, spans from β1 to α3). The strand topology of this domain follows the simplest P-loop NTPase topology (2-3-1-4-5). Its P-loop resides at the tip of α1, in the very same location as the Walker A motif, but its sequence is noncanonical (SGR, in magenta). Shown are direct as well as water-mediated interactions between the residues of the P-loop and phosphate groups of the ssDNA oligonucleotide (waters shown as red spheres). A glutamine at the tip of β2 (in cyan) and a serine at the N terminus of α3 (in magenta) provide additional anchoring points for the ssDNA. (B) Bacterial polynucleotide kinase (F-groups, ECOD: 2004.1.1.32; Pfam: PF13671; strand topology: 2–3-1-4-5). Shown here is a fragment of the P-loop NTPase domain from a representative structure (Clostridium thermocellum polynucleotide kinase; ECOD domain ID: e4mdeA1, residues 1 through 170; the shown fragment, residues 8 through 37 and 62 through 98, spans from β1 to α3, with residues 38 through 61 truncated for clarity). The canonical Walker A motif resides between β1 and α1 (in magenta, GSSGSGKS) and binds GTP. This representative structure shows the product complex of GDP•Mg+2 and the phosphorylated ssDNA. The lysine and serine residues of the P-loop motif at the tip of α1 provide bridging interactions, coordinated by an Mg2+ ion (green sphere), between the β phosphate of the bound GDP and the phosphate group at the 5′-OH of the ssDNA.

Similar articles

Cited by

References

    1. Bell J. C., Kowalczykowski S. C., Rec A., RecA: Regulation and mechanism of a molecular search engine. Trends Biochem. Sci. 41, 491–507 (2016). - PMC - PubMed
    1. Bleichert F., Botchan M. R., Berger J. M., Mechanisms for initiating cellular DNA replication. Science 355, eaah6317 (2017). - PubMed
    1. Eck R. V., Dayhoff M. O., Evolution of the structure of ferredoxin based on living relics of primitive amino acid sequences. Science 152, 363–366 (1966). - PubMed
    1. Romero M. L. R., Rabin A., Tawfik D. S., Functional proteins from short peptides : Dayhoff s hypothesis turns 50. Angew. Chem. Int. Ed. Engl. 1980, 15966–15971 (2016). - PubMed
    1. Alva V., Söding J., Lupas A. N., A vocabulary of ancient peptides at the origin of folded proteins. Elife 1–19 (2015). - PMC - PubMed

MeSH terms