. 2021 Apr 12;12(4):392.
doi: 10.1038/s41419-021-03669-w.

Simvastatin accelerated motoneurons death in SOD1G93A mice through inhibiting Rab7-mediated maturation of late autophagic vacuoles

Affiliations

Simvastatin accelerated motoneurons death in SOD1G93A mice through inhibiting Rab7-mediated maturation of late autophagic vacuoles

Lin Bai et al. Cell Death Dis. .

Erratum in

Abstract

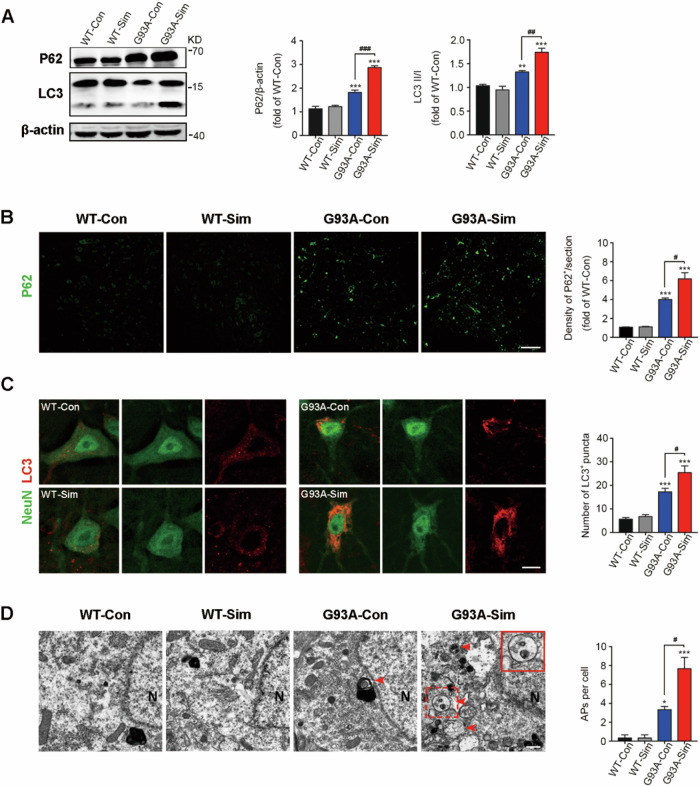
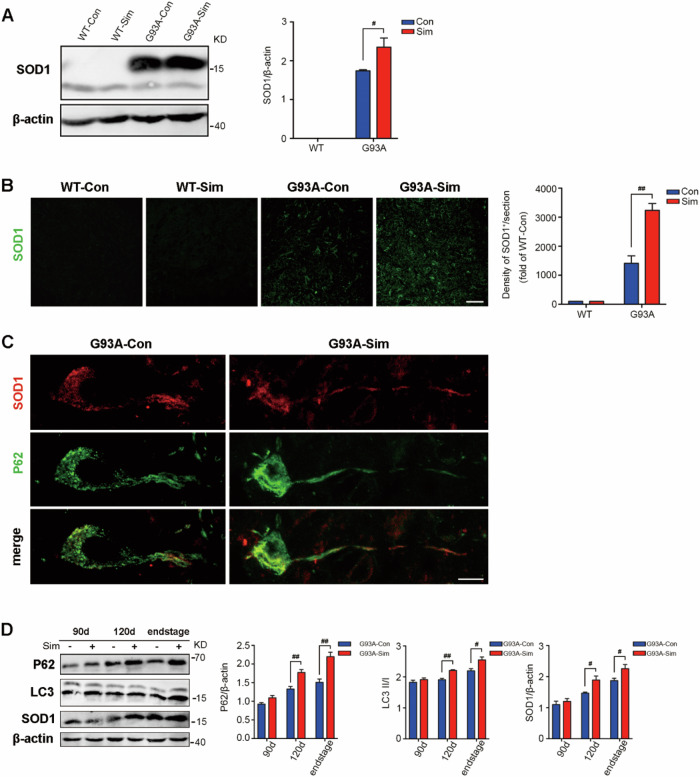
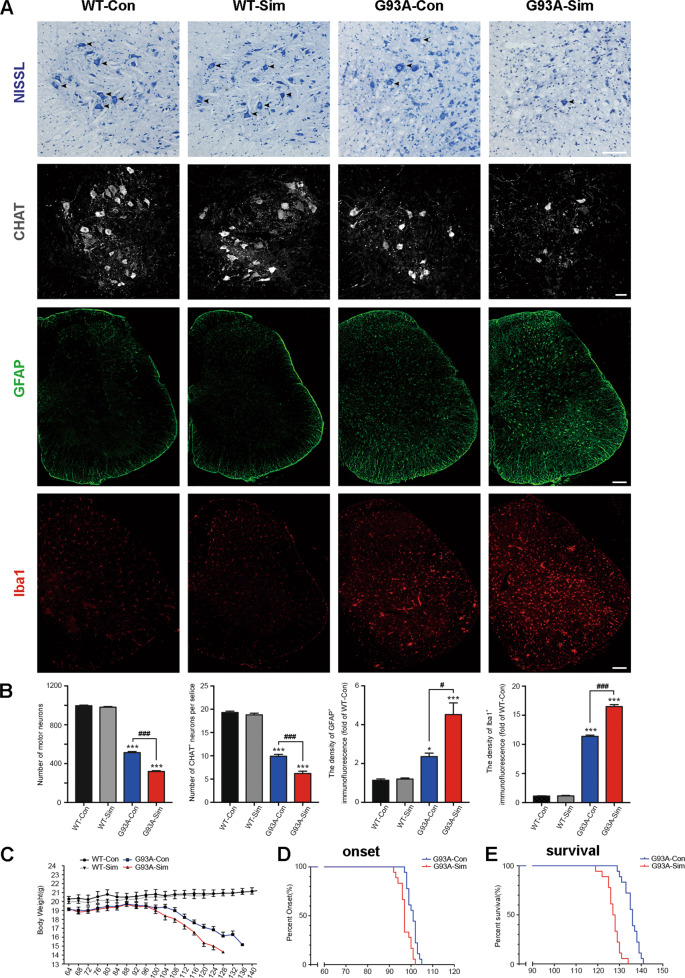
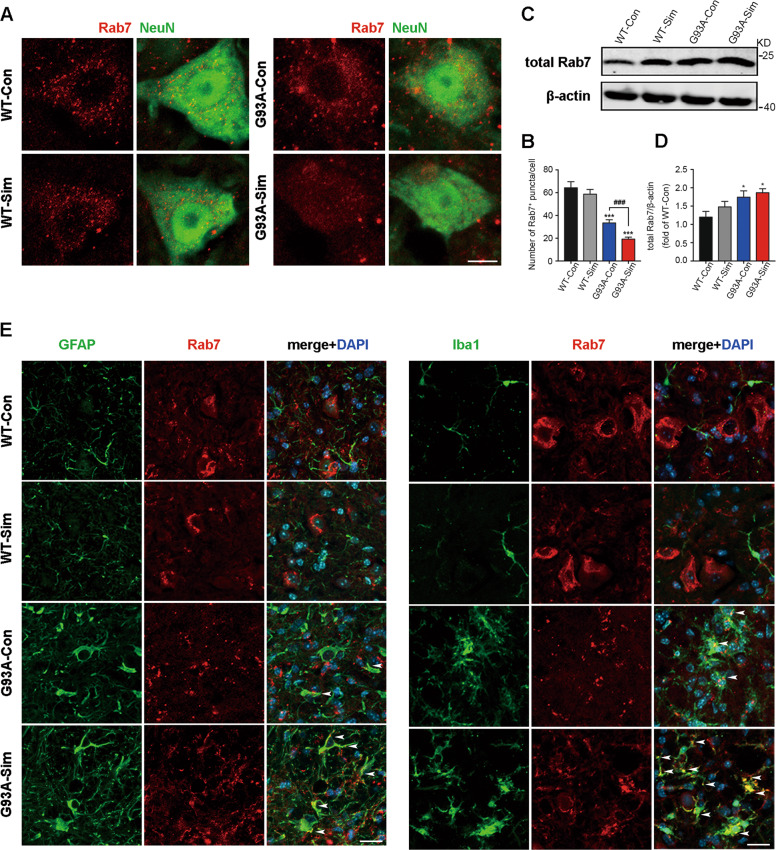
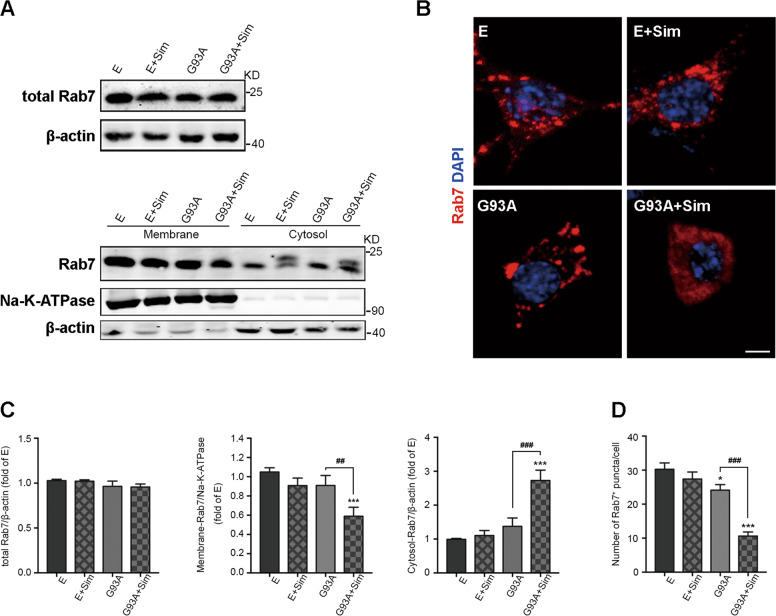
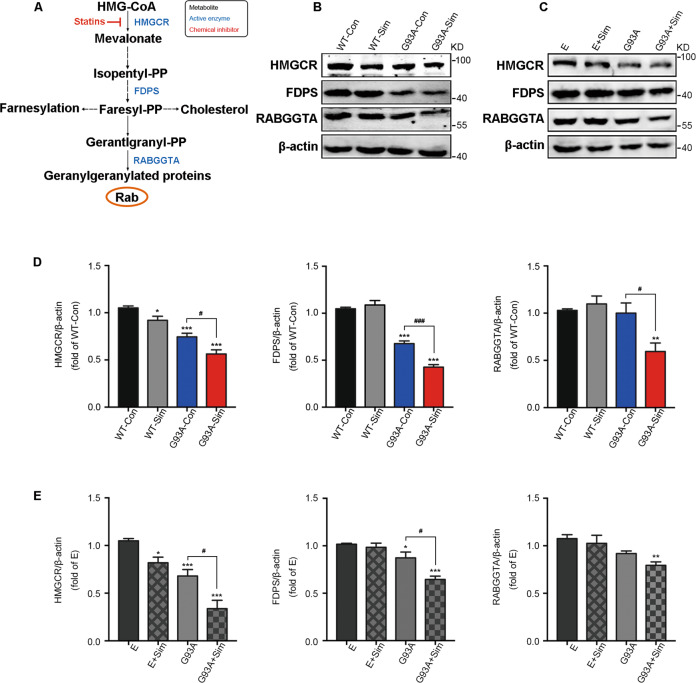
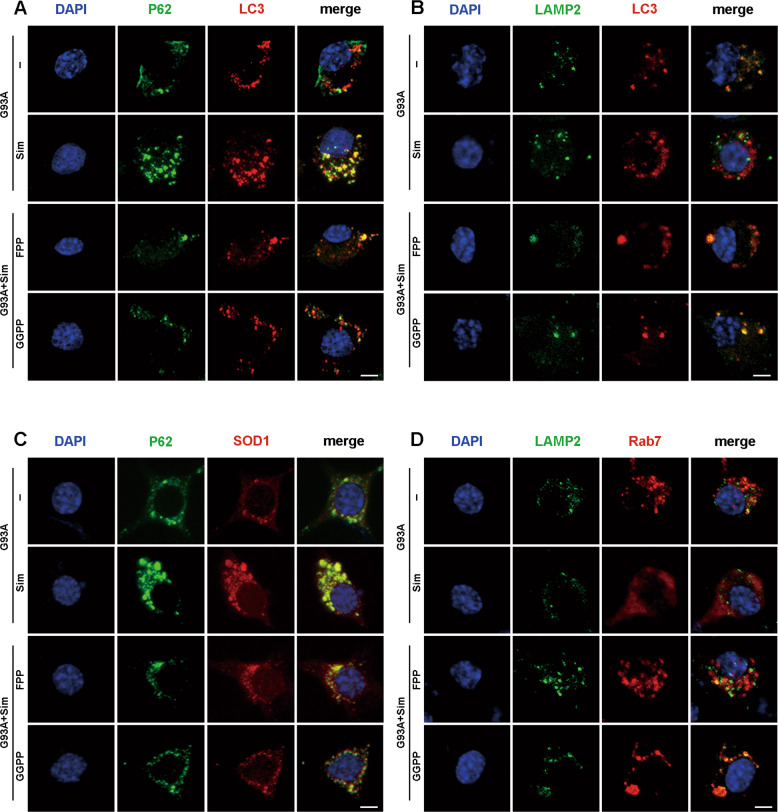
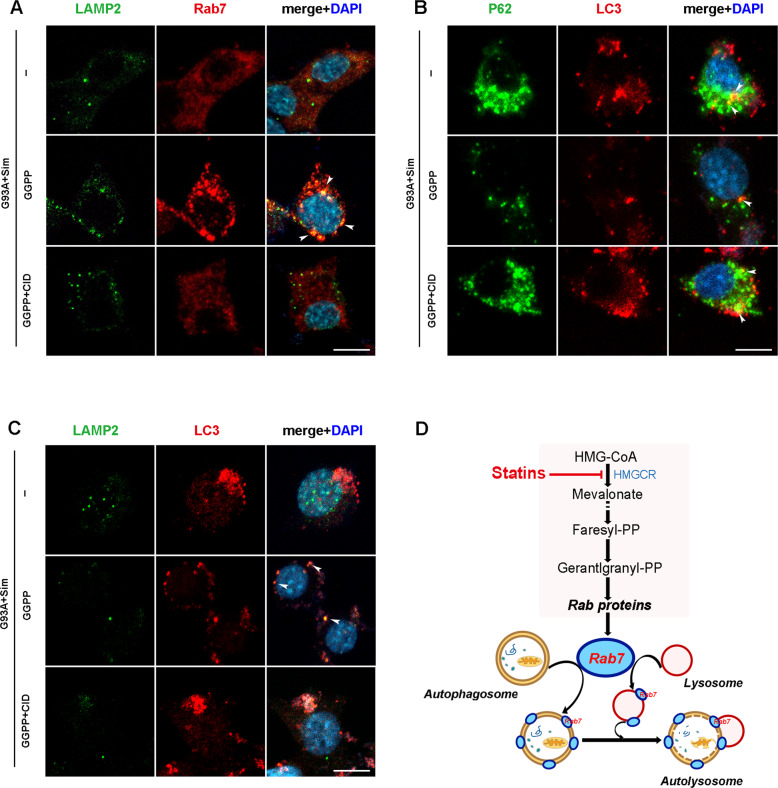
Amyotrophic lateral sclerosis (ALS) is a progressive neurodegenerative disease caused by motoneuron loss, for which there is currently no effective treatment. Statins, as inhibitors of 3-hydroxy-3-methylglutaryl-CoA (HMG-CoA) reductase, are used as drugs for treatment for a variety of disease such as ischemic diseases, neurodegenerative diseases, cancer, and inflammation. However, our previous evidence has demonstrated that simvastatin leads to cytotoxicity in NSC34-hSOD1G93A cells by aggravating the impairment of autophagic flux, but the role of simvastatin in ALS model remains elusive. In present study, we reported that after simvastatin treatment, SOD1G93A mice showed early onset of the disease phenotype and shortened life span, with aggravated autophagic flux impairment and increased aggregation of SOD1 protein in spinal cord motoneurons (MNs) of SOD1G93A mice. In addition, simvastatin repressed the ability of Rab7 localization on the membrane by inhibiting isoprenoid synthesis, leading to impaired late stage of autophagic flux rather than initiation. This study suggested that simvastatin significantly worsened impairment of late autophagic flux, resulting in massive MNs death in spinal cord and accelerated disease progression of SOD1G93A mice. Together, these findings might imply a potential risk of clinic application of statins in ALS.


Conflict of interest statement

The authors declare no competing interests.

Figures

Fig. 1
Fig. 1. Simvastatin aggravated impairment of autophagic flux in SOD1G93A mice.
A Western blot analysis of P62 and LC3 in the lumbar spinal cords of WT and SOD1G93A mice treated with or without simvastatin at 120 days. Quantification of P62 and LC3 levels from immunoblots normalized to the WT-Con group. B Immunofluorescence labeling of P62 (green) in the lumbar spinal cord at 120 days (Scale bar, 100 μm). Quantification of the average density of P62-positive cells per section. C Immunofluorescence labeling of LC3 (red) in NeuN-positive motoneurons (green) at 120 days (Scale bars, 10 μm). Quantitative analysis of LC3 puncta. D TEM micrographs showed that APs are present in the cytoplasm of MNs in SOD1G93A mice at 120 days and that these structures are absent or rare in MNs of WT mice (red arrowheads; N, nucleus; scale bar, 1 µm). The upper right image shows magnifications for the red dotted box, as shown in the red solid line box. The histogram shows the quantification of APs per cell. (Data represent the mean ± SEM, n = 5 mice per group; statistical significance was assessed by one-way ANOVA or an unpaired t-test, *P ≤ 0.05, **P ≤ 0.01, ***P ≤ 0.001, #P ≤ 0.05, ##P ≤ 0.01, ###P ≤ 0.001).
Fig. 2
Fig. 2. Simvastatin increased SOD1 aggregation in SOD1G93A mice.
A Western blot analysis of SOD1 levels in the lumbar spinal cord at 120 days. Quantitative analysis of SOD1 levels. B Immunofluorescence labeling of SOD1 (green) in the lumbar spinal cord at 120 days (Scale bars, 50 μm). Quantification of SOD1 immunoreactivity. C Colocalization of SOD1 (red) and P62 (green) in MNs of G93A-Sim and G93A-Con mice at 120 days (Scale bars, 10 μm). D Representative Western blot quantification of P62, LC3, and SOD1 levels in the lumbar spinal cord of G93A-Sim and G93A-Con mice at 90 days, 120 days, and end-stage of disease. (Data represent the mean ± SEM, n = 5 mice per group; statistical significance was assessed by one-way ANOVA or an unpaired t-test, #P ≤ 0.05, ##P ≤ 0.01, ###P ≤ 0.001).
Fig. 3
Fig. 3. Simvastatin accelerated neuron death and onset of the disease phenotype in SOD1G93A mice.
A Photographs of Nissl-stained MNs in the ventral horn of the lumbar spinal cord at 120 days. Immunofluorescence labeling of CHAT, GFAP, and Iba1 in the lumbar spinal cord at 120 days. (Scale bars, 100 μm). B The number of MNs in the lumbar spinal cord in different groups. Quantification of CHAT positive cells in the lumbar spinal cord. Quantification of GFAP intensity in the lumbar spinal cord. Quantification of Iba1 intensity in the lumbar spinal cord. (Data represent the mean ± SEM, n = 5 mice per group; statistical significance was assessed by one-way ANOVA or an unpaired t-test, *P ≤ 0.05, **P ≤ 0.01, ***P ≤ 0.001, #P ≤ 0.05, ##P ≤ 0.01, ###P ≤ 0.001). CE Kaplan–Meier plots showing the effects of simvastatin treatment on disease phenotypes. C The body weight curves of WT and SOD1G93A mice treated or untreated with simvastatin. Simvastatin accelerates body weight loss in SOD1G93A mice. D The probability of disease onset for G93A-Sim relative to G93A-Con. E The probability of survival for G93A-Sim relative to G93A-Con. Compared to G93A-Con mice, G93A-Sim mice display earlier disease onset and shortened survival. (Data represent the mean ± SEM, n = 18 mice per group; *P ≤ 0.05, **P ≤ 0.01, ***P ≤ 0.001, #P ≤ 0.05, ##P ≤ 0.01, ###P ≤ 0.001).
Fig. 4
Fig. 4. Simvastatin blocked the maturation of autophagosomes in spinal MNs of SOD1G93A mice.
A Immunofluorescence labeling of P62 (green), LC3 (red), and DAPI (blue) in the lumbar spinal cord MNs of G93A-Sim and G93A-Con mice at 120 days, respectively (Scale bars, 10 μm). White arrowheads show the colocalization of P62 and LC3. Analysis of the ratio of colocalization of P62 and LC3. B Immunofluorescence labeling of LAMP2 (green), LC3 (red), and DAPI (blue) in MNs at 120 days (Scale bars, 10 μm). White arrowheads show the colocalization of LAMP2 and LC3. Analysis of the ratio of colocalization of LAMP2 and LC3. (Data represent the mean ± SEM, n = 5 mice per group; statistical significance was assessed by an unpaired t-test, *P ≤ 0.05).
Fig. 5
Fig. 5. Simvastatin blocked Rab7 localization to membranes in MNs from SOD1G93A mice.
A Immunofluorescence labeling of Rab7 (red) in NeuN-positive motoneurons (green) at 120 days (Scale bars, 10 μm). B Quantitative analysis of Rab7-positive puncta. C Western blot analysis of total Rab7 in the lumbar spinal cord at 120 days. D Quantification of total Rab7 levels. E Immunostaining of Rab7 (red) and GFAP (green), Rab7 (red) and Iba1 (green) in the lumbar spinal cord at 120 days (Scale bars, 20 μm). Nuclei were stained with DAPI (blue). White arrowheads show the portions of GFAP+/Rab7+ and Iba1+/Rab7+, respectively. (Data represent the mean ± SEM, n = 5 mice per group; statistical significance was assessed by one-way ANOVA or an unpaired t-test, *P ≤ 0.05, **P ≤ 0.01, ***P ≤ 0.001, #P ≤ 0.05, ##P ≤ 0.01, ###P ≤ 0.001).
Fig. 6
Fig. 6. Simvastatin inhibited Rab7 localization to membranes in NSC34-hSOD1G93A cells.
A The expression of Rab7 protein in total cell, membranes, cytosol for each group by western blot analysis. NSC34-E and NSC34-hSOD1G93A cells were incubated with Simvastatin (1 µM) for 24 h. B Rab7-positive structures (red) in NSC34-E and NSC34-hSOD1G93A cells treated or untreated with simvastatin (1 µM) for 24 h. Nuclei were stained with DAPI (blue, Scale bars, 5 μm). C Quantification of Rab7 protein in total cell, membranes, cytosol for each group. D Quantitative analysis of intracellular Rab7 puncta in each group. (Data represent the mean ± SEM, n = 20 cells per group; statistical significance was assessed by one-way ANOVA or an unpaired t-test, *P ≤ 0.05, **P ≤ 0.01, ***P ≤ 0.001, #P ≤ 0.05, ##P ≤ 0.01, ###P ≤ 0.001).
Fig. 7
Fig. 7. Effect of simvastatin on the mevalonate pathway in SOD1G93A mice and NSC34-hSOD1G93A cells.
A Schemetic of the mevalonate pathway. B Western blot analysis of levels of HMGCR, FDPS, and RABGGTA in the lumbar spinal cord at 120 days. C Western blot analysis of the levels of HMGCR, FDPS, and RABGGTA in each group. NSC34-E and NSC34-hSOD1G93A cells were treated with Simvastatin (1 µM) for 24 h. D Quantitative analysis of expression of HMGCR, FDPS, and RABGGTA in WT and SOD1G93A mice treated or untreated with simvastatin respestively. E Quantitation of HMGCR, FDPS, and RABGGTA in NSC34-E and NSC34-hSOD1G93A cells treated or untreated with simvastatin. (Data represent the mean ± SEM, n = 5 mice or 20 cells per group; statistical significance was assessed by one-way ANOVA or an unpaired t-test, *P ≤ 0.05, **P ≤ 0.01, ***P ≤ 0.001, #P ≤ 0.05, ##P ≤ 0.01, ###P ≤ 0.001).
Fig. 8
Fig. 8. FPP or GGPP rescued defects of autophagic flux in simvastatin-treated NSC34-hSOD1G93A cells.
AD Representative intensity projections from NSC34-hSOD1G93A cells untreated or treated with the indicated chemicals: simvastatin (1 µM), simvastatin (1 µM) + FPP (10 µM) or simvastatin (1 µM) + GGPP (10 µM) for 24 h. Nuclei were stained with DAPI (blue). A Immunofluorescence labeling of P62 (green) and LC3 (red). P62- and LC3-double positive puncta indicating autophagosome formation (Scale bars, 5 μm). B Immunostaining of LAMP2 (green) and LC3 (red) in per cell group. Double positive structures for LAMP2 and LC3 representing fusion of autophagosomes with lysosomes (Scale bars, 5 μm). C Immunofluorescence labeling of P62 (green) and SOD1 (red) in per cell group (Scale bars, 5 μm). D Immunofluorescence labeling of LAMP2 (green) and Rab7 (red) in per cell group (Scale bars, 5 μm).
Fig. 9
Fig. 9. Inhibition of Rab7 recruitment to lysosome by CID1067700 aggravated defect of late autophagic flux in NSC34-hSOD1G93A cells.
AC Simvastatin-treated NSC34-hSOD1G93A cells were incubated with or without GGPP (10 µM) for 24 h, and were treated with GGPP (10 μM) for 24 h combined with CID1067700 (40 μM) for 2 h before cell harvesting. CID1067700, a late endosome GTPase Rab7 receptor antagonist. Nuclei were stained with DAPI (blue). A Immunofluorescence labeling of Rab7 (red) and LAMP2 (green) in per cell group. B Immunofluorescence labeling of LC3 (red) and P62 (green) in per cell group. C Immunofluorescence labeling of LC3 (red) and LAMP2 (green) in the per cell group. (Scale bars, 10 μm). D Schematic view of the potential mechanisms by which simvastatin inhibited Rab7-driven membrane fusion of autophagosomes with lysosomes, leading to aggravated impairment of late autophagic flux and accelerated neuron death.

References

    1. Brown, R. H. & Al-Chalabi, A. Amyotrophic lateral sclerosis. N. Engl. J. Med. 377, 162–172 (2017). - PubMed
    1. Turner, M. R. et al. Genetic screening in sporadic ALS and FTD. J. Neurol. Neurosurg. Psychiatry88, 1042–1044 (2017). - PMC - PubMed
    1. Nguyen, D., Thombre, R. & Wang, J. Autophagy as a common pathway in amyotrophic lateral sclerosis. Neurosci. Lett.697, 34–48 (2019). - PMC - PubMed
    1. Ferraiuolo, L., Kirby, J., Grierson, A. J., Sendtner, M. & Shaw, P. J. Molecular pathways of motor neuron injury in amyotrophic lateral sclerosis. Nat. Rev. Neurol.7, 616–630 (2011). - PubMed
    1. Butti, Z. & Patten, S. A. RNA dysregulation in amyotrophic lateral sclerosis. Front. Genet.9, 712 (2018). - PMC - PubMed

Publication types