. 2021 Apr 12;12(4):391.
doi: 10.1038/s41419-021-03670-3.

TRIM39 deficiency inhibits tumor progression and autophagic flux in colorectal cancer via suppressing the activity of Rab7

Affiliations

TRIM39 deficiency inhibits tumor progression and autophagic flux in colorectal cancer via suppressing the activity of Rab7

Jia Hu et al. Cell Death Dis. .

Abstract

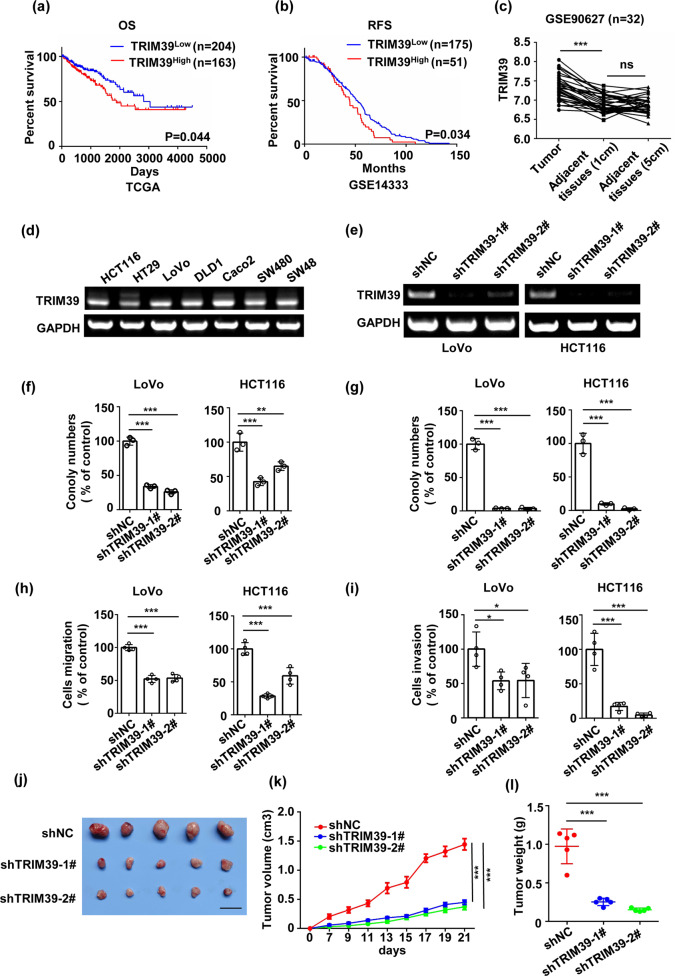
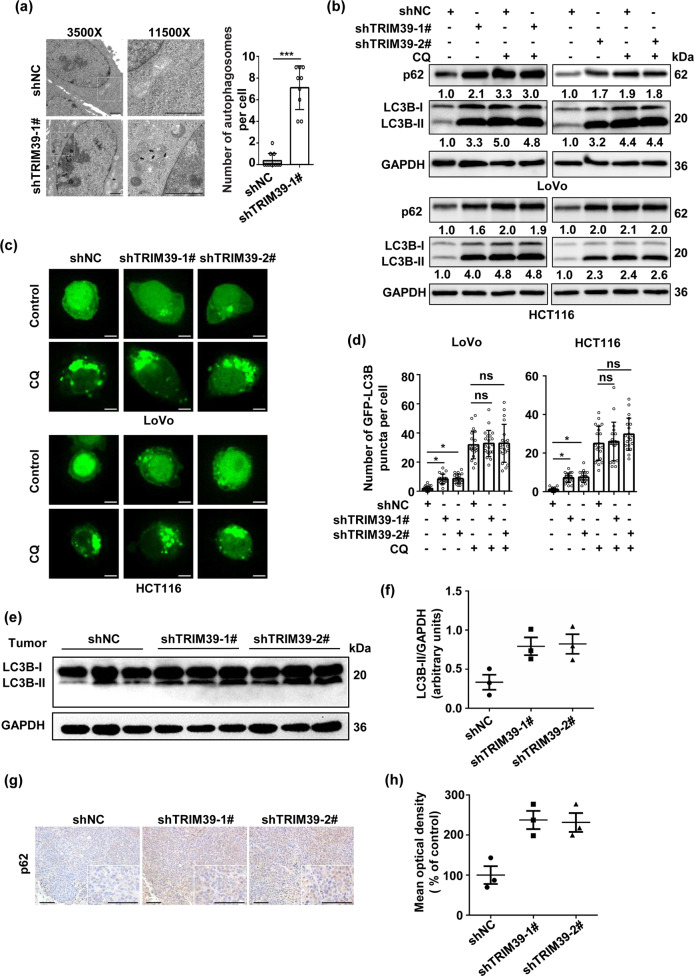
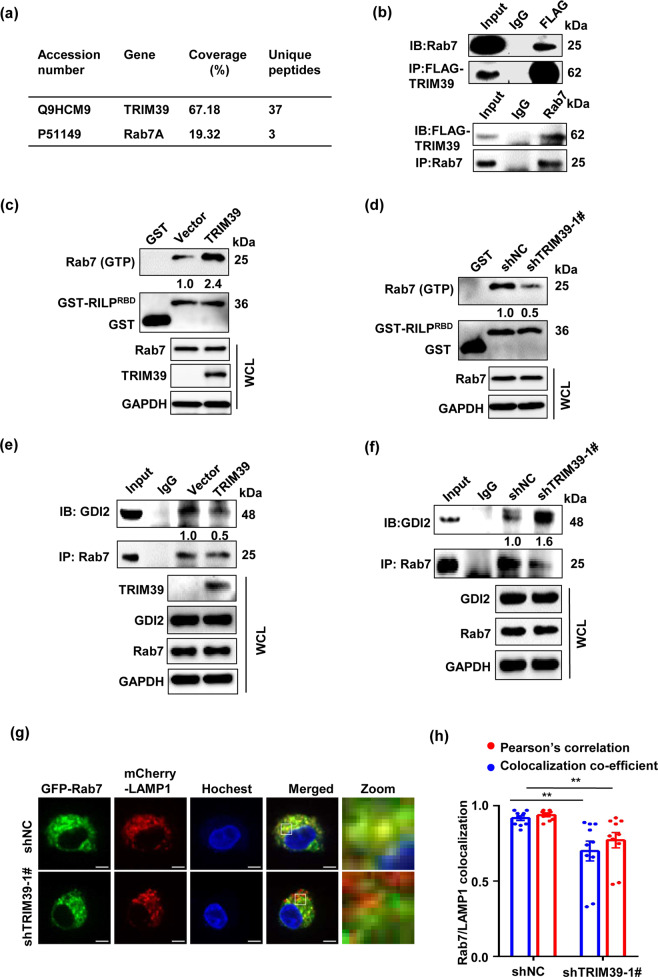
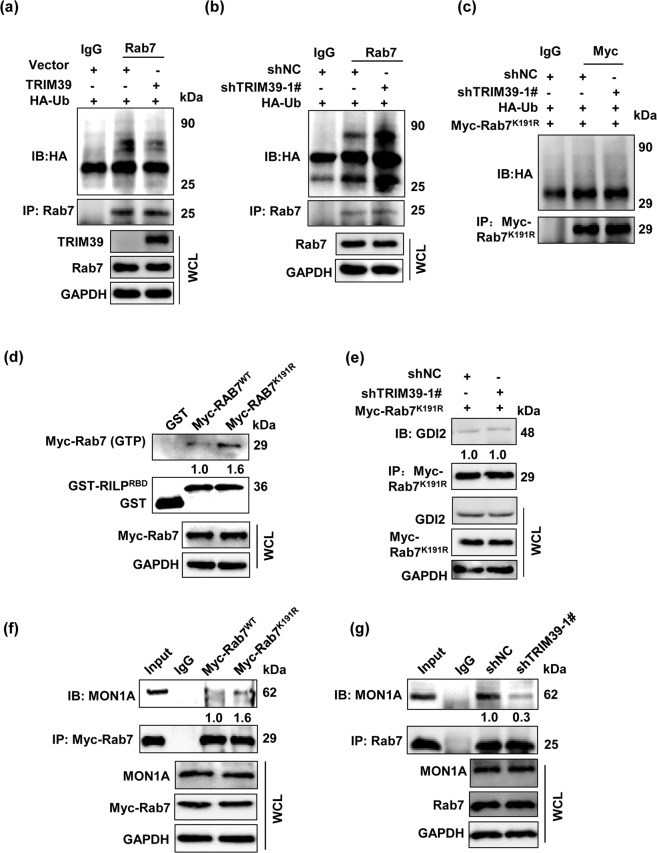
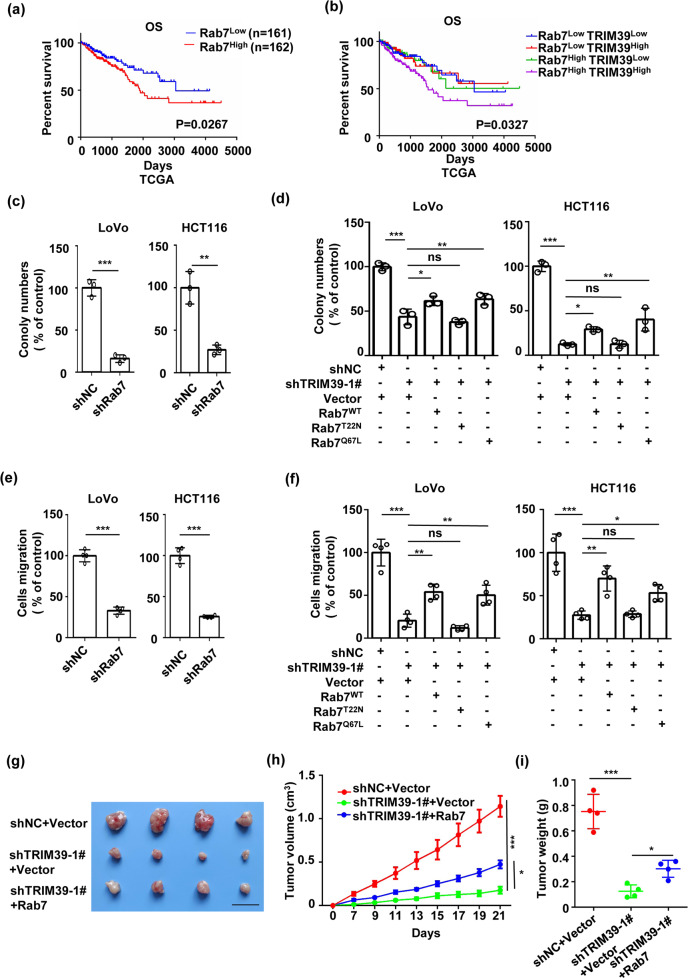
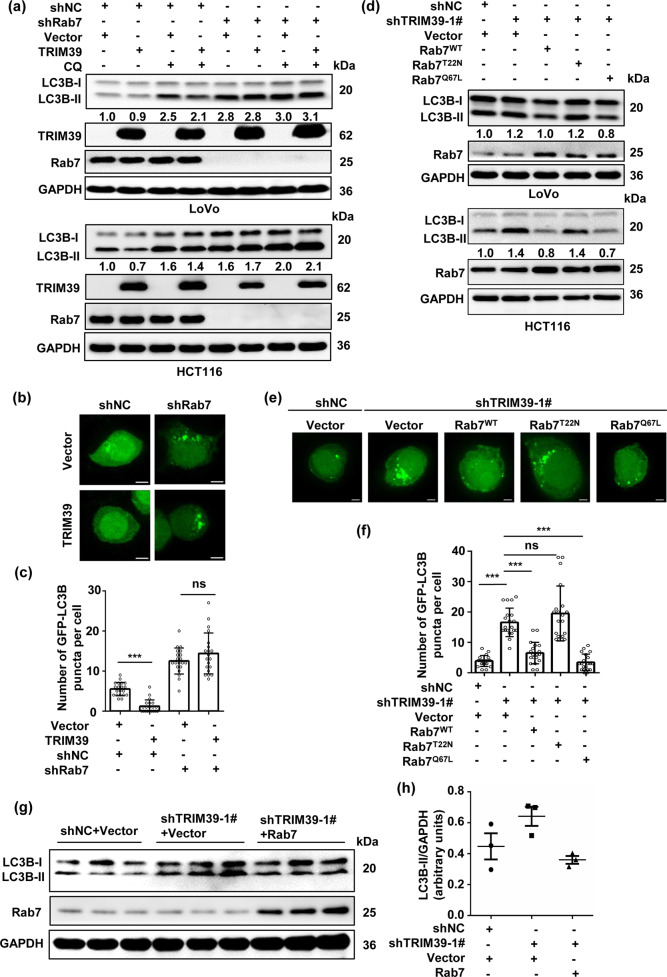
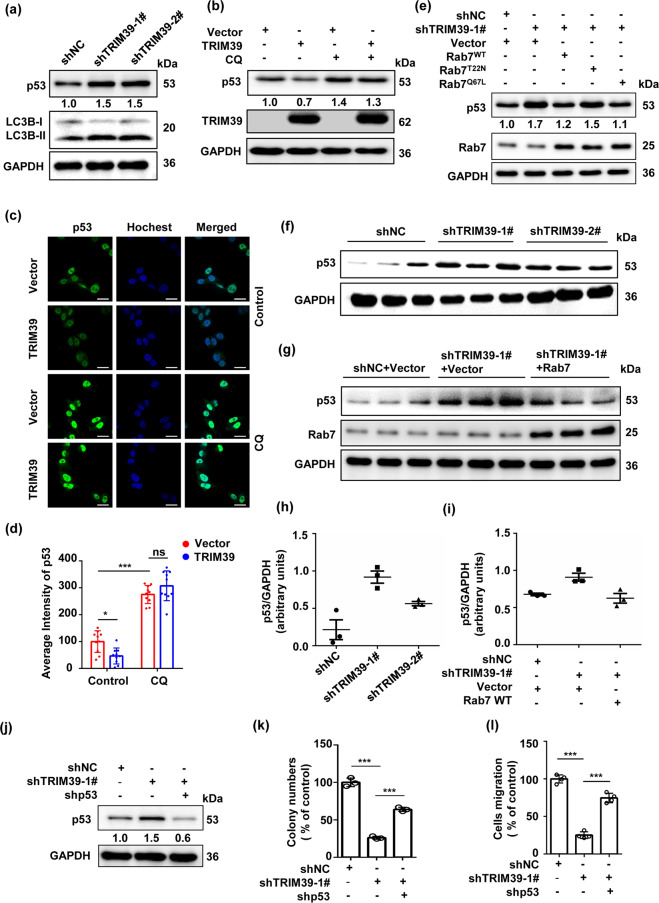
The biological function of TRIM39, a member of TRIM family, remains largely unexplored in cancer, especially in colorectal cancer (CRC). In this study, we show that TRIM39 is upregulated in tumor tissues compared to adjacent normal tissues and associated with poor prognosis in CRC. Functional studies demonstrate that TRIM39 deficiency restrains CRC progression in vitro and in vivo. Our results further find that TRIM39 is a positive regulator of autophagosome-lysosome fusion. Mechanistically, TRIM39 interacts with Rab7 and promotes its activity via inhibiting its ubiquitination at lysine 191 residue. Depletion of TRIM39 inhibits CRC progression and autophagic flux in a Rab7 activity-dependent manner. Moreover, TRIM39 deficiency suppresses CRC progression through inhibiting autophagic degradation of p53. Thus, our findings uncover the roles as well as the relevant mechanisms of TRIM39 in CRC and establish a functional relationship between autophagy and CRC progression, which may provide promising approaches for the treatment of CRC.


Conflict of interest statement

The authors declare no competing interests.

Figures

Fig. 1
Fig. 1. TRIM39 deficiency suppresses CRC progression in vitro and in vivo.
a Kaplan–Meier survival analysis of overall survival (OS) based on TRIM39 expression in the CRC tissues from TCGA database. b Kaplan–Meier survival analysis of relapse-free survival (RFS) based on TRIM39 expression in the CRC tissues from GSE14333 database. c Analysis of TRIM39 mRNA levels in primary tumor and adjacent normal tissue in GSE90627 database. Two-way classification ANOVA. ***P < 0.001; ns no significance. d RT-PCR analysis of TRIM39 mRNA expression in HCT116, HT29, LoVo, DLD1, Caco2, SW480, and SW48 cells. e RT-PCR analysis of TRIM39 knockdown efficiency in LoVo and HCT116 cells infected with lentiviruses containing negative control shRNA (shNC) or two independent shRNAs against TRIM39. f, g The colony-formation assay (f) and soft agar colony-formation assay (g) of LoVo and HCT116 cells with TRIM39 stably knocked down. Data are shown as mean ± SD. n = 3 samples per group. One-way ANOVA. **P < 0.01; ***P < 0.001. h, i The migration assay (h) and invasion assay (i) of LoVo and HCT116 cells with TRIM39 stably knocked down. The average number of cells per field were calculated. Data are shown as mean ± SD. n = 3 samples per group, four fields per sample. One-way ANOVA. *P < 0.05; ***P < 0.001. jl HCT116 cells (shNC, shTRIM39-1#, shTRIM39-2#) were subcutaneously injected into nude mice at a dose of 2 × 106 cells per mouse. Representative images of the xenograft tumors (j), tumor growth curves (k), and tumor weight (l) are shown. n = 5 per group; data are shown as mean ± SD for tumor weight and mean ± SEM for tumor growth. Scale bar, 2 cm. One-way ANOVA. ***P < 0.001.
Fig. 2
Fig. 2. Knockdown of TRIM39 results in the accumulation of autophagosomes in CRC.
a TEM analysis of TRIM39 stably knocked down HCT116 cells. Representative TEM images are shown. Black arrows indicate autophagic structures. The number of autophagic structures per cell was quantified. Data are shown as mean ± SD. Ten cells were scored. Scale bar, 1 μm. Student’s t test. ***P < 0.001. b Western blot analysis of p62 and LC3B-II levels in TRIM39 stably knocked down LoVo and HCT116 cells treated with CQ (50 nM) for 4 h. c Representative confocal microscopic images of GFP-LC3B puncta in TRIM39 stably knocked down LoVo and HCT116 cells. Scale bar, 5 μm. d Quantification of GFP-LC3B puncta per cell treated as in c. Data are shown as mean ± SD. Twenty cells were scored. One-way ANOVA. *P < 0.05; ns no significance. e Western blot analysis of LC3B-II levels of tumor tissues from different groups in Fig. 1j. f Quantification (arbitrary units) of LC3B-II levels relative to GAPDH in tumor tissues from e. Data are shown as mean ± SD. g Immunochemical staining for p62 of tumor tissues from different groups in Fig. 1j. Representative immunochemical staining images are shown. Scale bar, 50 μm. h Quantification of p62 levels (mean optical density) in tumor tissues from g.
Fig. 3
Fig. 3. Knockdown of TRIM39 impairs autophagic flux in CRC cell lines.
a TRIM39 stably knocked down LoVo cells and control cells (shNC) were treated with EBSS for the indicated times. The levels of p62 and LC3B-II were detected by western blot. b LoVo cells were co-transfected with the indicated plasmids and polyQ80-luciferase (or polyQ19-luciferase) for 48 h. TRIM39 stably knocked down LoVo cells were transfected with polyQ80-luciferase or polyQ19-luciferase for 48 h. Dual Luciferase Reporter System was used to analyze PolyQ80–luciferase/polyQ19-luciferase ratios. Degradation of polyQ19 was served as an internal control. The average value in empty vector-transfected cells or shNC cells was normalized as 1. Data are shown as mean ± SD. n = 3. Student’s t test for the first two columns and one-way ANOVA for the last three columns. *P < 0.05; **P < 0.01. c TRIM39 stably knocked down LoVo cells and control cells (shNC) were transfected with RFP-GFP-LC3B for 48 h and incubated in growth medium or EBSS for the last 2 h. RFP-GFP-LC3B distribution was observed by confocal microscopy. Representative confocal microscopy images are shown. Scale bar, 5 μm. d Quantification of GFP-positive and RFP-positive LC3-labeled puncta per cell treated as in c. Data are shown as mean ± SD. Twenty cells were scored. One-way ANOVA. ***P < 0.001; ns no significance. e TRIM39 stably knocked down LoVo cells and control cells (shNC) were co-transfected with GFP-LC3B and mCherry-LAMP1 for 48 h and incubated in growth medium or EBSS for the last 2 h. Co-localization of GFP-LC3B with mCherry-LAMP1 was observed by confocal microscopy. Representative confocal microscopy images are shown. Scale bar, 5 μm. f Quantification of the total GFP-LC3B puncta and the GFP-LC3B puncta colocalized with mCherry-LAMP1 per cell treated as in e. Data are shown as mean ± SD. Twenty cells were scored. One-way ANOVA. *P < 0.05; ***P < 0.001.
Fig. 4
Fig. 4. Rab7 is a binding partner of TRIM39.
a HEK293T cells were transfected with empty vector or FLAG-TRIM39 for 48 h. Total cell lysates were subjected to immunoprecipitation with anti-FLAG antibody. Rab7 was identified via mass spectrometry. b HEK293T cells were transfected with FLAG-TRIM39 for 48 h. Total cell lysates were immunoprecipitated with anti-FLAG or anti-Rab7 antibodies. Rab7 and FLAG-TRIM39 were detected by western blot. c, d GST-RILPRBD fusion protein immobilized on glutathione-Sepharose beads were incubated with Vector/FLAG-TRIM39-overexpressed LoVo cell lysates (c) or shNC/TRIM39 stably knocked down LoVo cell lysates (d) at 4 °C for 4 h. Rab7 and GST were detected in the washed beads by western blot. e, f Control (Vector) and FLAG-TRIM39-overexpressed LoVo cell lysates (e) or shNC and TRIM39 stably knocked down LoVo cell lysates (f) were extracted and immunoprecipitated using an anti-Rab7 antibody. Then the precipitates were examined with anti-GDI2. g shNC and TRIM39 stably knocked down LoVo cells were co-transfected with GFP-Rab7 and mCherry-LAMP1 for 48 h. Representative confocal microscopy images are shown. Scale bar, 5 μm. h Quantification of co-localization efficient and Pearson correlation of GFP-Rab7 and mCherry-LAMP1 treated as in g. 10 cells were analyzed. Data are shown as mean ± SEM. One-way ANOVA. **P < 0.01.
Fig. 5
Fig. 5. TRIM39 decreases the ubiquitination of Rab7 at lysine 191 residue.
a Vector or FLAG-TRIM39 was co-transfected with HA-ubiquitin into HCT116 cells for 48 h. Cell lysates were extracted and immunoprecipitated using an anti-Rab7 antibody. Then the precipitates were examined with anti-HA. b shNC and TRIM39 stably knocked down HCT116 cells were transfected with HA-ubiquitin for 48 h. Cell lysates were extracted and immunoprecipitated using an anti-Rab7 antibody. Then the precipitates were examined with anti-HA. c Myc-Rab7K191R was co-transfected with HA-ubiquitin into shNC or TRIM39 stably knocked down HCT116 cells for 48 h. Cell lysates were immunoprecipitated with anti-Myc antibody and immunoblotted with anti-HA and anti-Myc antibody. d GST-RILPRBD fusion protein immobilized on glutathione-Sepharose beads were incubated with Myc-Rab7WT or Myc-Rab7K191R overexpressed HCT116 cell lysates at 4 °C for 4 h. Rab7 and GST were detected in the washed beads by western blot. e shNC and TRIM39 stably knocked down HCT116 cells were transfected with Myc-Rab7K191R for 48 h. Cell lysates were immunoprecipitated with anti-Myc antibody and immunoblotted with anti-GDI2 and anti-Myc antibody. f HCT116 cells were transfected with Myc-Rab7WT or Myc-Rab7K191R for 48 h. Cell lysates were immunoprecipitated with anti-Myc antibody and immunoblotted with anti-MON1A and anti-Myc antibody. g shNC or TRIM39 stably knocked down HCT116 cell lysates were extracted and immunoprecipitated with anti-Rab7 antibody. MON1A was detected by western blot.
Fig. 6
Fig. 6. TRIM39 depletion suppresses CRC through inhibiting Rab7 activity.
a Kaplan–Meier survival analysis of overall survival (OS) based on Rab7 expression in the CRC tissues from TCGA database. b Kaplan–Meier survival analysis of overall survival (OS) based on TRIM39 and Rab7 expression in the CRC tissues from TCGA database. Patients were classified as TRIM39HighRab7High, TRIM39LowRab7High, TRIM39HighRab7Low, and TRIM39LowRab7Low groups. c The colony-formation assay of LoVo and HCT116 cells with Rab7 stably knocked down. Data are shown as mean ± SD. n = 3 samples per group. Student’s t test. **P < 0.01; ***P < 0.001. d Colony-formation assay of TRIM39 stably knocked down LoVo and HCT116 cells infected with Empty vector, Rab7WT, Rab7T22N, and Rab7Q67L overexpression lentivirus. Data are shown as mean ± SD. n = 3 samples per group. One-way ANOVA. *P < 0.05; **P < 0.01; ***P < 0.001; ns no significance. e The migration assay of LoVo and HCT116 cells with Rab7 stably knocked down. The average number of cells per field was calculated. Data are shown as mean ± SD. n = 3 samples per group, four fields per sample. Student’s t test. ***P < 0.001. f The migration assay of TRIM39 stably knocked down LoVo and HCT116 cells infected with Empty vector, Rab7WT, Rab7T22N, and Rab7Q67L overexpression lentivirus. The average number of cells per field was calculated. Data are shown as mean ± SD. n = 3 samples per group, four fields per sample. One-way ANOVA. *P < 0.05; **P < 0.01; ***P < 0.001; ns no significance. gi HCT116 cells (shNC, shTRIM39-1#) were infected with Vector or Rab7 overexpression lentivirus and then subcutaneously injected into nude mice. Representative images of the xenograft tumors (g), tumor growth curves (h), and tumor weight (i) are shown. n = 4 per group; Data are shown as mean ± SD for tumor weight and mean ± SEM for tumor growth. Scale bar, 2 cm. One-way ANOVA. *P < 0.05; ***P < 0.001.
Fig. 7
Fig. 7. TRIM39 promotes autophagic flux via Rab7.
a Rab7 stably knocked down and control LoVo and HCT116 cells were transfected with empty vector or FLAG-TRIM39 plasmids for 48 h and then treated with or without CQ (50 nM) for the last 4 h. The levels of LC3B-II were detected by western blot. b Representative confocal microscopic images of GFP-LC3B puncta in Rab7 stably knocked down LoVo cells transfected with empty vector or FLAG-TRIM39 for 48 h. Scale bar, 5 μm. c Quantification of GFP-LC3B puncta per cell treated as in b. Data are shown as mean ± SD. Twenty cells were scored. One-way ANOVA. ***P < 0.001; ns no significance. d TRIM39 stably knocked down LoVo and HCT116 cells were infected with empty vector, Rab7WT, Rab7T22N, and Rab7Q67L overexpression lentivirus. The levels of LC3B-II were detected by western blot. e TRIM39 stably knocked down LoVo cells were infected with empty vector, Rab7WT, Rab7T22N, and Rab7Q67L overexpression lentivirus. GFP-LC3B puncta was observed by confocal microscopy. Representative images are shown. Scale bar, 5 μm. f Quantification of GFP-LC3B puncta per cell treated as in e. Data are shown as mean ± SD. Twenty cells were scored. One-way ANOVA. ***P < 0.001; ns no significance. g Western blot analysis of LC3B-II levels of tumor tissues from different groups in Fig. 6g. h Quantification (arbitrary units) of LC3B-II levels relative to GAPDH in tumor tissues from g. Data are shown as mean ± SD.
Fig. 8
Fig. 8. Inhibiting autophagic degradation of p53 reverses the TRIM39 deficiency-suppressed CRC progression.
a Western blot assay of p53 levels in TRIM39 stably knocked down HCT116 cells. b HCT116 cells were transfected with empty vector or FLAG-TRIM39 for 48 h and treated with or without CQ (50 nM) for the last 4 h. The levels of p53 were detected by western blot. c HCT116 cells were transfected with empty vector or FLAG-TRIM39 for 48 h and treated with or without CQ (50 nM) for the last 4 h. Cells were fixed and immunofluorescently stained for p53. Representative confocal microscopic images are shown. Scale bar, 20 μm. d The fluorescence intensity of p53 in c was calculated. Data are shown as mean ± SD. Ten images were scored. One-way ANOVA. *P < 0.05; ***P < 0.001; ns no significance. e TRIM39 stably knocked down HCT116 cells were infected with empty vector, Rab7WT, Rab7T22N, and Rab7Q67L overexpression lentivirus. The levels of p53 were detected by western blot. f Western blot analysis of p53 levels of tumor tissues from different groups in Fig. 1j. g Western blot analysis of p53 levels of tumor tissues from different groups in Fig. 6g. h Quantification (arbitrary units) of p53 levels relative to GAPDH in tumor tissues from f. Data are shown as mean ± SD. i Quantification (arbitrary units) of p53 levels relative to GAPDH in tumor tissues from g. Data are shown as mean ± SD. j Western blot assay of p53 levels in TRIM39-depleted HCT116 cells with p53 stably knocked down. k The colony-formation assay of TRIM39-depleted HCT116 cells with p53 stably knocked down. Data are shown as mean ± SD. n = 3 samples per group. One-way ANOVA. ***P < 0.001. l The migration assay of TRIM39-depleted HCT116 cells with p53 stably knocked down. The average number of cells per field was calculated. Data are shown as mean ± SD. n = 3 samples per group, four fields per sample. One-way ANOVA. ***P < 0.001.

Similar articles

Cited by

References

    1. Bray F, et al. Global cancer statistics 2018: GLOBOCAN estimates of incidence and mortality worldwide for 36 cancers in 185 countries. CA Cancer J. Clin. 2018;68:394–424. doi: 10.3322/caac.21492. - DOI - PubMed
    1. Koveitypour Z, et al. Signaling pathways involved in colorectal cancer progression. Cell Biosci. 2019;9:97. doi: 10.1186/s13578-019-0361-4. - DOI - PMC - PubMed
    1. Zoratto F, et al. Focus on genetic and epigenetic events of colorectal cancer pathogenesis: implications for molecular diagnosis. Tumour Biol. 2014;35:6195–6206. doi: 10.1007/s13277-014-1845-9. - DOI - PubMed
    1. Devenport, S. N. & Shah, Y. M. Functions and implications of autophagy in colon cancer. Cells8, 1349 (2019). - PMC - PubMed
    1. He C, Klionsky DJ. Regulation mechanisms and signaling pathways of autophagy. Annu. Rev. Genet. 2009;43:67–93. doi: 10.1146/annurev-genet-102808-114910. - DOI - PMC - PubMed

Publication types

Substances