. 2021 Apr 12;12(1):2166.
doi: 10.1038/s41467-021-22436-1.

The Botrytis cinerea Crh1 transglycosylase is a cytoplasmic effector triggering plant cell death and defense response

Affiliations

The Botrytis cinerea Crh1 transglycosylase is a cytoplasmic effector triggering plant cell death and defense response

Kai Bi et al. Nat Commun. .

Abstract

Crh proteins catalyze crosslinking of chitin and glucan polymers in fungal cell walls. Here, we show that the BcCrh1 protein from the phytopathogenic fungus Botrytis cinerea acts as a cytoplasmic effector and elicitor of plant defense. BcCrh1 is localized in vacuoles and the endoplasmic reticulum during saprophytic growth. However, upon plant infection, the protein accumulates in infection cushions; it is then secreted to the apoplast and translocated into plant cells, where it induces cell death and defense responses. Two regions of 53 and 35 amino acids are sufficient for protein uptake and cell death induction, respectively. BcCrh1 mutant variants that are unable to dimerize lack transglycosylation activity, but are still able to induce plant cell death. Furthermore, Arabidopsis lines expressing the bccrh1 gene exhibit reduced sensitivity to B. cinerea, suggesting a potential use of the BcCrh1 protein in plant immunization against this necrotrophic pathogen.


Conflict of interest statement

The authors declare no competing interests.

Figures

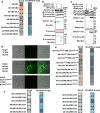
Fig. 1
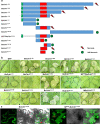
Fig. 1. Localization of BcCrh1 inside plant cells is required for induction of cell death.
a Plants were infiltrated with Agrobacterium strains that were transformed with the bccrh1 gene with or without secretion signal (SP). Images of necrotic lesions (a) were taken five days after Agroinfiltration. 35S:GFP: free GFP (control); 35S:BcCrh1-SP and 35S:MBcCrh1-SP: native and enzyme inactive BcCrh1 respectively, without secretion signal; 35S:SPPR3-BcCrh121–391 and 35S:SPPR3-MBcCrh121–391: fusion of the native and enzyme inactive BcCrh1 respectively, with PR3 plant signal peptide; bg Subcellular localization of GFP-fusion proteins. Leaves were harvested two days after Agroinfiltration, submerged for 20 min in 0.8 M mannitol to induce plasmolysis, and then samples were scanned by a confocal microscope. White asterisks mark apoplastic space between the cell wall (black arrow) and plasma membrane (red arrow) in plasmolysed plant cells. Left panel shows images of cells following Agroinfiltration with free GFP (control), right panel shows images following Agroinfiltration with BcCrh1-GFP fusion protein. b GFP without SP; c GFP fused to the BcCrh1 SP; d GFP fused to PR3 SP; e BcCrh1-GFP with native SP; f BcCrh1-GFP fused to PR3 SP; g MBcCrh1-GFP fused to PR3 SP. Bars = 20 μm. All the above experiments were repeated at least three times with similar results.
Fig. 2
Fig. 2. A stretch of 35 amino acids of BcCrh1 is necessary and sufficient for the induction of plant cell death.
a Schematic presentation of different BcCrh1 fragments that were used in Agroinfiltration assays. Green—SP, Red—the minimal region that was found to be sufficient for induction of cell death, Blue—other regions of the tested fragment. bc representative images of leaves following infiltrations with Agrobacterium strains that contain constructs encoding the different BcCrh1 fragments. b Pictures were taken five days after Agroinfiltration; c Leaves were harvested two days after Agroinfiltration, submerged for 20 min in 0.8 M mannitol to induce plasmolysis, and then samples were scanned by a confocal microscope. Typical apoplastic space between the cell wall and plasma membrane in plasmolysed plant cells is marked with red asterisks. Bars = 20 μm. All the above experiments were repeated at least three times with similar results.
Fig. 3
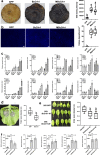
Fig. 3. A stretch of 53 amino acids at the N′ end of the protein mediates uptake of BcCrh1 by plant cells.
Following analysis of a series of deletion constructs, a minimal region suspected of being necessary for protein uptake was defined. a To test the delivery of heterologous proteins using the putative translocation signal, we generated two expression constructs with enzymatic inactive version of the apoplastic NIP BcXYG1 (MBcXyg1) (Zhu et al.). Blue—BcCrh1 SP, Red—MBcXyg1, Green—the suspected delivery sequence. Middle left— images of N. benthamiana leaves three days after Agroinfiltration. Leaves were bleached with ethanol (right images) and the necrotic area was calculated. Center lines of the boxplots show the medians, box limits indicate the 25th and 75th percentiles; whiskers cover the full range of values; all data points are plotted as black dots. Data are from 10 sample points from three independent biological replications. Different letters indicate statistical differences at P ≤ 0.001 (P = 6.05e−10) according to unpaired two-tailed Student’s t-test. b Images of tomato leaves 48 h after infiltration with 11 μM of purified BcCrh1-derived peptides, BcCrh175–144 and BcCrh121–144. c Tomato cell cultures (MsK8) were incubated for 18 h with 5.5 μM solution of GFP-tagged peptides (GFP-BcCrh175–144, GFP-BcCrh121–144, and GFP-BcCrh121–74), washed three times and visualized by a confocal microscope. Bars = 50 μm. The experiments were repeated three times with similar results.
Fig. 4
Fig. 4. BcCrh1 triggers plant immunity responses and enhances plant resistance to Botrytis infection.
a ROS accumulation. N. benthamiana leaves were Agroinfiltrated with free GFP, and native or enzymatic inactive (MBcCrh1) BcCrh1. After 48 h samples were stained with DAB, they were decolorized with ethanol and staining intensity was quantified with ImageJ. b Calose deposition. N. benthamiana leaves were infiltrated with 11 μM of purified proteins. Photomicrographs indicating callose deposition induced by BcCrh1 and MBcCrh1. After 24 h leaves were stained with aniline blue, bleached with ethanol, and images were captured with a fluorescent microscope (Bar = 50 μm). Callose levels were estimated by quantification of the number of spots per square millimeter using ImageJ. All data (n = 15 in (a), n = 12 in (b)) from three independent biological replicates are plotted as black dots. c Defense gene expression. Tomato leaves were infiltrated with purified proteins and relative expression levels of selected defense genes were determined by qRT-PCR 24 after 24 and 48 h. Values represent mean ±;SD (n = 9) from three independent biological replicates and three technical replicates. d Infection assay. N. benthamiana leaves were infiltrated with 11 μM of GFP (mock) or purified proteins, 48 h later the leaves were inoculated with B. cinerea mycelia plugs, the plants were incubated for an additional 72 h in a moist chamber and then symptoms were recorded. Data are from three independent experiments, each with four replications. e Infection assay of A. thaliana transgenic plants. Leaves of transgenic plants that express GFP (35S:GFP) or BcCrh1 (two independent plants, 35S:BcCrh-1# and 35S:BcCrh-2#) were inoculated with droplets of B. cinerea spore suspension, the plants were incubated in a moist chamber and symptoms were recorded 48 hpi. Images show all the inoculated leaves from a single plant. Graph shows data of three independent biological replications (n = 44, 36, 36). Whiskers of the boxplots in (a), (b), (d), and (e) show the minimum and maximum values; center lines of boxplots display the median values; box limits indicate the 25th and 75th percentiles. f Defense gene expression of transgenic A. thaliana plants. Relative expression levels of defense-related marker genes were measured by qRT-PCR. Values are means ± SD (n = 9) from three independent biological replicates and three technical replicates. Asterisks indicate significant difference between control (35S:GFP) and BcCrh1 transgenic lines according to one-way ANOVA, P ≤ 0.001. In all other graphs, different letters indicate statistical differences at P ≤ 0.01 according to one-way ANOVA.
Fig. 5
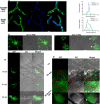
Fig. 5. Subcellular localization of BcCrh1 during saprophytic growth and host infection.
a Intracellular localization of BcCrh1 during saprophytic growth. Spores of BcCrh1-GFP strain were cultured in liquid PDB medium for 12 h, vacuoles (top) and nuclei (bottom) were stained with CMAC and DAPI, respectively, and samples were visualized using a Confocal microscope. Scale bars =  5 μm. The graph shows fluorescent intensity profiles of GFP/CMAC signals (top) and GFP/DAPI signals (bottom) in transects (white arrowheads). Y axis, GFP and CMAC or DAPI fluorescence intensity; X axis, transect length (μm). b Differential distribution of BcCrh1 in mycelia and infection cushions in vitro. Spores were germinated on a glass slide in PDB medium. At 24 h the GFP signal accumulates in the entire mycelium and in initiating infection cushions (left, marked with red arrow), at 36 h the signal is detected only in the mature infection cushions (right, indicated with white arrows). Scale bar = 20 μm. cd Onion epidermis infection assay with cytoplasmic GFP and BcCrh1-GFP strains. c Images showing secretion of the protein from hyphal tips at early time points (12, 21 hpi) and from infection cushions at 36 hpi. Scale bars = 50 μm at 12 hpi and 20 μm in all other images. d Intracellular localization of secreted BcCrh1-GFP protein in plasmolysed onion cells 45 hpi. Infection area is marked by red dashed line. BcCrh1-derived GFP signal is observed in the cytoplasmic space of plasmolysed onion cells outside the invasion area (marked with arrows). Scale bars = 20 μm. All the experiments were repeated three times with similar results.
Fig. 6
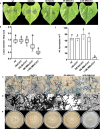
Fig. 6. Over expression of MBcCrh1 causes reduced pathogenicity and developmental defects.
ab Infection assay. Bean leaves were inoculated with spore suspensions of B. cinerea wild type (wt), bccrh1 deletion (ΔBcCrh1), bccrh1 overexpression (OE-BcCrh1), and strains over-expressing the enzyme inactive (MBcCrh1) protein in wild type (OE-MBcCrh1) or bccrh1 deletion (Δ/OE-MBcCrh1) genetic background. Symptoms were photographed and the lesion diameter was recorded 72 hpi. Box limits show the 25th and 75th percentiles. The center lines of boxplots indicate the medians values; whiskers extend to minimum and maximum values from the 25th and 75th percentiles; all data are indicated as black dots. At least 40 sample points from three independent biological replicates were used for statistical analysis. cd Lactophenol cotton blue and lactophenol trypan blue staining of infected leaves. Leaf tissue was harvested at the designated time points and stained with lactophenol cotton blue, which stains only the exposed hyphae (c), and with lactophenol trypan blue, which stains both exposed and intracellular (red arrows) hyphae (d). Bar = 20 μm. Note the near absence of intracellular hyphae in the Δ/OE-MBcCrh1 mutant, which indicates penetration defects. All the experiments were repeated three times with similar results. ef Mycelium and spore production. Fungi were cultured on solid GB5-Glucose medium and grown at 20 °C with continuous light. Pictures were taken (e) and spores counted after eight days of incubation. Data represent mean ± SD from three independent biological replicates. Different letters in (b) and (f) indicate statistical differences at P ≤ 0.01 according to one-way ANOVA.
Fig. 7
Fig. 7. The pathogenicity and developmental defects induced by MBcCrh1 depend on expression levels.
The following strains were characterized: B. cinerea wild type (wt), enzyme inactive BcCrh1 with the native promoter in the background of bccrh1 deletion (Δ/NP-MBcCrh1), overexpression of MBcCrh1 with mutation of C26 and C33 in a background of bccrh1 deletion (Δ/OE-MBcCrh1C26AC33A), and overexpression of MBcCrh1 in a background of bccrh1 deletion (Δ/OE-MBcCrh1). ad Spore production and shape. Fungi were cultured on solid GB5-Glucose medium and grown at 20°C with continuous light. Pictures of plates (a) and spores (c) were taken after eight days of incubation. Spores were harvested and average spore numbers (b) and spore dimensions (d) were determined. Arrows indicate spores of the Δ/OE-MBcCrh1 strain with abnormal morphology. For spore numbers, data represent mean ± SD from three independent biological replications. For spore dimensions, the ratio of length/width was calculated. Data of at least 30 spores from three independent biological replications were used for statistical analysis. ef Bean leaves were inoculated with spore suspensions of the different strains, pictures were taken and lesion size recorded 72 hpi. At least 32 sample data from three independent biological replications were used for statistical analysis. In boxplots (d and f), center lines represent the medians, box edges show the 25th and 75th percentiles; whiskers extend to minimum and maximum values from the 25th and 75th percentiles; all present data are indicated as black dots. Different letters in d and f indicate statistical differences at P ≤ 0.01 according to one-way ANOVA.
Fig. 8
Fig. 8. BcCrh protein dimerization.
a Yeast two-hybrid assay (Y2H) of BcCrh1 and MBcCrh1 homodimer formation. SD/-Trp-Leu medium was used to confirm the transformation events. SD/-Trp-Leu-His-Ade medium containing X-α-gal was used to screen yeast strains with the positive protein-protein interaction. bd Confirmation of BcCrh1 dimer formation by in vitro pull down assay (b), Co-immunoprecipitation (Co-IP) assay (c) and bimolecular fluorescence complementation (BiFC) assay (d). b For the in vitro pull-down assay, BcCrh1-myc was transiently expressed in N. benthamiana and pull down was performed with BcCrh1-His recombinant protein conjugated with histidine beads. Protein from non-infiltrated leaves (WT lysate) was used as negative control. c For the Co-IP experiment, BcCrh1-myc or empty-myc were co-expressed with the BcCrh1-HA in N. benthamiana. BcCrh1-myc, but not empty-myc, co-immuno-precipitated with BcCrh1-HA conjugated to HA beads. c BiFC was conducted with B. cinerea transgenic strain expressing split GFP-BcCrh1 proteins (N′GFP-BcCrh1/C’GFP-BcCrh1). A strain expressing split GFP fused to BcCrh1C26AC33A (N’GFP-BcCrh1C26AC33A/C′GFP-BcCrh1C26AC33A) did not show any fluorescence, indicating a lack of dimer formation by this protein derivative. Bar = 10  μm. The experiments were repeated three times with similar results. e Effect of point mutations or deletion at the N’ part of BcCrh1 on homo- and heterodimer formation. f Y2H assay of interaction between different BcCrh members.

Similar articles

Cited by

References

    1. Amselem, J. et al. Genomic analysis of the necrotrophic fungal pathogens Sclerotinia sclerotiorum and Botrytis cinerea. PLoS Genet. 7, e1002230 (2011). - PMC - PubMed
    1. Dean R, et al. The Top 10 fungal pathogens in molecular plant pathology. Mol. Plant Pathol. 2012;13:414–430. doi: 10.1111/j.1364-3703.2011.00783.x. - DOI - PMC - PubMed
    1. Eizner E, et al. Characterization of Botrytis–plant interactions using PathTrack©—an automated system for dynamic analysis of disease development. Mol. Plant Pathol. 2017;18:503–512. doi: 10.1111/mpp.12410. - DOI - PMC - PubMed
    1. Shlezinger N, et al. Anti-apoptotic machinery protects the necrotrophic fungus Botrytis cinerea from host-induced apoptotic-like cell death during plant infection. PLoS Pathog. 2011;7:e1002185. doi: 10.1371/journal.ppat.1002185. - DOI - PMC - PubMed
    1. Zhu W, et al. BcXYG1, a secreted xyloglucanase from Botrytis cinerea, triggers both cell death and plant immune responses. Plant Physiol. 2017;175:438–456. doi: 10.1104/pp.17.00375. - DOI - PMC - PubMed

Publication types

Supplementary concepts

LinkOut - more resources