. 2021 Apr 12;12(1):2147.
doi: 10.1038/s41467-021-22375-x.

Human anogenital monocyte-derived dendritic cells and langerin+cDC2 are major HIV target cells

Affiliations

Human anogenital monocyte-derived dendritic cells and langerin+cDC2 are major HIV target cells

Jake W Rhodes et al. Nat Commun. .

Abstract

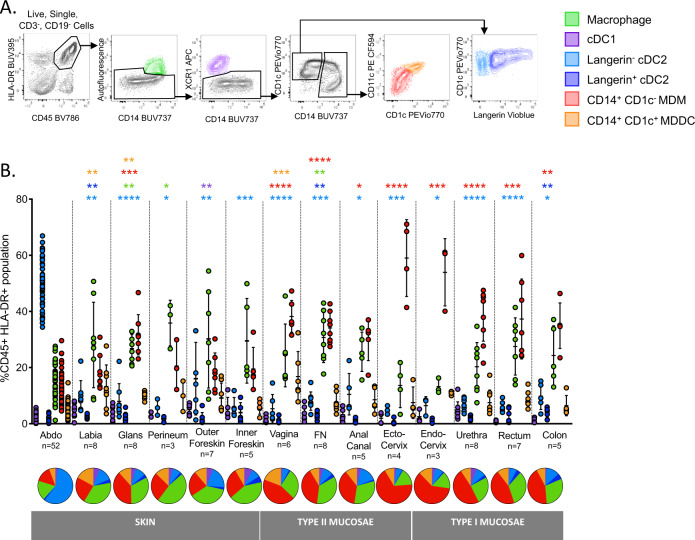
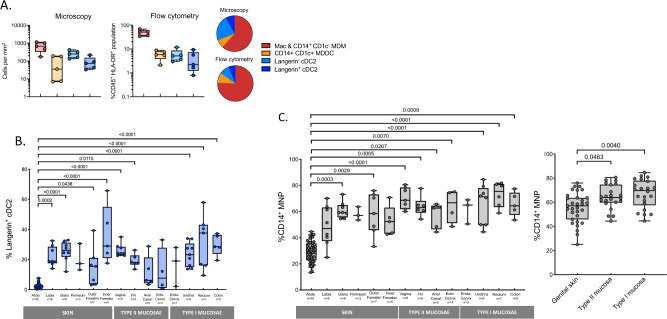
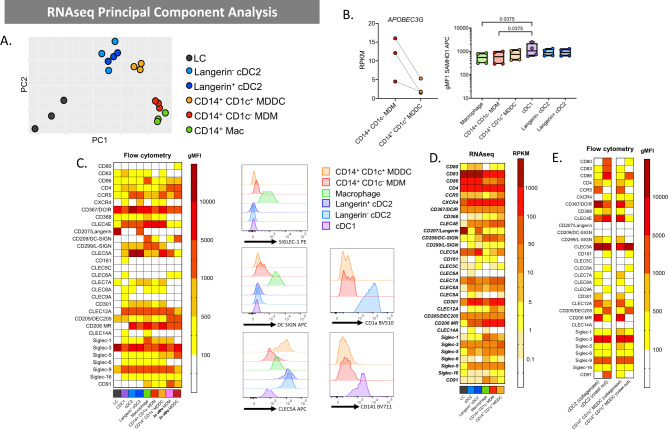
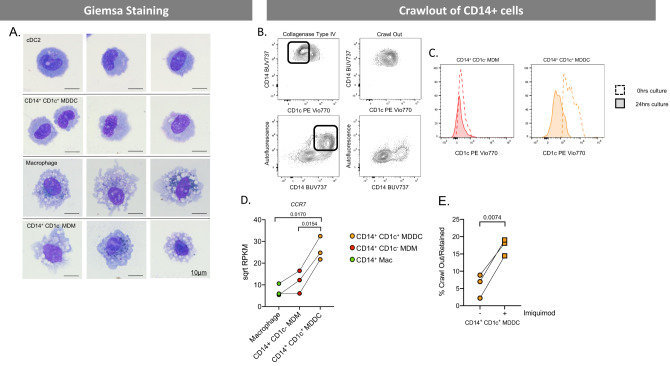
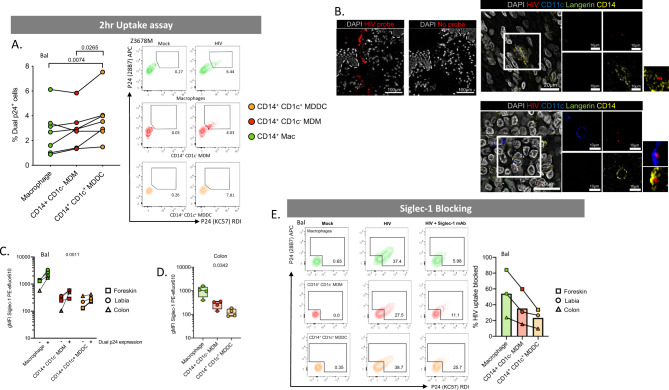
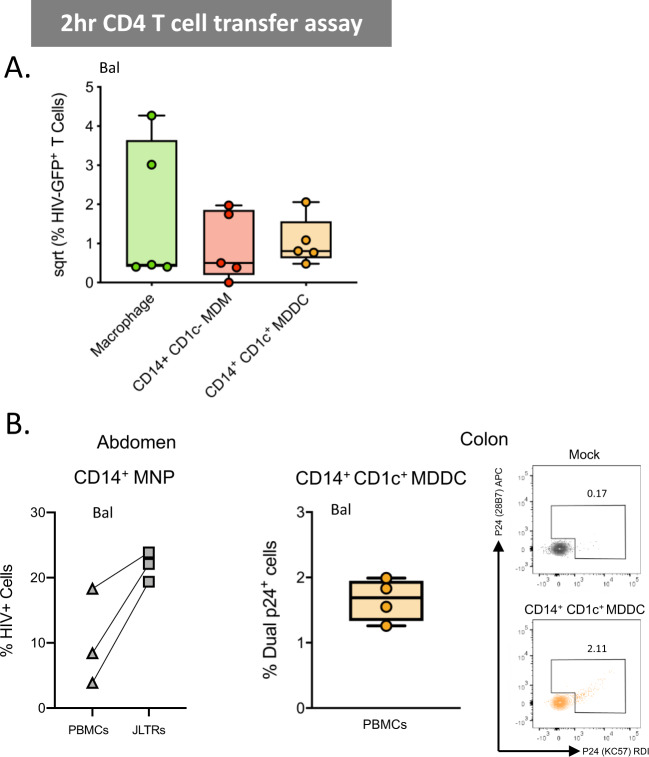
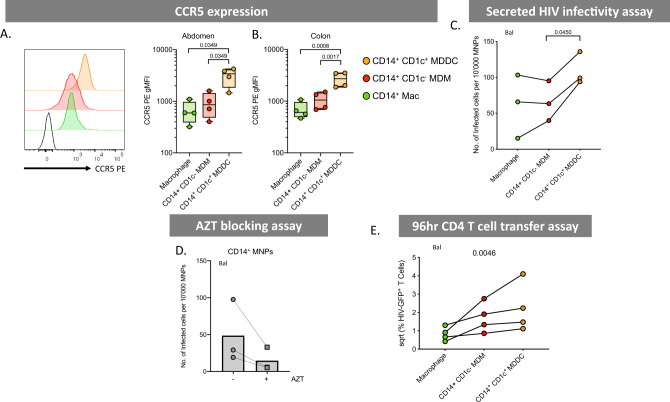
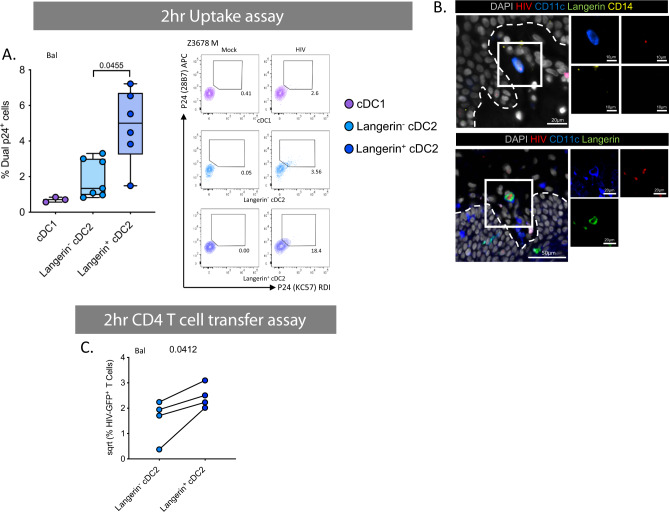
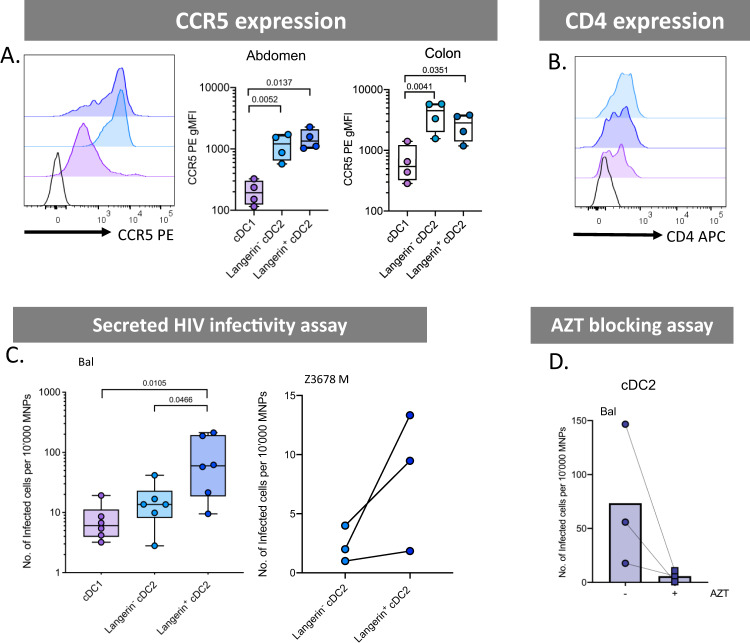
Tissue mononuclear phagocytes (MNP) are specialised in pathogen detection and antigen presentation. As such they deliver HIV to its primary target cells; CD4 T cells. Most MNP HIV transmission studies have focused on epithelial MNPs. However, as mucosal trauma and inflammation are now known to be strongly associated with HIV transmission, here we examine the role of sub-epithelial MNPs which are present in a diverse array of subsets. We show that HIV can penetrate the epithelial surface to interact with sub-epithelial resident MNPs in anogenital explants and define the full array of subsets that are present in the human anogenital and colorectal tissues that HIV may encounter during sexual transmission. In doing so we identify two subsets that preferentially take up HIV, become infected and transmit the virus to CD4 T cells; CD14+CD1c+ monocyte-derived dendritic cells and langerin-expressing conventional dendritic cells 2 (cDC2).


Conflict of interest statement

The authors declare no competing interests.

Figures

Fig. 1
Fig. 1. Definition of human dermal/lamina propria mononuclear phagocytes by flow cytometry.
A Following collagenase digestion six distinct CD3CD19CD45+HLA-DR+ mononuclear phagocyte subsets from human abdominal skin were defined, (i) tissue resident macrophages (green) were defined as autofluorescent+CD14+, (ii) type 1 conventional dendritic cells (cDC1; purple) were defined as autofluorescent, XCR1+, CD14, type 2 conventional dendritic cells (cDC2; blue) were defined as autofluorescent, XCR1, CD14, CD1c+, and could be split into two populations, (iii) a langerin population (light blue) and (iv) a langerin+ population (dark blue), (v) CD14+CD1c cells (red) were defined as autofluorescent, XCR1, CD14+, CD1c, (vi) CD14+CD1c+ cells (orange) were defined as autofluorescent, XCR1, CD14+, CD1c+. Representative plot of n = 52 abdominal donors is shown. B Relative proportions of each subset of mononuclear phagocyte as a percentage of CD45+ HLA-DR+ gate across the human anogenital/colorectal tracts were determined and mean ± standard deviation plotted. Statistics for subsets in each tissue were generated using the Kruskal–Wallis test: two-tailed Dunn’s multiple comparisons, comparing against abdominal skin tissue. *p < 0.05; **p < 0.01; ***p < 0.001; ****p < 0.0001. (abdominal tissue (Abdo) = 52, labia = 8, glans penis = 8, perineum = 3, outer foreskin = 7, inner foreskin = 5, vagina = 6, fossa navicularis (FN) = 8, anal canal = 5, ectocervix = 4, endocervix = 3, penile urethra = 8, rectum = 7, colon = 5). Underneath, a pie chart for each tissue shows the mean proportion of each dermal/lamina propria subset across the human anogenital/colorectal tracts.
Fig. 2
Fig. 2. Proportion of cDC2 and CD14-expressing mononuclear phagocytes in human sub-epithelial tissue.
A Using fluorescent microscopy the proportion of sub-epithelial MNP subsets were quantified in inner foreskin (n = 5) to a depth of 60 µm from the basement membrane and compared to the proportion quantified using flow cytometry (n = 5). Plotted as box and whisker plots, box representing the upper and lower quartile, central line representing the median, the whiskers the minimum and maximum of each cell subset and each donor represented by an individual dot. Pie charts show the mean proportion of MNP subsets using both quantification methods. Combined CD14+ CD1c monocyte-derived macrophages (MDM) and macrophages (Mac) (red), CD14+ CD1c+ monocyte-derived dendritic cells (MDDC) (orange), langerin- cDC2 (light blue) and langerin+ cDC2 (dark blue). B The proportion of langerin+ cDC2 across the human anogenital/colorectal tissue plotted as box and whisker plots, box representing the upper and lower quartile, central line representing the median, the whiskers the minimum and maximum of each tissue sample and each donor represented by an individual dot. Statistics were generated using the Kruskal–Wallis test: two-tailed Dunn’s multiple comparisons with adjusted P values shown. (abdominal tissue (Abdo) = 52, labia = 8, glans penis = 8, perineum =  3, outer foreskin = 7, inner foreskin = 5, vagina = 6, fossa navicularis (FN) = 8, anal canal = 5, ectocervix = 4, endocervix = 3, penile urethra = 8, rectum = 7, colon = 5). C The proportion of CD14+ mononuclear phagocytes (macrophages, CD14+CD1c cells, CD14+CD1c+ cells) across the human anogenital/colorectal tract. Left: looking at individual anogenital/colorectal tissue (abdominal tissue (Abdo) = 52, labia = 8, glans penis = 8, perineum = 3, outer foreskin = 7, inner foreskin = 5, vagina = 6, fossa navicularis (FN) = 8, anal canal = 5, ectocervix = 4, endocervix = 3, penile urethra = 8, rectum = 6, colon = 5), right: pooled data for genital skin (labia, glans penis, perineum, outer foreskin, inner foreskin; n = 31), type II mucosae (vagina, fossa navicularis, anal canal, ectocervix; n = 22) and type I mucosae (endocervix, penile urethra, rectum, colon n = 22) plotted as box and whisker plots, box representing the upper and lower quartile, central line representing the median, the whiskers the minimum and maximum of each tissue sample and each donor represented by an individual dot. Statistics as described above for B.
Fig. 3
Fig. 3. Genotypic and phenotypic profiling of epidermal and dermal human abdominal skin mononuclear phagocytes.
A Dermal macrophages, cDC2 (langerin and langerin+), CD14+CD1c+ cells and CD14+CD1c cells as well as epidermal Langerhans cells were liberated from n = 3 abdominal skin donors and FACS isolated for RNAsequencing (cDC1 were omitted from analysis due to low donor numbers). A PCA plot shows clustering of cell subsets. B Left: HIV restriction factor APOBEC3G gene expression by RNAseq for CD14+CD1c and CD14+CD1c+ cells (n = 3). Reads per kilobase of transcript, per million mapped reads (RPKM) is plotted with each dot representing an individual donor and lines matching donors. Rights: intracellular SAMHD1 expression on MNP subsets from abdominal skin assessed by flow cytometry, plotted as box and whisker plots, box representing the upper and lower quartile, central line representing the median, the whiskers the minimum and maximum of each tissue sample and each donor represented by an individual dot. Statistics generated using Friedman test with two-tailed Dunn’s multiple comparisons adjusted P values shown (n = 5). C Epidermal LCs and dermal MNPs were liberated from tissue using enzymatic digestions and surface receptor expression evaluated by flow cytometry and compared to in vitro monocyte-derived macrophages (MDM) and monocyte-derived dendritic cells (MDDC). Left: the geometric mean fluorescent intensity (gMFI) minus the isotype for each subset was calculated and mean plotted in a heat map (n = 2–11). Right: representative histograms of one donor for cell surface expression of three c-type lectin receptors of interest, Siglec-1, DC-SIGN, CLEC5a for all subsets and CD1a and CD141 expression on CD14+CD1c cells and CD14+CD1c+ compared to cDC2 and cDC1 respectively. D A heatmap was also generated from the RNAseq data to investigate the expression of the corresponding genes investigated by flow cytometry in C. E Flow cytometry analysis shows differences in cell surface expression on immature (enzymatically digested-derived cells) vs mature (spontaneous migration-derived cells) for left: cDC2 and right: CD14+CD1c+ cells. LC (black), cDC1(purple), langerin cDC2 (light blue), langerin+ cDC2 (dark blue), dermal macrophages (green), CD14+ CD1c MDM (red), CD14+ CD1c+ MDDC (orange), in vitro MDM (pink) and in vitro MDDC (crimson).
Fig. 4
Fig. 4. Morphological and migratory properties of CD14-expressing human tissue mononuclear phagocytes.
A Human dermal MNPs were isolated from abdominal skin by collagenase digestion, with each defined subset FACS isolated and Giemsa stained to investigate morphology. B The migratory capabilities of CD14-expressing cells (macrophages, CD14+CD1c cells, CD14+CD1c cells). From a single donor dermal sheets were cultured for 24 h and supernatant collected for cells which had undergone spontaneous migration (crawl out), tissue was then collagenase digested to liberate cells which did not undergo spontaneous migration. Contour plots show the phenotype of cells which crawled out compared to those which remained within the tissue, box highlighting cells which remained in tissue. C From a separate donor CD14+CD1c cells and CD14+CD1c+ cells were FACS isolated following collagenase digestion and cultured for 0 h (unfilled, dotted histogram) and 24 h (filled, continuous histogram) to determine the difference in CD1c expression on these cells before and after maturation. D Gene expression of chemokine receptor CCR7 determined by RNAseq for CD14-expressing MNPs from abdominal skin (n = 3). The square root of reads per kilobase of transcript, per million mapped reads (RPKM) is plotted, with each donor represented by an individual dot and lines connecting donors. Statistics were generated using RM one-way ANOVA with Holm–Sidak’s multiple comparisons with adjusted P values shown. E The percentage of CD14+CD1c+ cells which had undergone spontaneous migration compared to cells which remained within the tissue was calculated following overnight culture with or without the TLR7 agonist imiquimod. Statistics were calculated using a two-tailed paired T test (n = 3). Macrophages (green), CD14+ CD1c MDM (red) and CD14+ CD1c+ (orange).
Fig. 5
Fig. 5. HIV uptake of dermal CD14-expressing mononuclear phagocytes.
A MNPs were liberated from human abdominal skin using and CD45+HLA-DR+ live cells FACS isolated. Mixed dermal populations were incubated for 2 h with HIVBal or HIVZ3678M or mock treated, thoroughly washed and stained for surface markers and two antibody clones to HIV p24 (KC57 and 28B7) for flow cytometry analysis to determine percentage dual p24+ cells. Left: HIVBal results graphed with each donor represented by individual dots, donor matched by connected lines (n = 7). Statistics were generated using RM one-way ANOVA with Holm-Sidak’s multiple comparisons with adjusted P values shown. Right: representative contour plots for HIVZ3678M shown, gating on dual p24+ cells for each subset. B Human penile urethra explants were treated with HIV for 2 h before being fixed and paraffin embedded. After sectioning, HIV RNA was visualised using RNAscope and immunofluorescent staining for langerin, CD11c, CD14 and DAPI. Left: representative images of one donor, with and without the addition of the HIV specific RNAscope probe. Right: macrophages and CD14+CD1c cells could not be individually distinguished from each other but could be visualised as a group (top) while CD14+CD1c+ cells could also be visualised interacting with HIV (red) (bottom). Representative images from n = 3 donors. C Human MNPs from anogenital/colorectal tissue (2x foreskin: squares, 1x labia: circle, 1x colon: triangle), were treated as in A. The expression of Siglec-1 was assessed by geometric mean fluorescence intensity (gMFI) minus matching FMO control, on dual p24+ cells vs p24 cells. Each dot represents an individual donor with lines matching the same donor for each subset. Statistics measured the difference in p24+ cells versus p24 cells using a three-way ANOVA. D Siglec-1 expression on CD14-expressing subsets was determined in n = 4 colon donors. plotted as box and whisker plots, box representing the upper and lower quartile, central line representing the median, the whiskers the minimum and maximum of each cell subset and each donor represented by an individual dot. Statistics generated using RM one-way ANOVA. E Mixed dermal MNPs were treated as above however before incubation with HIV, cells were pre-treated with Siglec-1 mAb for 30 min. Left: representative plot of HIV uptake assessed by dual p24+ cells in Mock, HIV treated and HIV + Siglec-1 mAb samples from foreskin donor. Right: percentage of HIV uptake that was blocked using Siglec-1 mAb across three donors of anogenital/colorectal tissue (foreskin: square, labia: circle, colon: triangle), with each point representing individual donors matched with joining lines, and column representing mean. Macrophages (green), CD14+ CD1c MDM (red) and CD14+ CD1c+ (orange).
Fig. 6
Fig. 6. 1st phase HIV transfer from CD14-expressing mononuclear phagocytes to CD4+ T cells.
A Sorted CD14-expressing dermal cells were incubated with HIVBal for 2 h and then thoroughly washed off. JLTR cells were added to MNPs at a ratio of 4:1 and cultured for a further 96 h in human fibroblast conditioned media. Transfer of HIV to T cells was assessed using flow cytometry to plot the square root percent of GFP+ T cells, with each dot representing an individual donor (n = 5). B Left: CD14-expressing MNPs were sorted and 2-h transfer ability to JLTR cells compared to primary activated CD4 T cells derived from PBMCs was assessed (n = 3). Primary CD4 T cells were cultured at a ratio of 2T cells: 1 MNP. The number of infected T cells was assessed by flow cytometry using Live/dead NIR and intracellular P24 staining. Three individual MNP donors were plotted with squares representing transfer to primary CD4 T cells and triangles representing transfer to JLTR cells. Right: CD14+ CD1c+ MDDC from four human colonic tissue donors were sorted and 2-h transfer assays to CD4 T cells from PBMCs were setup as above, plotted as box and whisker plots, box representing the upper and lower quartile, central line representing the median, the whiskers the minimum and maximum and each donor represented by an individual dot (n = 4). Representative contour plots from one individual donor are shown. Macrophages (green), CD14+ CD1c MDM (red) and CD14+ CD1c+ (orange).
Fig. 7
Fig. 7. HIV infectability and transfer capacity of CD14-expressing dermal mononuclear phagocytes.
A CCR5 expression was determined on CD14-expressing MNPs liberated from collagenase type IV digested tissue. Left: histogram representing one abdominal skin donor with black, unfilled histogram representing FMO control. Right: geometric mean fluorescent intensity (gMFI) minus FMO control plotted from abdominal skin (n = 4), plotted as box and whisker plots, box representing the upper and lower quartile, central line representing the median, the whiskers the minimum and maximum of each cell subset and each donor represented by an individual dot. Statistics were generated using a RM one-way ANOVA with Holm–Sidak’s multiple comparisons with adjusted P values shown. B CCR5 expression was investigated in colon (n = 4) plotted as box and whisker plots, box representing the upper and lower quartile, central line representing the median, the whiskers the minimum and maximum of each cell subset and each donor represented by an individual dot. Statistics were generated as in A. C CD14-expressing MNP subsets were FACS isolated and incubated with HIVbal for 2 h before being thoroughly washed off. Cells were then cultured for an additional 96 h in human skin fibroblast conditioned media. Cell supernatants were taken and assessed for secreted HIV using a TZMBL infection assay, with the number of infected cells per 10,000 MNPs calculated and graphed. Individual dots represent three donors matched by connecting lines. Statistics were generated as in A. D Combined CD14-expressing MNPs were sorted and pre-treated for 1 h with 50 µM azidothymidine (AZT) before 2 h culture with HIVBal. Cells were washed three times and incubated for a further 48 h with AZT and then washed three more times. Cells were cultured for another 48 h before cell supernatants were collected and secreted HIV was assessed using a TZMBL infection assay. Each donor represented by individual point matched with joining lines, circles represent untreated cells and squares represent AZT treated cells, column representing the mean. E JLTRs were added to cell cultures from C after supernatants removed, at a ratio of 4:1 and cultured for a further 96 h. Transfer of HIV to T cells was determined using flow cytometry to assess the percent of GFP+ JLTRs. Raw data was square root normalised and plotted, with each dot representing four individual donors with connecting lines matching donors. Statistics were generated using a Friedman test. Macrophages (green), CD14+ CD1c MDM (red) and CD14+ CD1c+ (orange).
Fig. 8
Fig. 8. HIV uptake and 1st phase transfer capacity of dermal dendritic cells.
A Enzymatically liberated cells from abdominal skin were FACS isolated to obtain a CD45+HLA-DR+ population and cultured with HIVBal or HIVZ3678M or Mock treated for 2 h before being washed off three times in PBS. Cells were stained for surface markers and two p24 clones, before analysis by flow cytometry. Left: HIVBal treated cells percentage of dual p24+ cells plotted as box and whisker plots, box representing the upper and lower quartile, central line representing the median, the whiskers the minimum and maximum of each cell subset and each donor represented by an individual dot (n = 7, n = 3 for cDC1 due to low cell numbers). Statistics were generated using a mixed effects analysis with two-tailed Tukey’s multiple comparisons with adjusted P values shown. Right: representative contour plots for HIVZ3678M gating on dual p24+ cells. B Human inner foreskin explants were treated with HIV for 2–3 h, before being fixed, paraffin embedded and sectioned. HIV was visualised using RNAscope alongside immunofluoerescence for CD11c, CD14 and langerin as well as DAPI to identify Langerin cDC2 (top) and langerin+ cDC2 (bottom). Representative image from n = 3 donors. C FACS isolated cDC2 divided by langerin expression were cultured with HIVBal for 2 h before being washed off three times. JLTR cells (CD4 T cells with GFP under the HIV promoter) were then co-cultured for 96 h in fibroblast conditioned media. Flow cytometry was used to analyse the percent of GFP+ T cells. Data was square root normalised and graphed with each donor represented by an individual dot and lines connecting matched donors (n = 4). Statistics were generated using a two-tailed paired T test. cDC1 (purple), langerin cDC2 (light blue) and langerin+ cDC2 (dark blue).
Fig. 9
Fig. 9. HIV infectivity and 2nd phase transfer capacity of dermal dendritic cells.
A HIV co-receptor CCR5 expression was analysed by flow cytometry. Left: representative histogram of one donor, black unfilled histogram represents FMO control. CCR5 gMFI minus the FMO for abdominal skin (middle n = 4) and colon (right n = 4) plotted as box and whisker plots, box representing the upper and lower quartile, central line representing the median, the whiskers the minimum and maximum of each cell subset and each donor represented by an individual dot. Statistics were generated using a RM one-way ANOVA with Holm–Sidak’s multiple comparisons with adjusted P values shown. B HIV receptor CD4 expression levels on one abdominal skin donor with isotype control represented by black, unfilled histogram. C Cell supernatants from FACS isolated dermal DCs infected with HIV were taken for TZMBL infectivity assays and the number of infected TZMBL cells per 104 MNPs were calculated. Left: HIVBal infectivity plotted as box and whisker plots as in A, n = 7. Statistics were generated using a RM one-way ANOVA with Holms–Sidak’s multiple comparisons with adjusted P values shown. Right: HIVZ3678M infectivity assay with each dot representing individual donors matched by connecting lines (n = 3). Due to low cell numbers cDC1 data could not be obtained. D Combined sorted cDC2 were pre-treated with or without azidothymidine (AZT) before 2-h HIVBal infection. AZT was washed off after 48 h and cell supernatants collected after a further 48 h. Secreted HIV was assessed using a TZMBL infection assay. Each donor represented by individual point matched with joining lines, circles represent untreated cells and squares represent AZT treated cells, column representing the mean. cDC1 (purple), langerin cDC2 (light blue) and langerin+ cDC2 (dark blue).

References

    1. de Visser RO, et al. Change and stasis in sexual health and relationships: comparisons between the First and Second Australian Studies of Health and Relationships. Sex. Health. 2014;11:505–509. doi: 10.1071/SH14112. - DOI - PubMed
    1. Kojima N, Davey DJ, Klausner JD. Pre-exposure prophylaxis for HIV infection and new sexually transmitted infections among men who have sex with men. AIDS. 2016;30:2251–2252. doi: 10.1097/QAD.0000000000001185. - DOI - PubMed
    1. Esra RT, et al. Does HIV exploit the inflammatory milieu of the male genital tract for successful infection? Front. Immunol. 2016;7:245. doi: 10.3389/fimmu.2016.00245. - DOI - PMC - PubMed
    1. Passmore JA, Jaspan HB, Masson L. Genital inflammation, immune activation and risk of sexual HIV acquisition. Curr. Opin. HIV AIDS. 2016;11:156–162. doi: 10.1097/COH.0000000000000232. - DOI - PMC - PubMed
    1. Patel P, et al. Estimating per-act HIV transmission risk: a systematic review. AIDS. 2014;28:1509–1519. doi: 10.1097/QAD.0000000000000298. - DOI - PMC - PubMed

Publication types

MeSH terms