

Increased respiratory morbidity associated with exposure to a mature volcanic plume from a large Icelandic fissure eruption
- PMID: 33846312
- PMCID: PMC8042009
- DOI: 10.1038/s41467-021-22432-5
Increased respiratory morbidity associated with exposure to a mature volcanic plume from a large Icelandic fissure eruption
Abstract
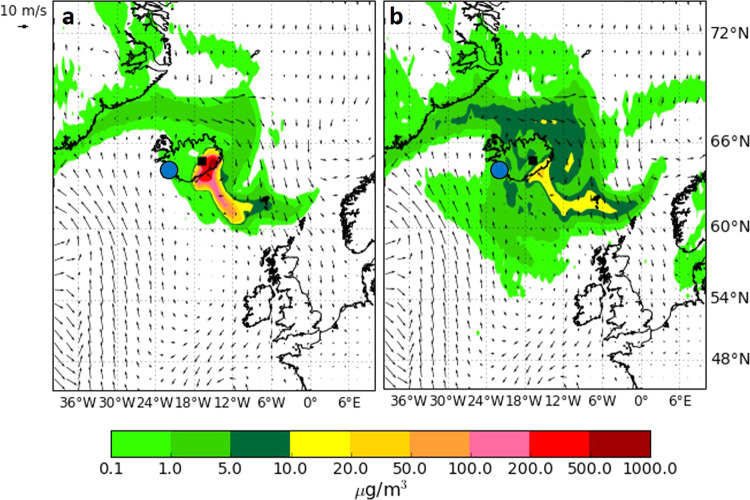
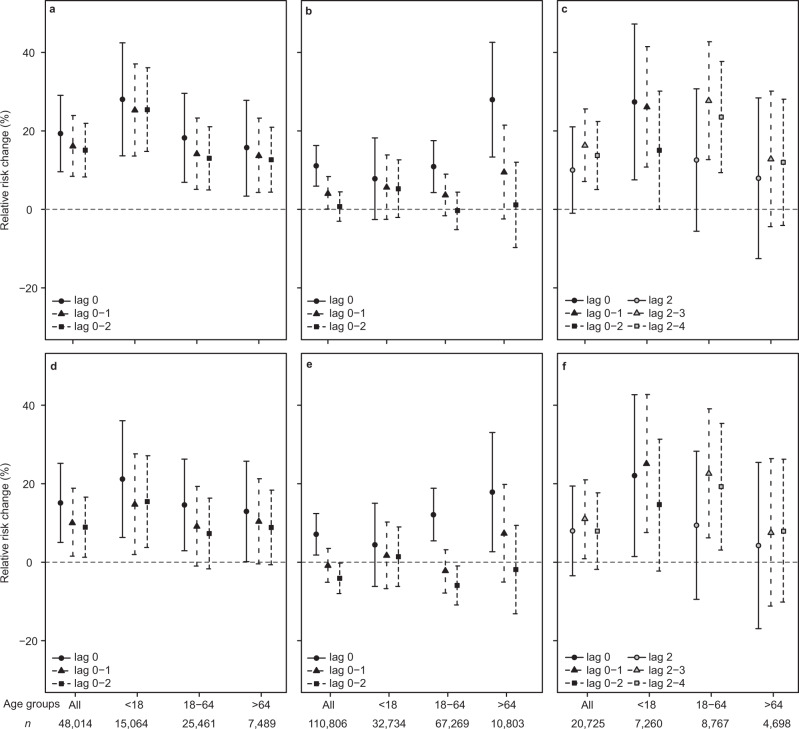
The 2014-15 Holuhraun eruption in Iceland was the largest fissure eruption in over 200 years, emitting prodigious amounts of gas and particulate matter into the troposphere. Reykjavík, the capital area of Iceland (250 km from eruption site) was exposed to air pollution events from advection of (i) a relatively young and chemically primitive volcanic plume with a high sulphur dioxide gas (SO2) to sulphate PM (SO42-) ratio, and (ii) an older and chemically mature volcanic plume with a low SO2/SO42- ratio. Whereas the advection and air pollution caused by the primitive plume were successfully forecast and forewarned in public advisories, the mature plume was not. Here, we show that exposure to the mature plume is associated with an increase in register-measured health care utilisation for respiratory disease by 23% (95% CI 19.7-27.4%) and for asthma medication dispensing by 19.3% (95% CI 9.6-29.1%). Absence of public advisories is associated with increases in visits to primary care medical doctors and to the hospital emergency department. We recommend that operational response to volcanic air pollution considers both primitive and mature types of plumes.
Conflict of interest statement
The authors declare no competing interests.
Figures


Similar articles
-
Severe volcanic SO2 exposure and respiratory morbidity in the Icelandic population - a register study.Environ Health. 2021 Feb 27;20(1):23. doi: 10.1186/s12940-021-00698-y. Environ Health. 2021. PMID: 33639965 Free PMC article.
-
Potential health impacts from sulphur dioxide and sulphate exposure in the UK resulting from an Icelandic effusive volcanic eruption.Sci Total Environ. 2021 Jun 20;774:145549. doi: 10.1016/j.scitotenv.2021.145549. Epub 2021 Feb 3. Sci Total Environ. 2021. PMID: 33611010
-
Respiratory health and eruptions of the Nyiragongo and Nyamulagira volcanoes in the Democratic Republic of Congo: a time-series analysis.Environ Health. 2020 Jun 5;19(1):62. doi: 10.1186/s12940-020-00615-9. Environ Health. 2020. PMID: 32503565 Free PMC article.
-
Respiratory health effects of volcanic ash with special reference to Iceland. A review.Clin Respir J. 2011 Jan;5(1):2-9. doi: 10.1111/j.1752-699X.2010.00231.x. Epub 2010 Nov 29. Clin Respir J. 2011. PMID: 21159135 Review.
-
[Effects of volcanic eruptions on human health in Iceland. Review].Laeknabladid. 2016 Oktober;102(10):433-441. doi: 10.17992/lbl.2016.10.101. Laeknabladid. 2016. PMID: 27813483 Review. Icelandic.
Cited by
-
Ambient nitrogen dioxide is associated with emergency hospital visits for atrial fibrillation: a population-based case-crossover study in Reykjavik, Iceland.Environ Health. 2022 Jan 3;21(1):2. doi: 10.1186/s12940-021-00817-9. Environ Health. 2022. PMID: 34980118 Free PMC article.
-
Clear and Present Dangers: The Multiple Health Hazards of Volcanic Eruptions.Environ Health Perspect. 2022 Feb;130(2):22001. doi: 10.1289/EHP10541. Epub 2022 Feb 11. Environ Health Perspect. 2022. PMID: 35148198 Free PMC article.
-
Ambient air pollution and emergency department visits and hospitalisation for cardiac arrest: a population-based case-crossover study in Reykjavik, Iceland.BMJ Open. 2023 May 15;13(5):e066743. doi: 10.1136/bmjopen-2022-066743. BMJ Open. 2023. PMID: 37188467 Free PMC article.
-
A Systematic Review of Codelists to Identify Chronic Bronchitis and Emphysema in Routine Electronic Healthcare Record Data and Derivation of a Standardized Codelist for Future Research.Int J Chron Obstruct Pulmon Dis. 2025 May 23;20:1679-1691. doi: 10.2147/COPD.S501421. eCollection 2025. Int J Chron Obstruct Pulmon Dis. 2025. PMID: 40433395 Free PMC article.
-
Health impact of the Tajogaite volcano eruption in La Palma population (ISVOLCAN study): rationale, design, and preliminary results from the first 1002 participants.Environ Health. 2024 Feb 13;23(1):19. doi: 10.1186/s12940-024-01056-4. Environ Health. 2024. PMID: 38350940 Free PMC article.
References
-
- Brown SK, Jenkins SF, Sparks RSJ, Odbert H, Auker MR. Volcanic fatalities database: analysis of volcanic threat with distance and victim classification. J. Appl. Volcanol. 2017;6:15. doi: 10.1186/s13617-017-0067-4. - DOI
-
- World Health Organisation. WHO Air Quality Guidelines for Particulate Matter, Ozone, Nitrogen Dioxide and Sulfur Dioxide. Global Update 2005. Summary of Risk Assessment. (2005).
-
- Möller D. Kinetic model of atmospheric SO2 oxidation based on published data. Atmos. Environ. 1967. 1980;14:1067–1076.
-
- Lim SS, et al. A comparative risk assessment of burden of disease and injury attributable to 67 risk factors and risk factor clusters in 21 regions, 1990–2010: a systematic analysis for the Global Burden of Disease Study 2010. Lancet. 2012;380:2224–2260. doi: 10.1016/S0140-6736(12)61766-8. - DOI - PMC - PubMed
Publication types
MeSH terms
Substances
LinkOut - more resources
Full Text Sources
Other Literature Sources
Medical
