. 2021 Apr 12;12(1):2184.
doi: 10.1038/s41467-021-22225-w.

The white matter is a pro-differentiative niche for glioblastoma

Affiliations

The white matter is a pro-differentiative niche for glioblastoma

Lucy J Brooks et al. Nat Commun. .

Erratum in

  • Author Correction: The white matter is a pro-differentiative niche for glioblastoma.
    Brooks LJ, Clements MP, Burden JJ, Kocher D, Richards L, Devesa SC, Zakka L, Woodberry M, Ellis M, Jaunmuktane Z, Brandner S, Morrison G, Pollard SM, Dirks PB, Marguerat S, Parrinello S. Brooks LJ, et al. Nat Commun. 2022 Apr 14;13(1):2163. doi: 10.1038/s41467-022-29916-y. Nat Commun. 2022. PMID: 35422055 Free PMC article. No abstract available.

Abstract

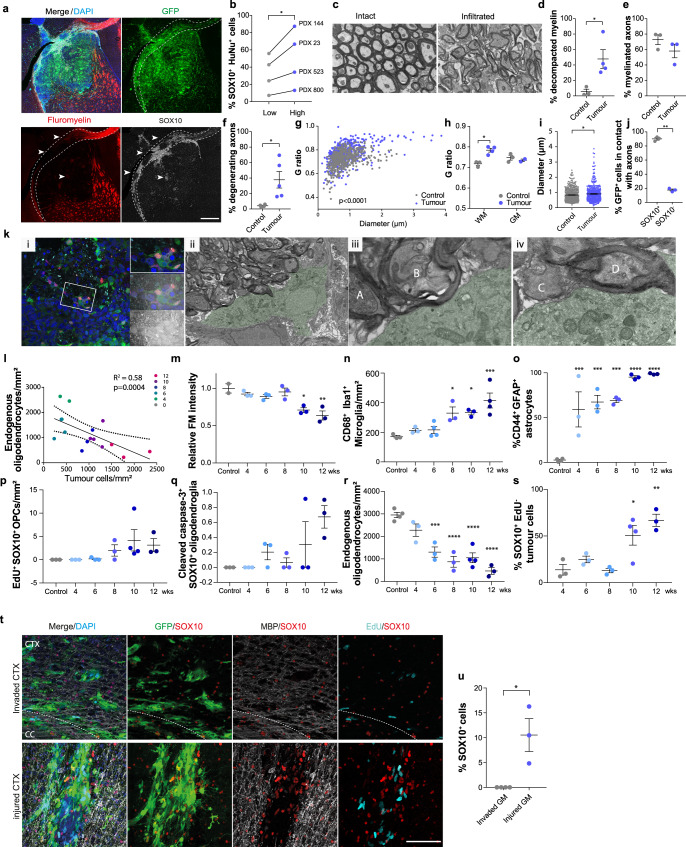
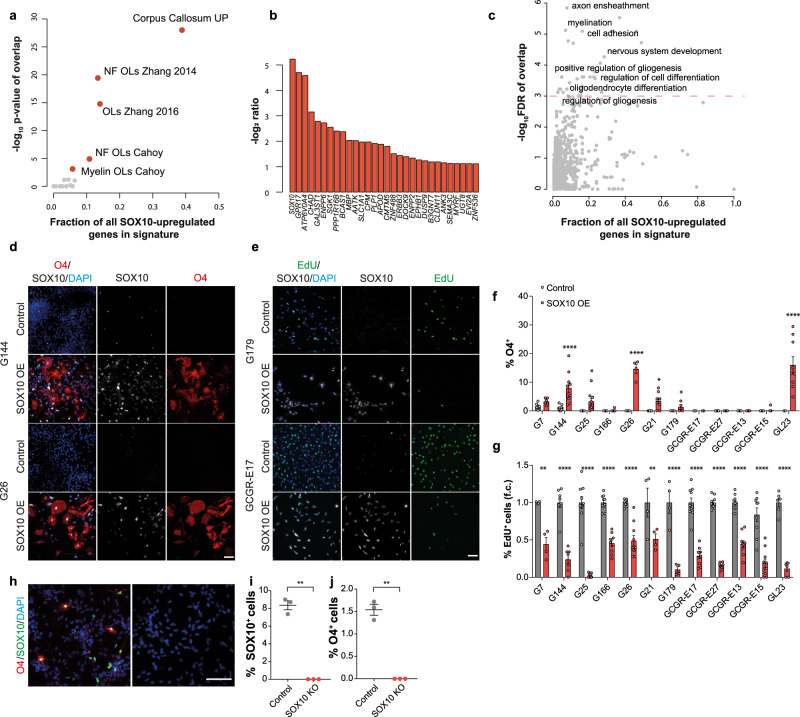
Glioblastomas are hierarchically organised tumours driven by glioma stem cells that retain partial differentiation potential. Glioma stem cells are maintained in specialised microenvironments, but whether, or how, they undergo lineage progression outside of these niches remains unclear. Here we identify the white matter as a differentiative niche for glioblastomas with oligodendrocyte lineage competency. Tumour cells in contact with white matter acquire pre-oligodendrocyte fate, resulting in decreased proliferation and invasion. Differentiation is a response to white matter injury, which is caused by tumour infiltration itself in a tumoursuppressive feedback loop. Mechanistically, tumour cell differentiation is driven by selective white matter upregulation of SOX10, a master regulator of normal oligodendrogenesis. SOX10 overexpression or treatment with myelination-promoting agents that upregulate endogenous SOX10, mimic this response, leading to niche-independent pre-oligodendrocyte differentiation and tumour suppression in vivo. Thus, glioblastoma recapitulates an injury response and exploiting this latent programme may offer treatment opportunities for a subset of patients.


Conflict of interest statement

The authors declare no competing interests.

Figures

Fig. 1
Fig. 1. GBM cells invading into white matter acquire pre-oligodendrocyte fate.
a representative fluorescence image of a G144 xenograft (PDX144) collected for region-specific RNA-seq. Brain regions microdissected for FACS purification of GFP+ cells are shown, nuclei are counterstained with DAPI (blue). Scale = 1 mm. b PCA plot of rlog-normalised DESeq2 expression scores for the resulting RNA-seq libraries. n = 3 xenografts. c left panel: K-means clustering of DESeq2 expression ratios (absolute log2 expression ratio > 0.58, padjust < 0.05) for tumour cells invading into the corpus callosum (CC) or striatum (ST) relative to the tumour bulk. One sided Fisher exact test with Bonferroni multiple comparisons test. B Right panel: overlap of K-means cluster with gene signatures for oligodendrocyte progenitor cell (OPC), Oligodendrocytic, Astrocytic and Neuronal lineages as well as proliferation signatures. Colours represent -log10 of enrichment adjusted p-values. d top: DESeq2 log2 expression ratios of markers of the oligodendrocyte lineage organised by differentiation stage in tumour cells from CC and ST relative to B. bottom: schematic illustration of the maturation of oligodendrocyte lineage cells. e representative immunofluorescence staining for SOX10 (red) and the myelin marker oligodendrocyte-specific protein (OSP, grey) of GFP-labelled PDX144 tumours (green). Scale = 1 mm. f quantification of percentage of SOX10+ tumour cells in grey (GM) and white matter (WM). ≥750 cells per xenograft were counted. Mean ± SEM, n = 3 xenografts p = 0.000047. Unpaired two-tailed Student’s t test. g representative EdU (turquoise) and SOX10 (red) staining and h quantification of actively proliferating SOX10+ and SOX10 GFP+ tumour cells in the corpus callosum. Scale = 500 µm. ≥1000 cells per xenograft were counted. Mean ± SEM, n = 3 xenografts. p = 0.01, unpaired two-tailed Student’s t test. i representative SOX10+ (red)/EdU (Turquoise) immunofluorescence staining and j quantification of GFP+ tumour cells implanted in the white matter of the corpus callosum (top) or the grey matter of the upper cortex (bottom). ≥140 cells per xenograft were counted. Scale = 100 µm, Mean ± SEM, n = 3 xenografts p = 0.008. Unpaired two-tailed Student’s t test.
Fig. 2
Fig. 2. Differentiation in white matter is a general GBM response.
a representative immunofluorescence image of a SOX10+ patient-derived xenograft (PDX 23) stained for SOX10 (red), oligodendrocyte-specific protein (OSP, grey) and human-specific nuclear antigen (HuNu, green) to label all tumour cells. Scale = 500 µm. b quantification of percentage of SOX10+/HuNu+ tumour cells in white and grey matter of indicated patient-derived xenografts. n = 4 independent xenograft models. For each xenograft, ≥550 cells were quantified across 2 independent ROIs selected within white or grey matter. p = 0.05, Mean, paired one-tailed Student’s t test. c quantification of percentage of proliferating SOX10+ and SOX10 tumour cells in the corpus callosum of indicated xenografts. For each xenograft, ≥500 SOX10+ or SOX10 cells were quantified across 2 independent ROIs, n = 4 independent xenograft models. p = 0.05, Mean, paired one-tailed Student’s t-test. d MBP (grey) and SOX10 (red) immunofluorescence staining of white matter regions of patient tumours. SOX2 (green) was used to identify tumour cells and distinguish them from resident glia. Cases shown are the original tumours from which lines GL23, GL67 and GCGR L12 used in this study have been isolated. Inset shows a close-up of the same image. Scale = 50 µm. e quantification of percentage of SOX2+/SOX10+ and SOX2+/SOX10 tumour cells undergoing proliferation (Ki67+) in patient tumours. For each case, ≥300 cells were quantified across 2 independent ROIs, n = 7 cases. P = 0.002, Mean, paired one-tailed Student’s t-test. f pie chart representation of SOX10 expression in 23 patient tumours. – denotes absence, and + to +++ increasing frequency of SOX10+ cells within the tumour.
Fig. 3
Fig. 3. Exposure to disrupted myelin drives GBM progression down the oligodendrocyte lineage.
a SOX10 (grey), fluoromyelin (FM, red), DAPI (blue) immunofluorescence of GFP+ G144 xenografts (PDX144). Arrowheads denote disrupted areas. Scale = 500 µm b, % SOX10+ tumour cells in areas of high (blue)/low (grey) disruption in indicated xenografts. ≥120 cells across ≥6 ROIs per region. n = 4 xenografts. p = 0.03, Mean, paired one-tailed Student’s t test c, Electron micrographs of myelin bundles in the ipsilateral (infiltrated) and contralateral (intact) striatum of PDX144. Scale=1 µm. di, quantification of indicated axonal and myelin phenotypes in EM data from b. n = 3-4 xenografts. d p = 0.03, f, p = 0.03, g p < 0.0001, h p = 0.01, i p = 0.01, **p < 0.01, *p < 0.05, Mean ± SEM, paired one-tailed Student’s t test, 2-way ANOVA or linear regression. j % GFP+ tumour cells in contact with axons. ≥300 SOX10+/SOX10 cells across 3 ROIs. Mean ± SEM, n = 3 tumours, p < 0.0001. Unpaired two-tailed Student’s t test. k i Correlative light and electron micrograph (CLEM) of tumour cell directly interacting with multiple white matter axons. ii-iv magnifications of i highlighting interactions with decompacted myelin (A, B), naked (C), and intact myelinated axon (D) Scale = 10 µm (i), 5 µm (ii), 1 µm (iii, iv). ls time-course analysis of tumour cell differentiation and glial response during corpus callosum (CC) infiltration in PDX144. l quantification of FM intensity relative to tumour density. Dots indicate individual xenografts colour-coded by time-point. n = 3 tumours/time point, n = 2 control brains. R2 = coefficient of determination. ms quantification of indicated cell types over time. Minimum ROI = 300 µm. Mean ± SEM, n = 3 xenografts. m 10wk p = 0.005, 12wk p = 0.0009, n 8wk p = 0.02, 10wk p = 0.02, 12wk p = 0.0005, o 4wk p = 0.0009, 6wk p = 0.0003, 8wk p = 0.0002, 10wk p < 0.0001 12wk p < 0.0001, r 6wk p = 0.0003, 8wk p < 0.0001, 10wk p < 0.0001, 12wk p < 0.0001, s 10wk p = 0.01, 12wk p = 0.0014, one-way ANOVA with Dunnett’s multiple comparison tests. t SOX10 (red), MBP (grey), EdU (turquoise), DAPI (blue) immunofluorescence of GFP+ G144 cells directly injected (injured CTX) or invaded into the inner cortex from the tumour bulk (invaded CTX). Dotted lines delineate the corpus callosum (CC). Scale = 100 µm. u % SOX10+/EdU- differentiated tumour cells shown in t ≥340 cells per xenograft. Mean ± SEM, n = 3 xenografts per group. p = 0.01. Unpaired two-tailed Student’s t test.
Fig. 4
Fig. 4. Differentiation depends on continuous exposure to white matter.
a schematic representation of experimental workflow. b Kaplan Meier survival plot of nude mice injected with G144 cells acutely isolated from the bulk, corpus callosum (CC) and striatum of primary xenografts. n = 6 mice/group. c Representative images of secondary GFP+ tumours stained for neurofilament (grey) to identify axonal bundles, SOX10 (red) and DAPI (blue). Tumour areas from the indicated brain regions are shown revealing a differentiation pattern identical to primary lesions. Scale = 50 µm.
Fig. 5
Fig. 5. SOX10 overexpression induces pre-oligodendrocyte differentiation.
a Enrichment of genes upregulated by SOX10 in vitro for signatures of glial and neuronal lineages (Supplementary data 4 and 5) and genes up-regulated in G144 xenografts upon invasion into the Corpus callosum (Corpus callosum UP). -log10 transformed p-values of one-sided Fisher tests plotted as a function of the percentage of all SOX10 regulated genes in each list. b most up-regulated genes upon SOX10 induction in vitro (top 20). DEseq2 log2 ratio of Doxycyclin- versus vehicle-treated cells are plotted. c GO enrichment analysis of the genes positively regulated by SOX10 in vitro (Supplementary data 4). GO terms belonging to the Biological process ontology are shown and selected terms are highlighted. -log10 transformed FDR q-values of overlaps are plotted as a function of the percentage of all SOX10 regulated genes present in each list. d O4 (red), SOX10 (grey) and DAPI (blue) staining of indicated GSC lines transduced with empty (Control) or constitutive SOX10-encoding lentiviral vectors. Scale = 100 µm. e representative images of indicated lines transduced with control or SOX10 lentivirus (SOX10 OE) and stained for EdU (green), SOX10 (grey) and DAPI (blue). Scale = 100 µm. f quantifications of % O4+ pre-oligodendrocyte cells in cultures shown in d. ≥200 cells across duplicate coverslips per biological repeat. Mean ± SEM, n = 3 independent transductions. G144 p < 0.0001, G25 p = 0.02, G26 p < 0.0001, G21 p = 0.04, GL23 p < 0.0001. Two-way ANOVA with Sidak’s multiple comparisons test. g quantifications of percentage of proliferating (EdU+) cells in the same cultures as in e. ≥200 cells across duplicate coverslips counted per biological repeat. Mean ± SEM, n = 3 independent transductions, G7 p < 0.0001, G144 p < 0.0001, G25 p < 0.0001, G166 p < 0.0001, G26 p < 0.0001, G21 p = 0.0004, G179 p < 0.0001, GCGR-E17 p < 0.0001, GCGR-E27 p < 0.0001, GCGR-E13 p < 0.0001, GCGR-E15 p < 0.0001, GL23 p < 0.0001. Two-way ANOVA with Sidak’s multiple comparisons test. h representative immunofluorescence images of Control and SOX10 knock-out (SOX10 KO) G144 cultures differentiated for 14 days by growth factor withdrawal and stained for SOX10 (green) and O4 (red). Scale = 100 µm. i, j quantifications of the cultures in h. ≥250 cells across duplicate coverslips per biological repeat. Mean±SEM, n  =  3 independent cultures, i p < 0.0001, j p = 0.0002. unpaired two-tailed Student’s t test.
Fig. 6
Fig. 6. SOX10 overexpression delays tumourigenesis.
a quantification of luciferase bioluminescence radiance measured at the indicated time points in Control G144 and SOX10 overexpressing (SOX10 OE) xenografts. n = 12 for Control and 13 for SOX10 OE, error bars denote SEM. Unpaired two-tailed Student’s t test. b Kaplan Meier survival plot of mice injected with GFP+ G144 Control and SOX10 OE cells. n = 8 for Control and 10 for SOX10 OE, p < 0.0001. c SOX10 (red), EdU (grey) and DAPI (blue) immunofluorescence staining of GFP+ Control and SOX10 OE tumours at 4 weeks post-injection. Arrowheads denote EdU+ cells that are negative for SOX10. Scale = 100 µm. d % EdU+/GFP+ tumour cells in Control and SOX10 OE tumours from c. ≥200 cells were quantified across 2 ROIs/mouse. Mean ± SEM are plotted. n = 3 mice/group p = 0.0006. Unpaired two-tailed Student’s t test e, representative images of GFP+ G144 Control and SOX10 OE tumours stained for SOX10 (red) and DAPI (blue) at 4 weeks post-injection. Scale = 1 mm. f quantification of migrated distance from tumour bulk edge of tumour cells expressing low, medium or high SOX10 levels in SOX10 OE tumours at 4 weeks post-injection. ≥200 cells were quantified per mouse. Each dot represents a cell. Mean ± SEM are indicated. n = 3 mice/group. One-way ANOVA. g migrated distance of O4+ and O4 tumour cells acutely isolated from the corpus callosum region of G144 xenografts (PDX144) and cultured for 72 h in neural stem cell conditions. Each dot represents a cell, n = 90 cells/group pooled from 3 independent experiments. Median±SEM are shown. n = 3 tumours *p < 0.05. Unpaired two-tailed Student’s t test. h quantification of luciferase bioluminescence radiance of Control and SOX10 knock-out (SOX10 KO) PDX144 measured at the indicated time points. n = 5 Control and n = 7 SOX10 KO tumours. Mean ± SEM are indicated. Unpaired two-tailed Student’s t test. I % EdU+ cells in Control and SOX10 KO PDX144 at 4 weeks post-implantation.
Fig. 7
Fig. 7. Myelination-promoting compounds suppress tumour growth.
a representative images of untreated and dibutyril cAMP-treated (dbcAMP) G144 cultures stained for SOX10 (green), EdU (grey), O4 (red) and DAPI (blue). Scale = 100 µm. b O4 (red), SOX10 (green) and DAPI (blue) staining of G144 cultures treated with vehicle (Control) or Pranlukast. Scale = 50 µm. ce quantification of cultures in a, showing percentages of indicated populations before and after treatment. Fold change relative to control cultures (f.c.) is shown in c and d. ≥1000 cells across duplicate coverslips were counted per biological repeat. Mean ± SEM, n = 3 independent cultures, a p < 0.0001, b p = 0.01, c p = 0.02. Unpaired two-tailed Student’s t test. fh quantification of cultures in b, showing percentages of indicated populations before and after treatment. Fold change relative to control cultures (f.c.) is shown in g. ≥800 cells across duplicate coverslips were counted per biological repeat. Mean ± SEM, n = 3 independent cultures. c p = 0.002, d p = 0.05, e 0.0006. Unpaired two-tailed Student’s t-test. i, j representative immunofluoresce images of DMSO- (Control) and Pranlukast-treated GFP+ G144 xenografts (PDX144) stained for SOX10 (red) and EdU (red). Scale = 500 µm. k, quantifications of number of SOX10+ and l, EdU+ tumour cells in the xenografts shown in i and j. Scale = 500 µm. Mean ± SEM, n = 3 xenografts. t p = 0.02, u p = 0.002. Unpaired two-tailed Student’s t test. n = 3 xenografts per group. Unpaired two-tailed Student’s t test.

References

    1. Stupp R, et al. Radiotherapy plus concomitant and adjuvant temozolomide for glioblastoma. N. Engl. J. Med. 2005;352:987–996. - PubMed
    1. Weathers SP, Gilbert MR. Advances in treating glioblastoma. F1000Prime Rep. 2014;6:46. - PMC - PubMed
    1. Singh SK, et al. Identification of human brain tumour initiating cells. Nature. 2004;432:396–401. - PubMed
    1. Chen J, et al. A restricted cell population propagates glioblastoma growth after chemotherapy. Nature. 2012;488:522–526. - PMC - PubMed
    1. Lathia JD, Mack SC, Mulkearns-Hubert EE, Valentim CL, Rich JN. Cancer stem cells in glioblastoma. Genes Dev. 2015;29:1203–1217. - PMC - PubMed

Publication types

MeSH terms

Substances