. 2021 Apr 12;12(1):2163.
doi: 10.1038/s41467-021-22433-4.

Epigenetic modulation of immune synaptic-cytoskeletal networks potentiates γδ T cell-mediated cytotoxicity in lung cancer

Affiliations

Epigenetic modulation of immune synaptic-cytoskeletal networks potentiates γδ T cell-mediated cytotoxicity in lung cancer

Rueyhung R Weng et al. Nat Commun. .

Abstract

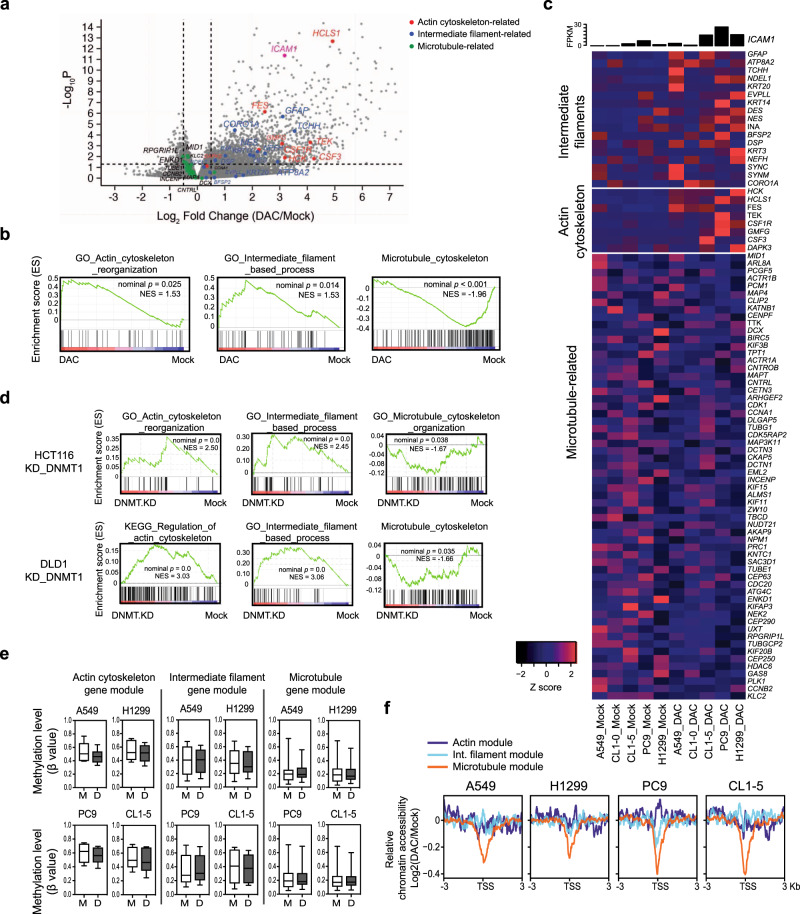
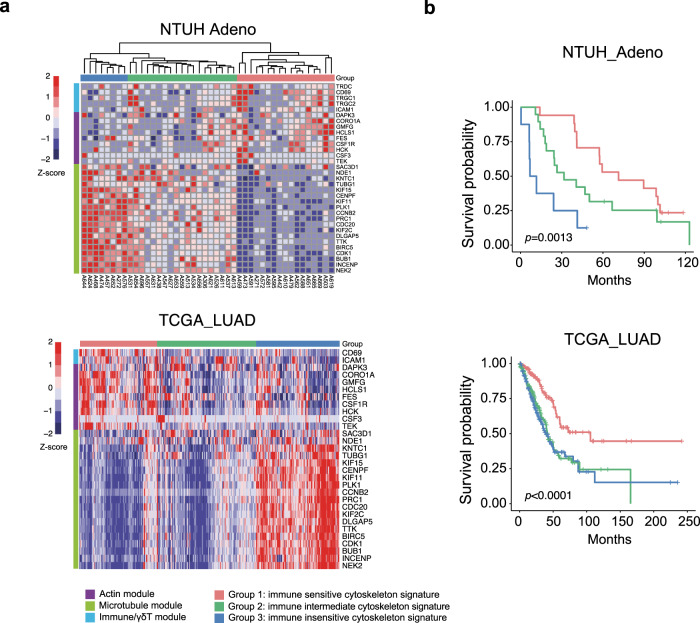
γδ T cells are a distinct subgroup of T cells that bridge the innate and adaptive immune system and can attack cancer cells in an MHC-unrestricted manner. Trials of adoptive γδ T cell transfer in solid tumors have had limited success. Here, we show that DNA methyltransferase inhibitors (DNMTis) upregulate surface molecules on cancer cells related to γδ T cell activation using quantitative surface proteomics. DNMTi treatment of human lung cancer potentiates tumor lysis by ex vivo-expanded Vδ1-enriched γδ T cells. Mechanistically, DNMTi enhances immune synapse formation and mediates cytoskeletal reorganization via coordinated alterations of DNA methylation and chromatin accessibility. Genetic depletion of adhesion molecules or pharmacological inhibition of actin polymerization abolishes the potentiating effect of DNMTi. Clinically, the DNMTi-associated cytoskeleton signature stratifies lung cancer patients prognostically. These results support a combinatorial strategy of DNMTis and γδ T cell-based immunotherapy in lung cancer management.


Conflict of interest statement

The authors declare no competing interests.

Figures

Fig. 1
Fig. 1. Decitabine upregulates surface immune molecules related to γδ T cell activation.
a Experimental diagram of stable isotope labeling with amino acids in cell culture (SILAC)-based quantitative proteomics on biotinylated surface proteins in mock-treated vs. decitabine (DAC)-treated lung cancer cells. SDS-PAGE sodium dodecyl sulfate polyacrylamide gel electrophoresis, LC-MS/MS liquid chromatography-tandem mass spectrometry. b Treatment schedule of DAC at 100 nM daily for 72 h (D3), followed by drug withdrawal for 3 days (D3R3). c Venn diagram showing the numbers of surface proteins identified at D3 and D3R3 in A549 cells. d A scatter plot of proteins upregulated at D3 and D3R3 in A549 cells following decitabine treatment. e Heatmap showing log2 fold changes of immune-related surface molecules in DAC-treated vs. mock-treated A549 cells at D3 and D3R3. f Venn diagram showing numbers of surface proteins commonly identified at D3R3 in A549, H1299, and CL1-0 cells. g Bar graphs showing relative protein abundance of selected surface proteins related to innate immunity in surface proteomes of A549, H1299, and CL1-0 cells following decitabine treatment at D3R3 as compare with mock-treated cells. n = 1 for each treatment of individual cell lines. h PANTHER gene list analysis on immune-related pathways for proteins upregulated by decitabine at D3R3. FDR false discovery rate.
Fig. 2
Fig. 2. Decitabine enhances γδ T cell-mediated cytolysis of lung cancer cells.
a Bar graphs showing percentages of γδ T cell subsets in the CD3+ population from the peripheral blood of a healthy donor following ex vivo expansion. Data are presented as mean ± standard error of the mean (SEM). n = 3, independent experiments. b Overlay of tSNE maps of CD3+ T cells from PBMC at baseline and after ex vivo expansion analyzed by mass cytometry. Each dot represents a single cell. The color represents the expression level of the indicated markers. Red is high, and blue is low. c Pearson correlation of markers expressed in ex vivo expanded γδ T cells analyzed by mass cytometry. d Representative flow cytometric analysis of annexin V and propidium iodide (PI) apoptosis assays in human lung cancer cell lines upon treatments with 100 nM decitabine (DAC) alone, γδ T cells alone or DAC/γδ T cell combination. The effector to target (E:T) ratio is 3:1. Gating strategies are shown in Supplementary Fig. 16. e Dot plots showing three biological replicates (mean ± SEM) of apoptosis assays described in d. f Annexin V and propidium iodide apoptosis assays of a patient-derived lung cancer cell line from malignant pleural effusion, PD#0899 (mean ± SEM, n = 3, independent experiments). g Transwell migration assays of γδ T cells (upper chamber) towards mock- or DAC-treated lung cancer cells (lower chamber). Numbers of γδ T cells in the lower chambers are counted per high power field. Representative images of γδ T cells (Hoechst 33342-labeled; green) and lung cancer cells (Calcein-retained; red) in the lower chambers are shown. Data are presented as mean ± standard deviation (SD). n = 15 high power fields, over three independent experiments. Scale bar: 100 μm. The p value is calculated by one-way ANOVA with Tukey’s multiple comparison test (panels a, e and f) or the two-sided Mann–Whitney test (g).
Fig. 3
Fig. 3. Decitabine facilitates immune synapse formation between lung cancer and γδ T cells.
a Immunofluorescence imaging of immune synapses between H1299 lung cancer and γδ T cells by phosphotyrosine (pTyr) staining. Quantifications of immune synapses per cancer cell on eight randomly taken high power fields for each treatment are shown in the dot plots (mean ± SD). Scale bar: 100 μm. DAPI: 4′,6-diamidino-2-phenylindole. b A scatter plot of decitabine (DAC)-induced surface proteomes in H1299 and A549 cells at D3R3. c Representative western blot analyses of ICAM-1 expression in mock- vs. DAC-treated human lung cancer cells. β-actin: loading control. Two independent experiments were performed. d Immunofluorescence staining of ICAM-1 at immune synapses between γδ T and DAC-treated H1299 lung cancer cells. Scale bar: 10 μm. e Apoptosis assays of H1299 lung cancer cells with CRISPR-knockout of ICAM1 (KO-ICAM1) subject to γδ T cell killing for 2 h. Lung cancer cells are treated with mock, DAC alone, γδ T cells alone or a combination of DAC and γδ T cells. f Bar graphs showing cell death of three human lung cancer cell lines (KO-ICAM1) subject to γδ T cell killing for 2 h. Data were summarized from two independent knockout clones for each cell line (mean ± SEM). g Apoptosis assays of H1299 lung cancer cells with a Tet-on expression system of ICAM1 (OV-ICAM1) subject to γδ T cell killing for 2 h. h Bar graphs showing cell death of human lung cancer cell lines with ICAM1 overexpression subject to γδ T cell killing for 2 h. Data were summarized from two independent overexpression clones for each cell line (mean ± SEM). i Immunofluorescence imaging of immune synapses between H1299 KO-ICAM1 cells and γδ T cells. Scale bar: 100 μm. Quantifications of immune synapses per cancer cell on six randomly taken high power fields for each treatment are shown in the dot plots (mean ± SD). The p value is calculated by the two-sided Mann–Whitney test (a, i) or one-way ANOVA test (f, h). Gating strategies for panels e and g are shown in Supplementary Fig. 16.
Fig. 4
Fig. 4. Decitabine stabilizes the immune synaptic cleft by strengthening the actin cytoskeleton.
a Immunofluorescence staining of F-actin (red), ICAM-1 (green), pTyr (phosphotyrosine, white) at immune synapses between γδ T cells and DAC-pretreated H1299 lung cancer cells at D3R3. DAPI: 4′,6-diamidino-2-phenylindole. Scale bar: 10 μm. Three independent experiments were performed. b Immunofluorescence images of the interfaces between γδ T cells and H1299 lung cancer cells (parental vs. ICAM1 knockout (KO-ICAM1)). Signals of F-actin (red) in the periphery of H1299 cancer cells are shown in two-and-a-half-dimensional (2.5D) images in the lower panels. Scale bar: 10 μm. Three independent experiments were performed. c Dot plots of signal intensities of F-actin and ICAM-1 from five pTry-positive immune synapses between γδ T cells and H1299 lung cancer cells (parental or KO-ICAM1) from three independent experiments (mean ± SD). d Immunofluorescence images of immune synapses between γδ T cells (marked with T) and H1299 lung cancer cells (marked with C) stained for ICAM-1, F-actin, and pTyr. Three independent experiments were performed. e Dot plots of F-actin signal intensities at immune synapses between γδ T cells and H1299 cells. H1299 cells are pretreated with PBS (Mock), DAC alone or a combination of DAC pretreatment (D3R3) and 1 μg/mL Cyto B (cytochalasin B) for 1.5 h before coculture with γδ T cells (mean ± SD). n = 13–20 immune synapses over three independent experiments. f Immunofluorescence images of immune synapses between γδ T and H1299 cells pretreated with PBS (Mock), DAC alone, and combination of DAC and Cyto B. Blow-up images of the square areas for each treatment are shown in the lower panels. Arrows denote immune synapses between γδ T and H1299 cells. Scale bar: 100 μm (upper) and 20 μm (lower panels). Two independent experiments were performed. g Dot plots showing numbers of immune synapses per cancer cell on eight randomly taken high power fields for H1299 cells pretreated with PBS (Mock), DAC, and combination of DAC and Cyto B (mean ± SD). The p value is calculated by the two-way ANOVA (c) or one-way ANOVA with Tukey’s multiple comparisons test (e, g).
Fig. 5
Fig. 5. Depletion of DNMTs induces γδ T-sensitive cytoskeletal gene expression in cancer cells.
a A volcano plot showing differentially expressed genes in DAC-treated vs. Mock-treated human lung cancer cells (i.e., A549, CL1-0, CL1-5, PC9, and H1299). The y-axis denotes statistical significance (−log10 of p-value), and the x-axis displays the log2 fold change values between the DAC-treated and the Mock-treated groups. Genes related to the actin cytoskeleton, intermediate filaments, microtubule are marked in red, blue, and green, respectively. b Gene Set Enrichment Analysis (GSEA) of mRNA-seq data in five DAC-treated lung cancer cell lines — A549, CL1-0, CL1-5, PC9, and H1299. Gene sets related to actin-cytoskeleton reorganization, intermediate filament-based process, and microtubule-related gene modules are shown. NES Normalized Enrichment Score, GO gene ontology. c Heatmap showing mRNA expression of core enrichment genes for actin-cytoskeleton, intermediate filament, and microtubule-related processes in DAC-treated and mock-treated human lung cancer cells measured by mRNA-seq. FPKM fragments per kilobase of transcript per million mapped reads. d Gene Set Enrichment Analysis (GSEA) of mRNA-seq data in HCT116 and DLD1 human colorectal cancer cell lines subject to shRNA knockdown of DNA methyltransferase 1 (DNMT1). Gene sets related to actin-cytoskeleton reorganization, intermediate filament-based process, and microtubule-related gene modules are shown. NES Normalized Enrichment Score. e Box plots showing promoter methylation status of genes in the actin cytoskeleton-, intermediate filament-, and microtubule-related gene modules in human lung cancer cells treated with 100 nM DAC for three days followed by a 3-day drug-free culture (D3R3). The box denotes the 25th percentile, the median, and the 75th percentile. The whiskers indicate minimum and maximum values. Methylation data are analyzed by Infinium MethylationEPIC arrays. n = 1 for each treatment of individual cell lines. M mock-treated, D DAC-treated. f Relative chromatin accessibility around TSS of genes (−3 to +3 kb) in the actin-cytoskeleton reorganization, intermediate filament-based process, and microtubule-related modules in DAC-treated vs. mock-treated lung cancer cell lines. TSS transcription start site.
Fig. 6
Fig. 6. Decitabine combined with adoptive transfer of γδ T cells prolongs survival of mice with lung cancer xenografts.
a In vivo experiment of NOD-scid IL2rgnull (NSG) mice bearing H1299 human lung cancer xenografts treated by DAC, adoptive human γδ T transfer, or both. For every cycle of drug treatment, DAC is administered intraperitoneally for three consecutive days, followed by intravenous injection of ex vivo expanded γδ T cells on day 5 and day 12. Mice were killed one day post injection of γδ T cells following the 3rd cycle of the treatment. The tumor was surgically excised, and the weight was measured. The statistic result was determined by one-way ANOVA with Tukey’s multiple comparison test. n = 9 mice from two independent experiments (mean ± SEM). s.c. subcutaneously. b Kaplan–Meier survival curve of NSG mice in each treatment group is shown. The p value is calculated by the Mantel-Cox test (one-sided). c Ηematoxylin and eosin (H&E) staining of representative mouse tumors in each treatment group. Images of the whole tumor are generated by a digital slide scanner. d In vivo imaging of γδ T cell trafficking in a lung cancer xenograft mouse model. Ex vivo expanded γδ T cells were prestained with CYTO-ID Red long-term cell tracer dye. The NSG mice bearing H1299 lung cancer xenografts were treated with DAC (0.2 mg/Kg BW) or normal saline intraperitoneally for three consecutive days (day 1–3), followed by tail vein injection of the prestained γδ T cells on day 5 and day 12. The images were taken at 2 and 4 h after γδ T injection using IVIS Spectrum (Ex570, Em640) on day 12. Experiments were done in replicates. Representative images are shown here. BF bright field, White circle tumor region.
Fig. 7
Fig. 7. Stratification of patients with lung cancer by the immune cytoskeleton gene signature.
a Heatmaps of immune cytoskeleton gene signature derived from mRNA-seq data of primary lung adenocarcinoma tumor tissues in patients at National Taiwan University Hospital (NTUH, upper) and from The Cancer Genome Atlas (TCGA, lower). b Overall survival analysis of the NTUH (upper) and TCGA (lower) lung adenocarcinoma patient cohorts stratified by immune cytoskeleton gene signatures associated with different γδ T susceptibilities. The p value is calculated by the Mantel-Cox test (one-sided).

References

    1. Woan KV, Miller JS. Harnessing natural killer cell antitumor immunity: from the bench to bedside. Cancer Immunol. Res. 2019;7:1742–1747. doi: 10.1158/2326-6066.CIR-19-0404. - DOI - PMC - PubMed
    1. Newick K, O’Brien S, Moon E, Albelda SM. CAR T cell therapy for solid tumors. Annu. Rev. Med. 2017;68:139–152. doi: 10.1146/annurev-med-062315-120245. - DOI - PubMed
    1. Sebestyen Z, Prinz I, Dechanet-Merville J, Silva-Santos B, Kuball J. Translating gammadelta (gammadelta) T cells and their receptors into cancer cell therapies. Nat. Rev. Drug Discov. 2020;19:169–184. doi: 10.1038/s41573-019-0038-z. - DOI - PubMed
    1. Vantourout P, Hayday A. Six-of-the-best: unique contributions of gammadelta T cells to immunology. Nat. Rev. Immunol. 2013;13:88–100. doi: 10.1038/nri3384. - DOI - PMC - PubMed
    1. Fisher JP, Heuijerjans J, Yan M, Gustafsson K, Anderson J. gammadelta T cells for cancer immunotherapy: A systematic review of clinical trials. Oncoimmunology. 2014;3:e27572. doi: 10.4161/onci.27572. - DOI - PMC - PubMed

Publication types

MeSH terms