. 2021 Apr 12;12(1):2165.
doi: 10.1038/s41467-021-22489-2.

Learning cis-regulatory principles of ADAR-based RNA editing from CRISPR-mediated mutagenesis

Affiliations

Learning cis-regulatory principles of ADAR-based RNA editing from CRISPR-mediated mutagenesis

Xin Liu et al. Nat Commun. .

Abstract

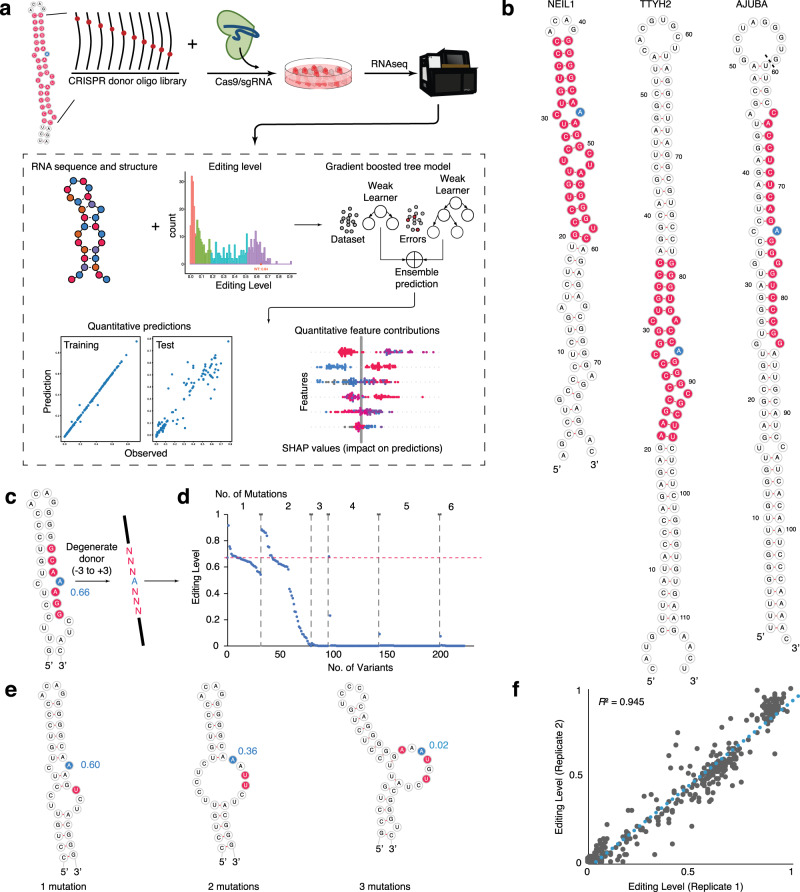
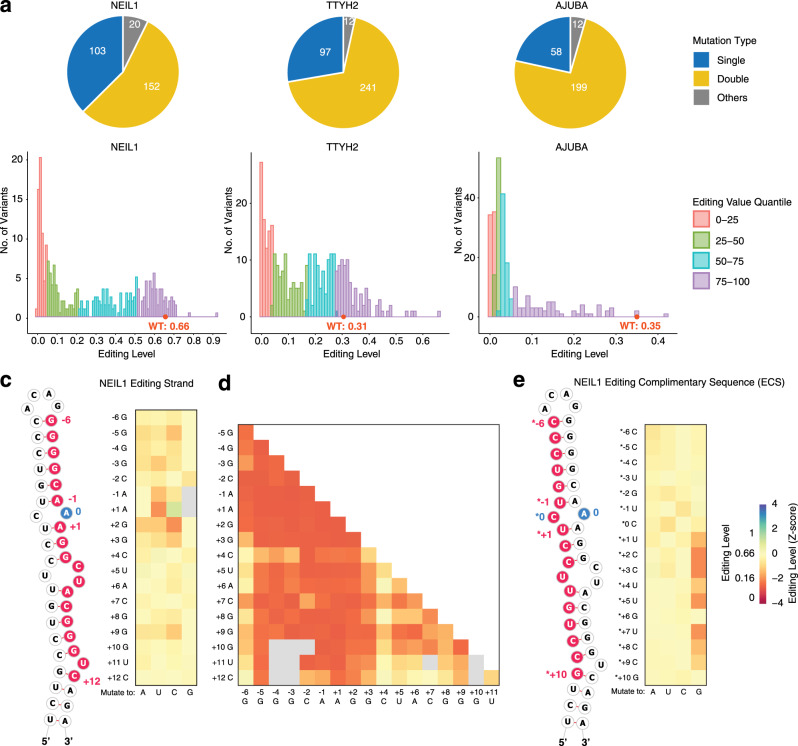
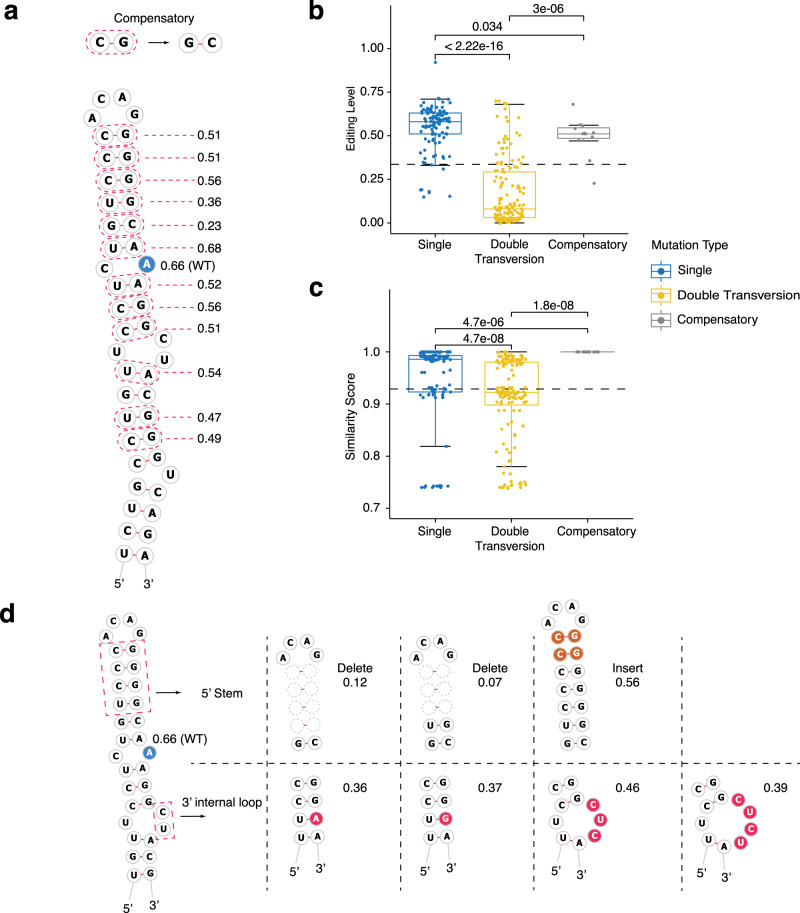
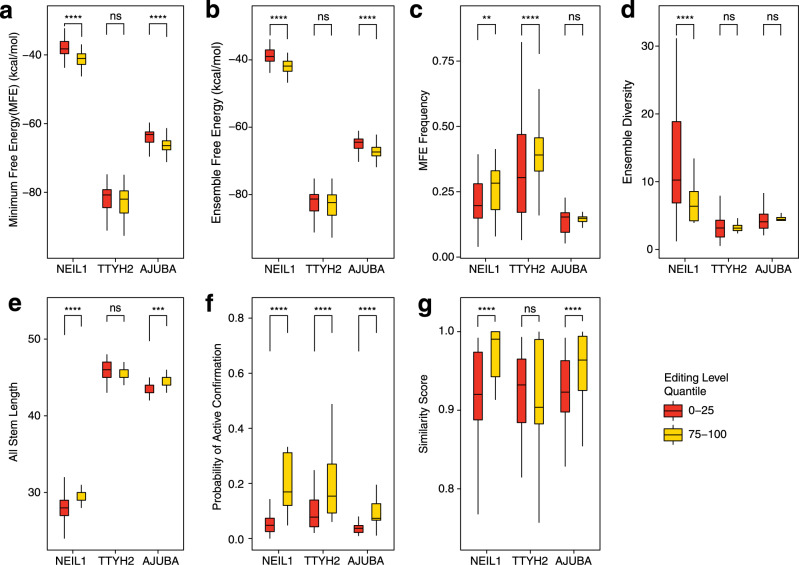
Adenosine-to-inosine (A-to-I) RNA editing catalyzed by ADAR enzymes occurs in double-stranded RNAs. Despite a compelling need towards predictive understanding of natural and engineered editing events, how the RNA sequence and structure determine the editing efficiency and specificity (i.e., cis-regulation) is poorly understood. We apply a CRISPR/Cas9-mediated saturation mutagenesis approach to generate libraries of mutations near three natural editing substrates at their endogenous genomic loci. We use machine learning to integrate diverse RNA sequence and structure features to model editing levels measured by deep sequencing. We confirm known features and identify new features important for RNA editing. Training and testing XGBoost algorithm within the same substrate yield models that explain 68 to 86 percent of substrate-specific variation in editing levels. However, the models do not generalize across substrates, suggesting complex and context-dependent regulation patterns. Our integrative approach can be applied to larger scale experiments towards deciphering the RNA editing code.


Conflict of interest statement

The authors declare the following competing interests: J.B.L. is a co-founder of AIRNA Bio and a consultant for Risen Pharma. Anna Shcherbina receives consulting fees from Myokardia, Inc, is a scientific adviser to Ravel Bio, Inc., and an employee of Insitro, Inc.

Figures

Fig. 1
Fig. 1. CRISPR/Cas9-mediated mutagenesis in endogenous RNA to dissect RNA editing by ADAR1 in cells.
a Overview of the experimental methods and computational pipeline. CRISPR/Cas9-mediated homology-directed repair is applied to mutagenesis of endogenous RNA in HEK293T cells. A supervised machine learning method (a gradient boosted tree, XGBoost) was applied to develop quantitative models that predict how cis-elements, such as RNA sequence and secondary structure determine RNA editing level. b Sequence and secondary structure of the three RNAs, NEIL1, TTYH2, and AJUBA, for targeted mutagenesis. The residues subjected to mutations are highlighted in red and the specific editing site is in blue. For AJUBA, partial sequences from the genomic sequences are taken to focus on the region of interest. Therefore, the G59 and U60 shown in b is 524 nt apart in the genomic region. c Degenerate donor oligos are designed for the −3 to +3 nt region around the specific editing site in the NEIL1 substrate. The mutagenized region is highlighted in red and the editing site in blue. The value of editing level is shown in blue. d The distribution of editing level by the number of mutations from the results of the degenerate NEIL1 library from c. e Examples of how the number of mutations affect the RNA secondary structure of NEIL1. The mutagenized nucleotied is highlighted in red and the editing site in blue. The value of editing level is shown in blue. f Reproducible editing measurement of the two replicates of the targeted mutagenesis library of NEIL1 shown by pairwise comparison with Spearman R2 labeled.
Fig. 2
Fig. 2. RNA editing results from the targeted mutagenesis experiments.
a Number of the types of mutations made in each targeted mutagenesis library, including single mutations (blue), double mutations (yellow), and other mutants such as indels (gray). b Distributions of editing levels for each targeted mutagenesis library, colored by editing level quantile in each RNA library. Pink, 25% quantile; green, 25–50% quantile; blue, 50–75% quantile; purple, 75–100% quantile. c, d Heatmap of editing levels from c single and d double mutations in the editing strand of NEIL1. e Heatmap of editing levels from single mutation in the editing complementary sequence (ECS) of NEIL1. Editing level of WT NEIL1 is 0.66 ± 0.06. The Z-score is calculated as described in “Methods” and the WT editing level Z-score is 0. ce shares the same heatmap color scale shown in e, reflecting average editing level from six biological replicates. In c and e, the mutagenized region is highlighted in red and the editing site in blue in the partial illustration of the secondary structure of NEIL1 RNA.
Fig. 3
Fig. 3. Effects of NEIL1 single mutations on RNA structure.
a Editing site is indicated by blue circle and the mutation site is marked by red circle. The editing level shown is the average value from six biological replicates. The single mutations were grouped into six types: sequence change (transition or transversion) without change in the structure, the sequence change (transition or transversion) resulted in breaking of the base pair at the mutation site (break), or resulted in breaking more than one base pair or forming of new base pair(s) (shift). E editing site, M mutation site. b Position-specific effects of NEIL1 single mutations, categorized by six types: transition mutation that does not affect RNA secondary structure (transition, blue square), transition mutation that disrupt the base pair at the mutation site (transition + break, blue triangle), transition mutation that leads to disruption of more than one base pair and/or formation of new base pair (transition + shift, blue cross), transversion mutation that does not affect RNA secondary structure (transversion, red square), transversion mutation that disrupt the base pair at the mutation site (transversion + break, red triangle), transversion mutation that leads to disruption of more than one base pair and/or formation of new base pair (transversion + shift, red cross). The Z-score is calculated for the NEIL1 RNA library as described in “Methods” and the WT editing level Z-score is 0.
Fig. 4
Fig. 4. Examples of RNA secondary structure changes of NEIL1 variants.
a Compensatory mutation generally maintains a high editing level. Editing site is highlighted in blue. The dashed circle marks the location of compensatory double mutation. The b editing level and c similarity score (normalized score calculating the similarity of the MFE structure of each variant to the WT) vary by different mutation types. Single mutation (blue dot); double-transversion mutation (yellow dot); compensatory mutation (gray dot). The data points shown are the average editing level from six biological replicates. Boxplot: center line, median; box limits, upper and lower quantiles; whiskers, ±1.5× interquartile range (IQR). The P values from two-sided Wilcoxon rank-sum test are shown on each test set. d Alterations in the 5′ stem and 3′ non-stem structure elements affect editing level. Editing site is highlighted in blue and mutation region shown as dashed circle (deletion of stem from the 5′ stem), orange highlight (insertion of stem), or red highlight (mutation, deletion, or insertion of nucleotides of the 3′ internal loop).
Fig. 5
Fig. 5. Cis-regulatory features explain differences of editing levels among RNA variants.
ag Comparing the difference of the highly edited (75–100 percentile in editing level in the library, yellow box) with the lowly edited (0–25 percentile, red box) variants in each RNA library in terms of thermodynamic and structural features. Two-sided Wilcoxon rank-sum test: ns nonsignificant; **P < 0.01; ***P < 0.001; ****P < 0.0001, and the exact P values for each feature are: a minimum free energy (MFE), P values: NEIL1 = 4.3e−12, TTYH2 = 0.44, AJUBA = 9.3e−07; b ensemble free energy, P values: NEIL1 = 2.2e−12, TTYH2 = 0.67, AJUBA = 7.2e−07; c MFE frequency, P values:  NEIL1 = 0.0013, TTYH2 = 6.8e−05, AJUBA = 0.8751; c MFE frequency, P values: NEIL1 =, TTYH2 =, AJUBA =; d ensemble diversity, P values: NEIL1 = 9.3e−05, TTYH2 = 0.72, AJUBA = 0.19; e all stem length, P values: NEIL1 = 4.6e−09, TTYH2 = 0.81011, AJUBA = 0.00024; f probability of active conformation, P values: NEIL1 = < 2e−16, TTYH2 = 1.3e−08, AJUBA = 3.8e−11; g similarity score, P values: NEIL1 = 1.3e−09, TTYH2 = 0.87, AJUBA = 2.5e−06. Boxplot: center line, median; box limits, upper and lower quantiles; whiskers, ±1.5× IQR. The editing level are the average editing level from six biological replicates.
Fig. 6
Fig. 6. NEIL1 RNA clustering reveals efficiently edited alternative structures.
a NEIL1 variants are clustered by RNAclust from the multiple sequence–structure alignment generated by mlocarna. The editing level of each variant are shown according to the heatmap scale. The sequence and structure corresponding to each RNA ID are listed in Supplementary Data 2. b Consensus secondary structure of selected clusters from a and grouped by editing levels. The gray box (“not base-paired”) indicates that there is at least one variant within the cluster that has a different MFE structure at this position (see examples in Supplementary Fig. 7).
Fig. 7
Fig. 7. Quantitative model predicts editing level by combining complex RNA sequence and structure features.
a Structure features annotated by bpRNA and included in featurization of RNA variants. b High-level feature groups for input to XGBoost analysis. u1 = structural element immediately upstream (5′) of editing site; u2 = structural element upstream of u1; site = structural element within which the editing site is found; d1 = structural element downstream (3′) of editing site; d2 = structural element downstream of d1; d3 = structural element downstream of d2. Definition of each feature is listed in Supplementary Data 1. c Illustration of a putative model for binding of the NEIL1 RNA to the ADAR1. The ADAR1 deaminase domain (silver) are modeled from ADAR2 by Phyre2. The dsRNA-binding domains (pink) are modeled in one possible conformation as described in the “Methods”. The editing site mismatch (also considered a 1:1 internal loop) on NEIL1 is shown in red and the editing A shown as space filled. The upstream (purple and light purple) and downstream (yellow, orange, and light orange) immediately adjacent to the editing site are colored according to shown in b. d XGBoost editing level predictions for variants of NEIL1 (orange), TTYH2 (purple), and AJUBA (green) within the test split (15% random split of positions). R2 is a measure of the % variance explained. Spearman R indicates correlation between observed and predicted editing values. Error bands (in gray) the 95 pointwise confidence bound for the mean predicted value, using linear smoothing. e SHAP annotation of feature contributions for the NEIL1 test split variant with the highest observed editing level. Features with positive SHAP scores (drive the prediction over the dataset base value) are indicated in pink; features with negative SHAP values (drive the prediction below the dataset base value) are indicated in blue. Base value refers to the mean predicted editing level across the test split. Output value refers to the XGBoost prediction on this example. The four features with the highest absolute value SHAP scores are shown. f SHAP annotation of feature contributions for the NEIL1 test split variant with the lowest observed editing level. g SHAP values for the 20 most important features driving XGoost editing level predictions on the test split for NEIL1, TTYH2, and AJUBA. Each dot indicates a variant in the test split and the dot color shows the SHAP value from high (red) to low (blue). Features (y-axis) are ranked from top (most significant) to bottom (least significant) by predictive importance.
Fig. 8
Fig. 8. Cis-regulatory features synergistically contribute to model prediction.
a Percent contribution of individual feature to model prediction ranked by averaging normalized SHAP values. Error bars indicate the variability in feature contribution across the three substrates NEIL1 (orange dot), TTYH2 (purple dot), and AJUBA (green dot). The new features unique to this work is highlighted in red. Higher ranking with smaller standard errors indicates that these features are commonly among the highest contributors to model prediction in all three RNAs. b Contributions of different feature groups to the prediction of editing levels for each RNA library. NEIL1 (orange), TTYH2 (purple), and AJUBA (green). Black dots indicate the scale. The subgroups of individual features included in each feature group are listed in Supplementary Data 1.

Similar articles

Cited by

References

    1. Nishikura K. Functions and regulation of RNA editing by ADAR deaminases. Annu. Rev. Biochem. 2010;79:321–349. doi: 10.1146/annurev-biochem-060208-105251. - DOI - PMC - PubMed
    1. Walkley CR, Li JB. Rewriting the transcriptome: adenosine-to-inosine RNA editing by ADARs. Genome Biol. 2017;18:205. doi: 10.1186/s13059-017-1347-3. - DOI - PMC - PubMed
    1. Melcher T, et al. A mammalian RNA editing enzyme. Nature. 1996;379:460–464. doi: 10.1038/379460a0. - DOI - PubMed
    1. Wang Y, Zheng Y, Beal PA. Adenosine deaminases that act on RNA (ADARs) Enzymes. 2017;41:215–268. doi: 10.1016/bs.enz.2017.03.006. - DOI - PubMed
    1. Hwang T, et al. Dynamic regulation of RNA editing in human brain development and disease. Nat. Neurosci. 2016;19:1093–1099. doi: 10.1038/nn.4337. - DOI - PubMed

Publication types