

RA3 is a reference-guided approach for epigenetic characterization of single cells
- PMID: 33846355
- PMCID: PMC8041798
- DOI: 10.1038/s41467-021-22495-4
RA3 is a reference-guided approach for epigenetic characterization of single cells
Abstract
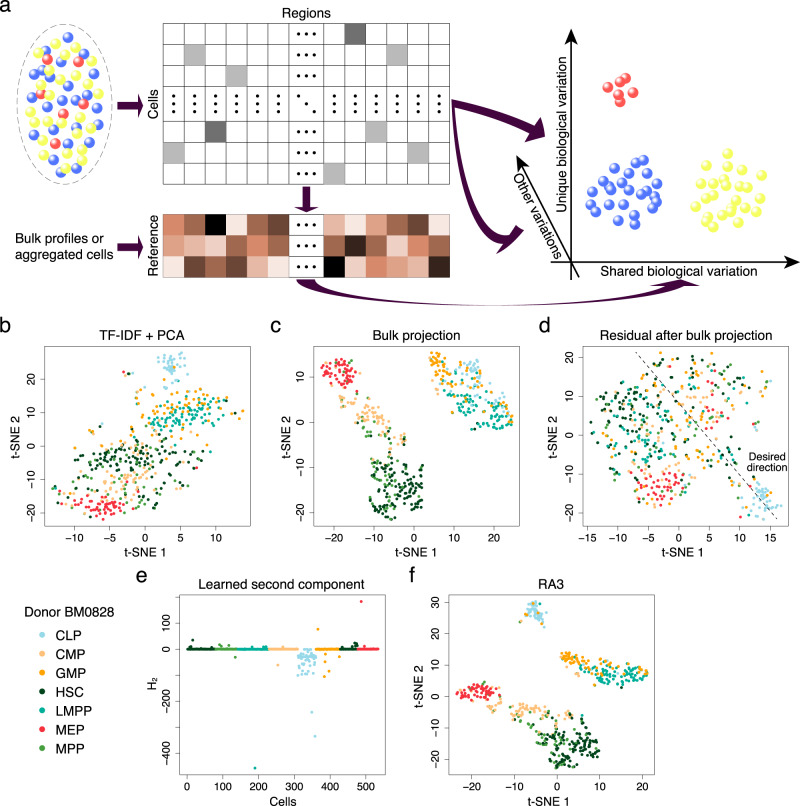
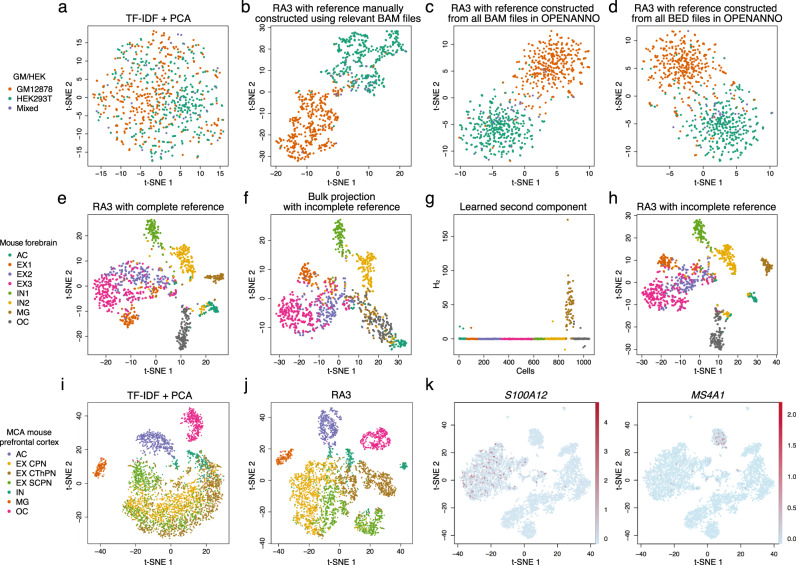
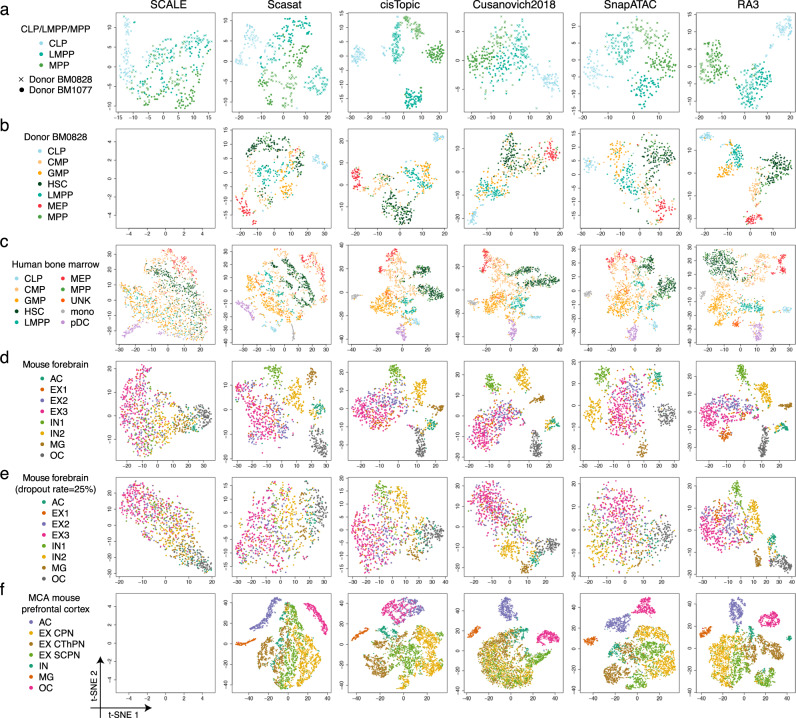
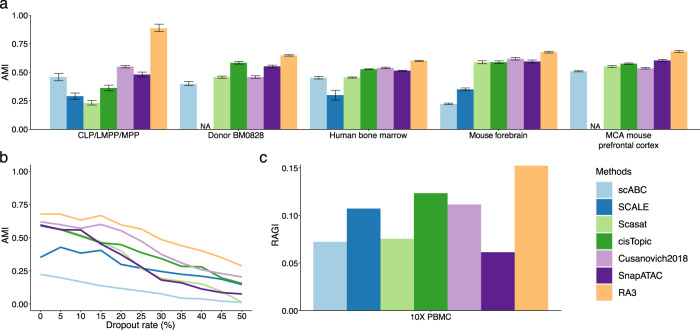
The recent advancements in single-cell technologies, including single-cell chromatin accessibility sequencing (scCAS), have enabled profiling the epigenetic landscapes for thousands of individual cells. However, the characteristics of scCAS data, including high dimensionality, high degree of sparsity and high technical variation, make the computational analysis challenging. Reference-guided approaches, which utilize the information in existing datasets, may facilitate the analysis of scCAS data. Here, we present RA3 (Reference-guided Approach for the Analysis of single-cell chromatin Accessibility data), which utilizes the information in massive existing bulk chromatin accessibility and annotated scCAS data. RA3 simultaneously models (1) the shared biological variation among scCAS data and the reference data, and (2) the unique biological variation in scCAS data that identifies distinct subpopulations. We show that RA3 achieves superior performance when used on several scCAS datasets, and on references constructed using various approaches. Altogether, these analyses demonstrate the wide applicability of RA3 in analyzing scCAS data.
Conflict of interest statement
The authors declare no competing interests.
Figures
Similar articles
-
RefTM: reference-guided topic modeling of single-cell chromatin accessibility data.Brief Bioinform. 2023 Jan 19;24(1):bbac540. doi: 10.1093/bib/bbac540. Brief Bioinform. 2023. PMID: 36513377
-
scCASE: accurate and interpretable enhancement for single-cell chromatin accessibility sequencing data.Nat Commun. 2024 Feb 22;15(1):1629. doi: 10.1038/s41467-024-46045-w. Nat Commun. 2024. PMID: 38388573 Free PMC article.
-
Accurate Annotation for Differentiating and Imbalanced Cell Types in Single-Cell Chromatin Accessibility Data.IEEE/ACM Trans Comput Biol Bioinform. 2024 May-Jun;21(3):461-471. doi: 10.1109/TCBB.2024.3372970. Epub 2024 Jun 5. IEEE/ACM Trans Comput Biol Bioinform. 2024. PMID: 38442065
-
A plate-based single-cell ATAC-seq workflow for fast and robust profiling of chromatin accessibility.Nat Protoc. 2021 Aug;16(8):4084-4107. doi: 10.1038/s41596-021-00583-5. Epub 2021 Jul 19. Nat Protoc. 2021. PMID: 34282334 Review.
-
An Informative Approach to Single-Cell Sequencing Analysis.Adv Exp Med Biol. 2019;1129:81-96. doi: 10.1007/978-981-13-6037-4_6. Adv Exp Med Biol. 2019. PMID: 30968362 Review.
Cited by
-
scIBD: a self-supervised iterative-optimizing model for boosting the detection of heterotypic doublets in single-cell chromatin accessibility data.Genome Biol. 2023 Oct 9;24(1):225. doi: 10.1186/s13059-023-03072-y. Genome Biol. 2023. PMID: 37814314 Free PMC article.
-
Descart: a method for detecting spatial chromatin accessibility patterns with inter-cellular correlations.Genome Biol. 2024 Dec 30;25(1):322. doi: 10.1186/s13059-024-03458-6. Genome Biol. 2024. PMID: 39736655 Free PMC article.
-
Cofea: correlation-based feature selection for single-cell chromatin accessibility data.Brief Bioinform. 2023 Nov 22;25(1):bbad458. doi: 10.1093/bib/bbad458. Brief Bioinform. 2023. PMID: 38113078 Free PMC article.
-
scButterfly: a versatile single-cell cross-modality translation method via dual-aligned variational autoencoders.Nat Commun. 2024 Apr 6;15(1):2973. doi: 10.1038/s41467-024-47418-x. Nat Commun. 2024. PMID: 38582890 Free PMC article.
-
OpenAnnotateApi: Python and R packages to efficiently annotate and analyze chromatin accessibility of genomic regions.Bioinform Adv. 2024 Apr 10;4(1):vbae055. doi: 10.1093/bioadv/vbae055. eCollection 2024. Bioinform Adv. 2024. PMID: 38645715 Free PMC article.
References
Publication types
MeSH terms
LinkOut - more resources
Full Text Sources
Other Literature Sources
