. 2021 Apr 12;11(1):7887.
doi: 10.1038/s41598-021-86878-9.

CD25890, a conserved protein that modulates sporulation initiation in Clostridioides difficile

Affiliations

CD25890, a conserved protein that modulates sporulation initiation in Clostridioides difficile

Diogo Martins et al. Sci Rep. .

Abstract

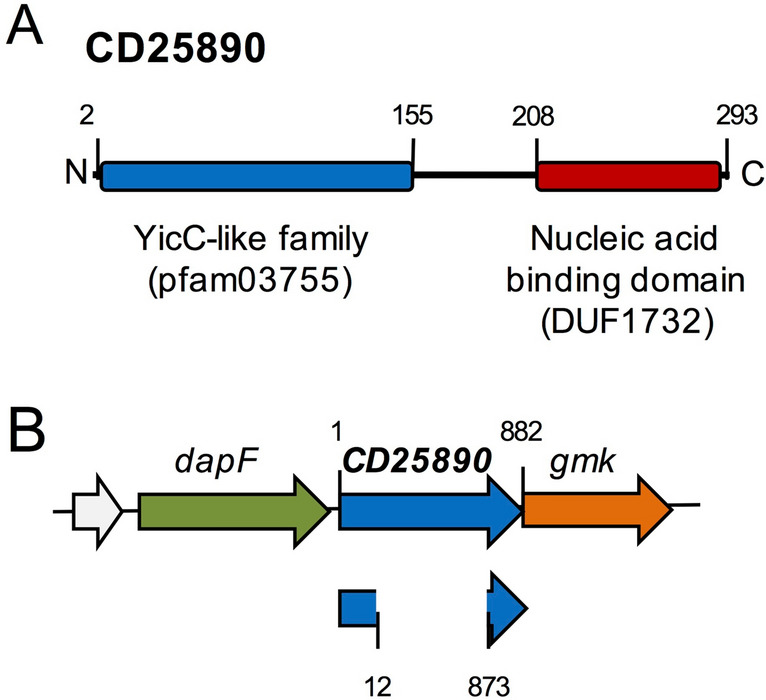
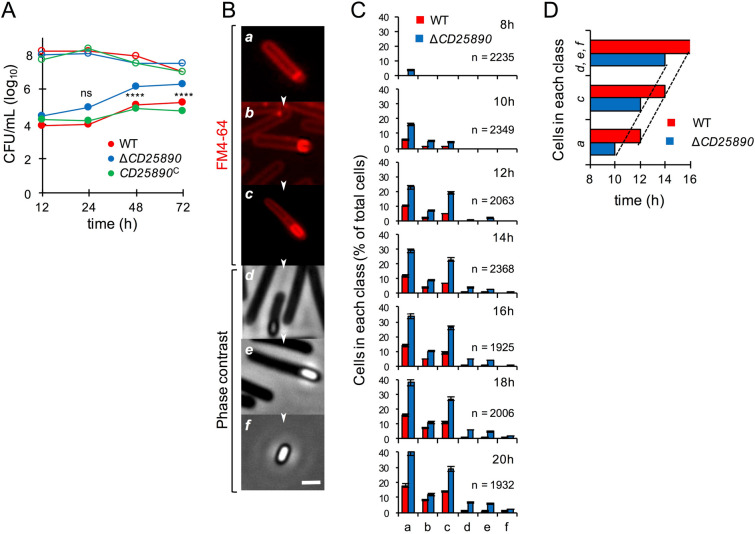
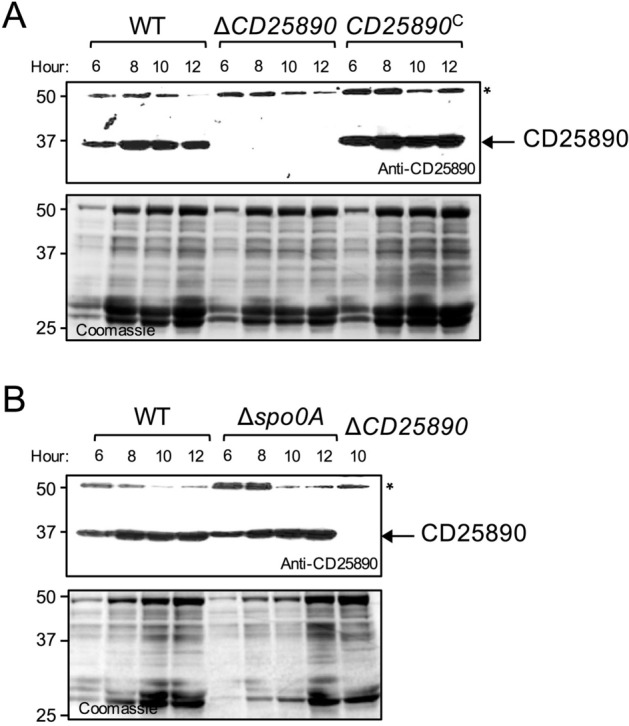
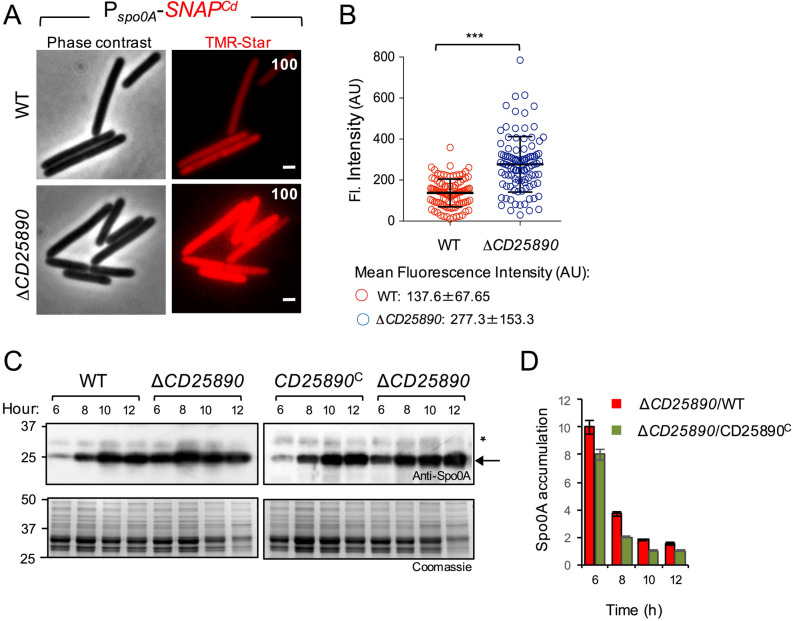
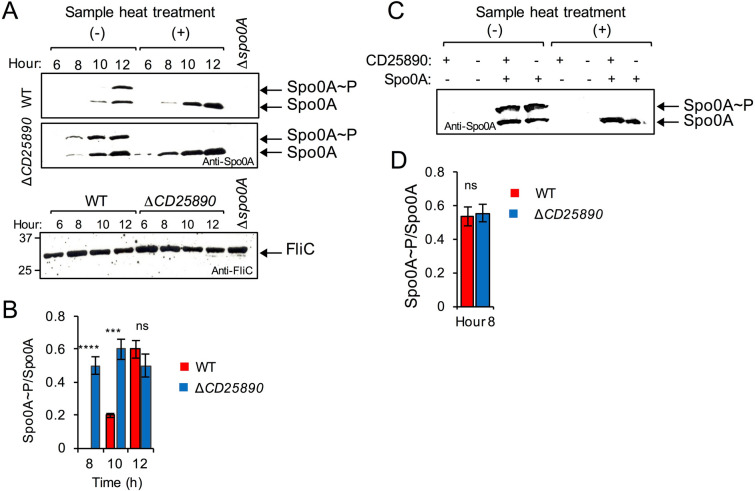
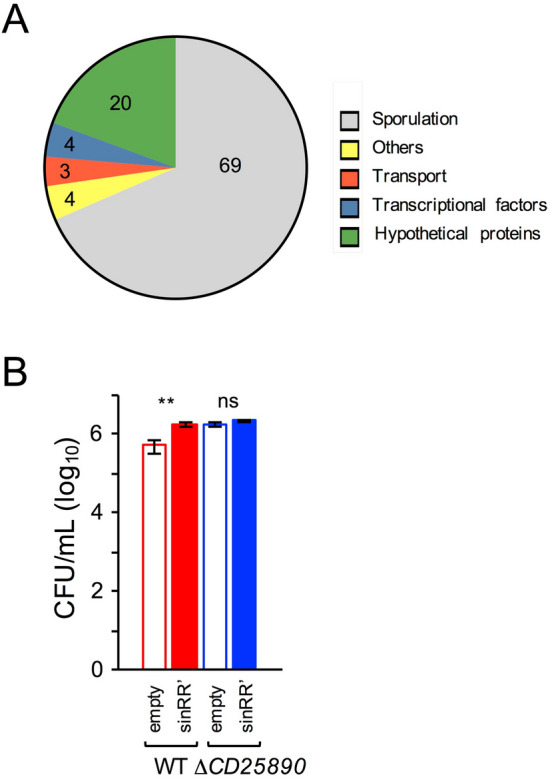
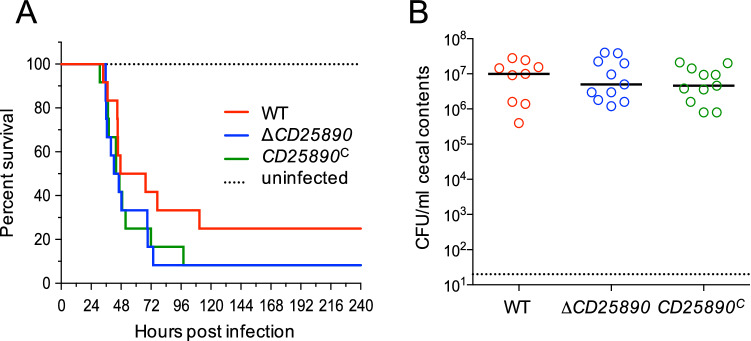
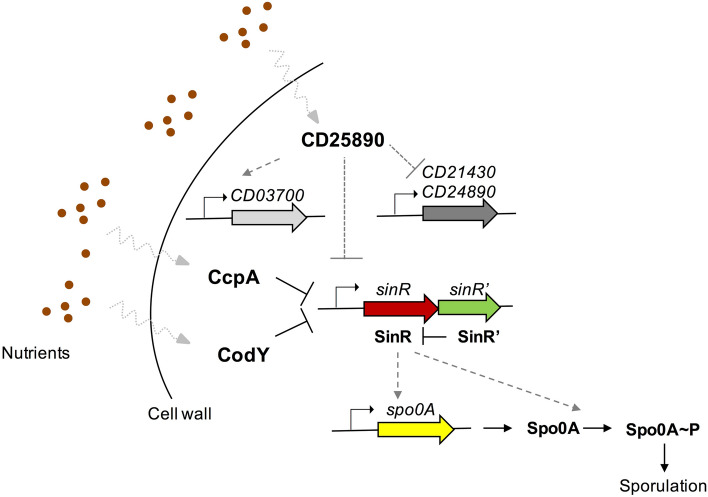
Bacteria that reside in the gastrointestinal tract of healthy humans are essential for our health, sustenance and well-being. About 50-60% of those bacteria have the ability to produce resilient spores that are important for the life cycle in the gut and for host-to-host transmission. A genomic signature for sporulation in the human intestine was recently described, which spans both commensals and pathogens such as Clostridioides difficile and contains several genes of unknown function. We report on the characterization of a signature gene, CD25890, which, as we show is involved in the control of sporulation initiation in C. difficile under certain nutritional conditions. Spo0A is the main regulatory protein controlling entry into sporulation and we show that an in-frame deletion of CD25890 results in increased expression of spo0A per cell and increased sporulation. The effect of CD25890 on spo0A is likely indirect and mediated through repression of the sinRR´ operon. Deletion of the CD25890 gene, however, does not alter the expression of the genes coding for the cytotoxins or the genes involved in biofilm formation. Our results suggest that CD25890 acts to modulate sporulation in response to the nutrients present in the environment.


Figures

Figure 1
Figure 1
Sporulation and the CD25890 protein. (A) Schematic representation of the organization predicted for the CD25890 protein. CD25890 belongs to the YicC-like family of proteins (residues 2–155) and at the C-terminal has a domain that is predicted to bind to nucleic acids (residues 208–293). (B) schematic representation of the CD25890 (CD25890) region of the C. difficile 630∆erm chromosome. The ΔCD25890 in-frame deletion removed codons 5–291 of the 293-codons.
Figure 2
Figure 2
Analysis of ΔCD25890 mutant sporulation dynamics. (A) Cells were grown in liquid SM and the titer of heat resistant spores (filled circles) and total viable cells (open circles) measured 12, 24, 48 and 72 h following inoculation. WT, red; ΔCD25890 mutant, blue; CD25890C (complementation strain), green. The date in the graph represent the mean of three independent experiments (see also Table S1). Asterisks indicate statistical significance determined with a two-way ANOVA (ns, no significant; **** p < 0.0001). (B) The panels (a-f) illustrate the sequence of the sporulation stages quantified in (C) the process begins with an asymmetric cell division (a), then, the mother cell membrane migrates around the forespore engulfing it (b). At the end of this process, the forespore becomes a free protoplast in the mother cell cytoplasm (c). Finally, the spore protective layers are synthesized and deposited around the developing spore (d and e). Upon mother cell lysis, a mature spore is released to the environment, where it remains in a dormant state until germination-promoting conditions are met (f). Images were acquired by Metamorph™ (version 5.8; Molecular Devices) (C) Samples of an SM liquid culture of the WT strain were collected at 8, 10, 12, 14, 16, 18 and 20 h after inoculation, stained with the membrane dye FM4-64 and examined by phase-contrast or fluorescent microscopy. Quantification of the percentage of cells in the morphological classes represented in B (a to f), relative to the total viable cell population, for the WT (red) and ΔCD25890 mutant (blue) at the indicated times following inoculation in liquid SM. The data represent the mean ± SD of three independent experiments. The total number of cells scored (n) is indicated in each panel. (D) Time, in hours, when at least 10% of WT or ΔCD25890 population reached the indicated stages of sporulation. The top columns show phase-bright, phase-grey spores or free spores (morphological classes d, e and f), the middle columns engulfment completion (c), and the bottom columns asymmetric septation (a).
Figure 3
Figure 3
Accumulation of CD25890 during growth. The wild type strain (WT), the ΔCD25890 mutant, the complementation strain (CD25890C) (A) and the spo0A mutant (B) were grown in SM and samples were collected at 6, 8, 10 and 12 h after inoculation for western blot analysis using anti-CD25890 antibody (* cross-reactive species). The position of molecular weight markers (in kDa) is indicated on the left side of the panels.
Figure 4
Figure 4
Increased expression of spo0A in the ΔCD25890 mutant. A: Microscopy analysis of C. difficile cells carrying a PspoOA-SNAPCd transcriptional fusion in the WT and congenic ΔCD25890 mutant. The cells were collected after 10 h of growth in SM broth, stained with TMR-Star, and examined by fluorescence microscopy to monitor SNAP production. The panels are representative of the expression patterns observed. The numbers refer to the percentage of cells showing SNAP fluorescence. Data shown are from one experiment and are representative of at least three independent experiments. Scale bar, 1 µm. B: Quantitative analysis of the fluorescence intensity (Fl.) for single cells with no signs of sporulation (n = 100 cells) of the two strains in A. Data shown are from one experiment, representative of at least three independent experiments. The numbers in the legend represent the mean and the SD of fluorescence intensity. ***, p < 0.001. Images were acquired by Metamorph™ (version 5.8; Molecular Devices) C: Samples were collected from the wild type strain (WT), the ΔCD25890 mutant and the complementation strain (CD25890C) grown in liquid SM, at the indicated times after inoculation. Extracts were prepared and proteins (15 µg) resolved by SDS-PAGE and subjected to immunobloting using an anti-Spo0A antibody. The position of molecular weight markers (in kDa) is indicated on the left side of the panels, and the arrow on the right indicates the position of Spo0A. D: Spo0A accumulation was assessed by quantification of the intensity of bands in the immunoblots using the Image J software and is shown as the ratio between the ΔCD25890 mutant and the WT (red bars) or the complementation strain (green bars) at the indicated times (in hours) after inoculation in liquid SM. All data represent the mean ± SD from three independent experiments.
Figure 5
Figure 5
Phosphorylation of Spo0A in the ΔCD25890 mutant. (A) Samples were collected from the WT and the ΔCD25890 mutant grown in liquid SM, at the indicated times after inoculation. Extracts were prepared and proteins (15 µg) resolved by Phos-tag SDS-PAGE and subjected to immunobloting using an anti-Spo0A antibody. In the bottom panel the same extracts were loaded in a SDS-PAGE and subjected to immunoblotting using an anti- FliC antibody, as a loading control. The position of molecular weight markers (in kDa) is indicated on the left side of the panels. (B) and (D): The ratio of Spo0A ~ P to Spo0A was assessed with Image J software and represented for the WT and the ΔCD25890 mutant at the indicated times (in hours) after inoculation in liquid SM. All data represent the means ± SD from three independent experiments. Asterisks indicate statistical significance determined by two-tailed Student t-test (ns, no significant; **** p < 0.0001, *** p < 0.001). C: Extracts were prepared from liquid SM cultures of the Ptet-spo0A and ΔCD25890 Ptet-spo0A strains grown in the presence (50 nM) or in the absence of anhydrotetracycline, 8 h after inoculation. Proteins (15 µg) were resolved by Phos-tag SDS-PAGE and subject to immunoblotting using an anti-Spo0A antibody. In A and (C) The faster migrating bands (black arrows) show the unphosphorylated form of Spo0A (Spo0A), and the slower migrating bands indicate the phosphorylated form of Spo0A (Spo0A ~ P). The samples heated at 100 °C for 5 min were loaded as a control for the position of unphosphorylated Spo0A.
Figure 6
Figure 6
Differential gene expression in the ΔCD25890 mutant. (A) To compare the transcriptome of the ΔCD25890 mutant with the wild type, both strains were grown for 10 h in SM broth, samples collected and RNA-seq performed. The graph represents the functional classes of the 165 genes that are up-regulated in the ΔCD25890 mutant based on the RNA seq data (the number represent the percentage of each functional class). See also Table S3. (B) Sporulation efficiency of the Ptet-sinRR’ alleles. The spore titer was determined 24 h following inoculation into SM sporulation medium supplemented with 50 nM of anhydrotetracycline. The heat resistant spore count by determining the cfu/mL obtained after treatment at 70ºC. The results shown are averages and standard deviations for three biological replicates.
Figure 7
Figure 7
The ΔCD25890 mutant show no differences in virulence. (A) and (B) Syrian golden hamsters were inoculated with approximately 5000 spores of strain 630∆erm (n = 12), CD25890 (n = 12), or CD25890C (n = 12). (A) Kaplan–Meier survival curve depicting time to morbidity. Mean times to morbidity were: 630∆erm 56.6 ± 8.2 (n = 9); CD25890 48.7 ± 4.5 (n = 11); CD25890C 49.8 ± 5.8 (n = 11). (B) Total C. difficile CFU recovered from cecal contents collected post-mortem. Dotted line demarcates limit of detection. Solid black line marks the median. Numbers of CFU are compared to 630∆erm by one-way ANOVA with Dunnett’s multiple comparisons test. No statistically differences were observed.
Figure 8
Figure 8
Model for the effect of the CD25890 gene on sporulation initiation in C. difficile. CD25890 responds to the nutrient sources and indirectly influences the sinRR’ operon expression through an unknown mechanism which represses sporulation-specific gene expression via spo0A expression. This mechanism may involve the transcriptional factors, CD03700, CD21430 and CD24890, which are differentially expressed in the CD25890 mutant. CodY and CcpA are global regulators that also respond to nutrient cues and impact sporulation by directly repressing sinRR’ expression. Solid line, direct effect; dotted line, indirect effect.

References

    1. Browne HP, et al. Culturing of 'unculturable' human microbiota reveals novel taxa and extensive sporulation. Nature. 2016;533:543–546. doi: 10.1038/nature17645. - DOI - PMC - PubMed
    1. Almeida A, et al. A new genomic blueprint of the human gut microbiota. Nature. 2019;568:499–504. doi: 10.1038/s41586-019-0965-1. - DOI - PMC - PubMed
    1. Atarashi K, et al. Induction of colonic regulatory T cells by indigenous Clostridium species. Science. 2011;331:337–341. doi: 10.1126/science.1198469. - DOI - PMC - PubMed
    1. Zhu D, Sorg JA, Sun X. Clostridioides difficile biology: sporulation, germination, and corresponding therapies for C. difficile infection. Front. Cell Infect. Microbiol. 2018;8:29. doi: 10.3389/fcimb.2018.00029. - DOI - PMC - PubMed
    1. Carroll KC, Bartlett JG. Biology of Clostridium difficile: implications for epidemiology and diagnosis. Annu. Rev. Microbiol. 2011;65:501–521. doi: 10.1146/annurev-micro-090110-102824. - DOI - PubMed

Publication types

Substances

LinkOut - more resources