. 2021 Apr 12;11(1):7940.
doi: 10.1038/s41598-021-86941-5.

Key biomarkers within the colorectal cancer related inflammatory microenvironment

Affiliations

Key biomarkers within the colorectal cancer related inflammatory microenvironment

Valentin Calu et al. Sci Rep. .

Abstract

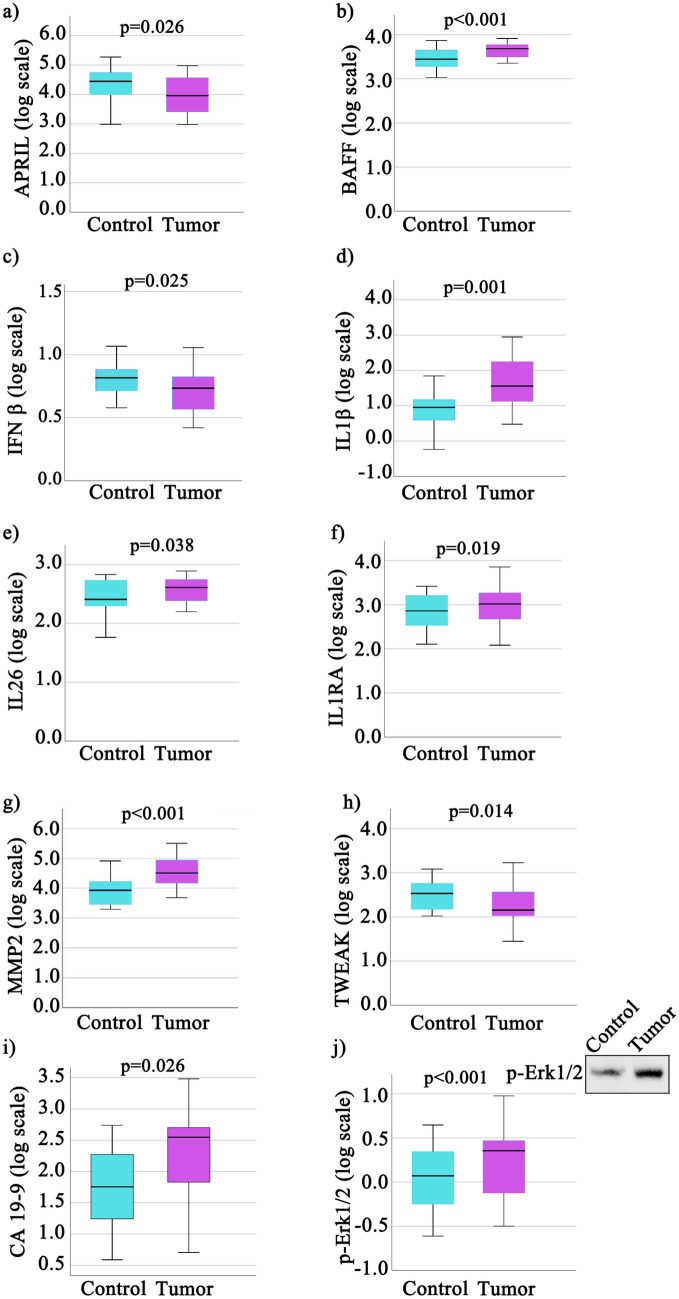
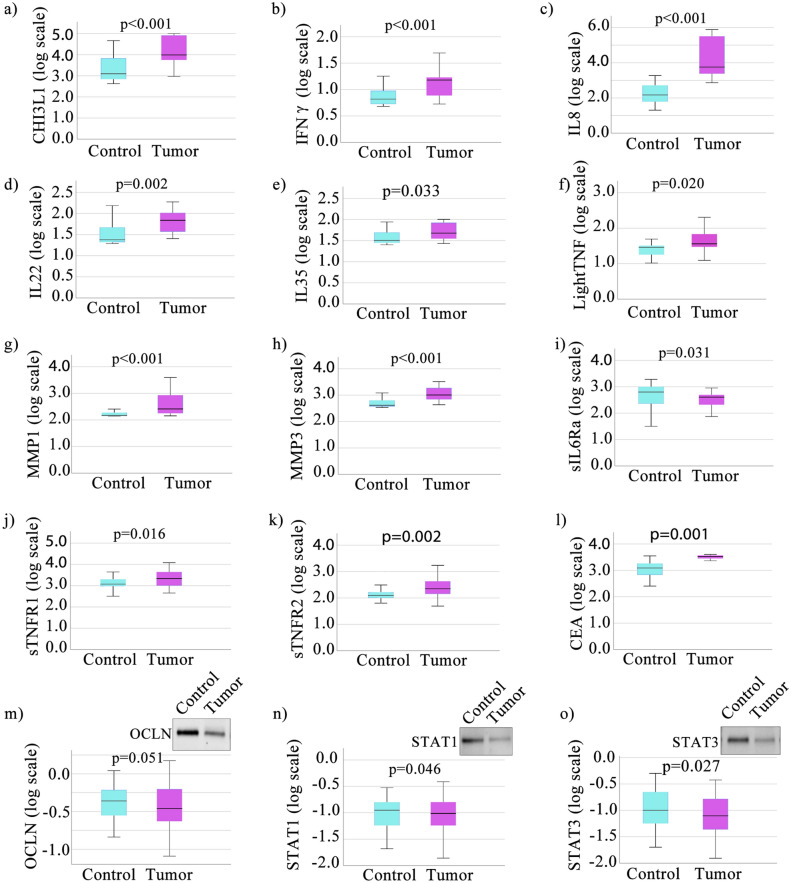
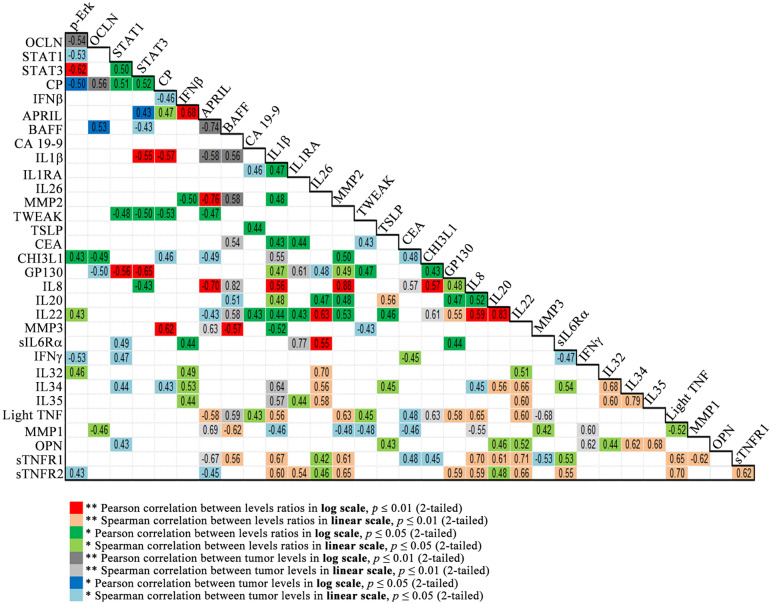
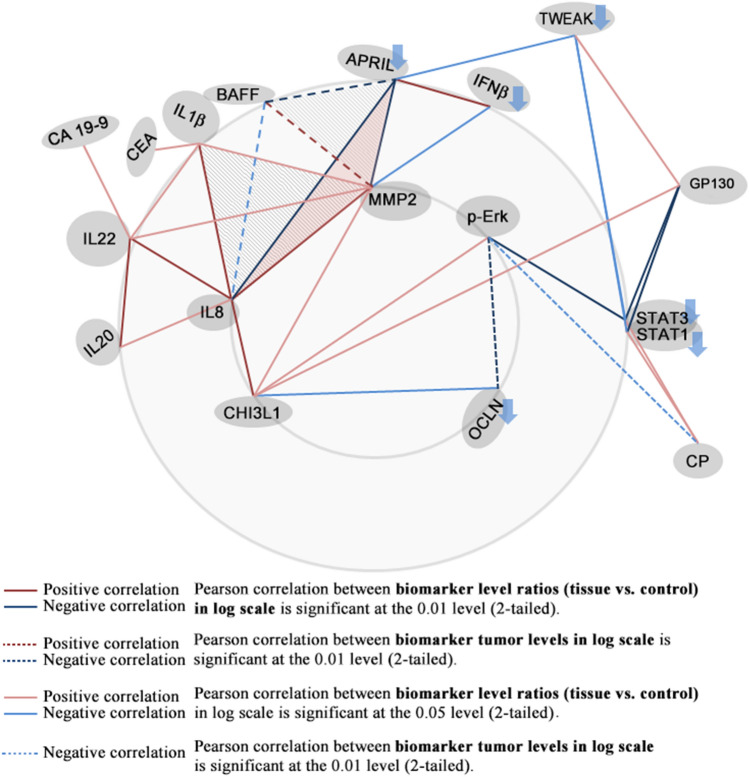
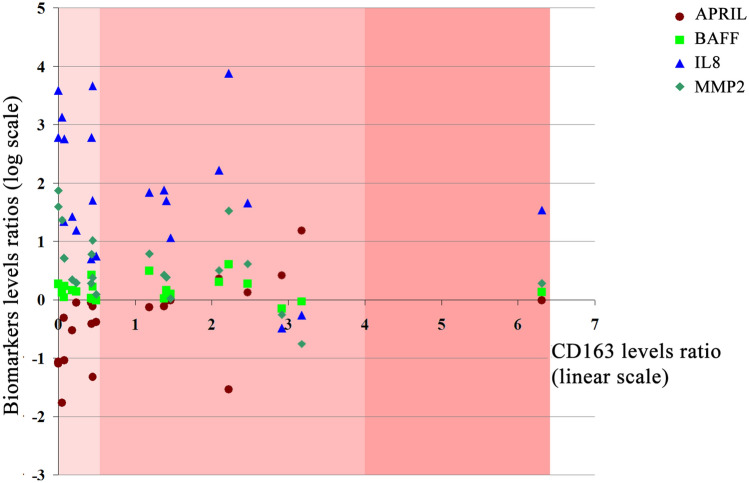
Therapeutic approaches focused on the inflammatory microenvironment are currently gaining more support, as biomolecules involved in the inflammatory colorectal cancer (CRC) tumor microenvironment are being explored. We analyzed tumor and paired normal tissue samples from CRC patients (n = 22) whom underwent tumor resection surgery. We assessed 39 inflammation-involved biomolecules (multiplex magnetic bead-based immunoassay), CEA and CA19-9 (ELISA assay) and the tissue expression levels of occludin and also pErk, STAT1 and STAT3 transcriptional factors (western blot). Tumor staging has been established by histopathological evaluation of HE stained tumor tissue sections. We report 32 biomarkers displaying statistically significant differences in tumor vs. control. Additionally, positive statistical biomarker correlations were found between MMP2-IL8 and BAFF-IL8 (Pearson correlation coefficients > 0.751), while APRIL-MMP2, APRIL-BAFF and APRIL-IL8 were negatively correlated (correlation coefficients < - 0.650). While APRIL, BAFF, IL8 and MMP2 did not modulate with tumor stage, they were inversely related to the immune infiltrate level and CD163 tissue expression. We conclude that the significantly decreased APRIL and increased BAFF, IL8 and MMP2 expression were tumor-specific and deserve consideration in the development of new treatments. Also, the positive correlation between Chitinase 3-like 1 and IL8 (0.57) or MMP2 (0.50) suggest a role in tumor growth and metastasis pathways.


Conflict of interest statement

The authors declare no competing interests.

Figures

Figure 1
Figure 1
Box-plots of log-transformed biomarker values in tumor and paired normal tissue samples. Selected log-transformed biomarker values had a normal distribution. (a) APRIL; (b) BAFF; (c) IFN β; (d) IL1β; (e) IL26; (f) IL1RA; (g) MMP2; (h) TWEAK; (i) CA19-9; (j) p-Erk1/2. In box-plot (j) the source data was the average relative density of immunoblot bands of all tumor and paired normal tissue samples; the cropped insert shows a representative immunoblot example. The original immunoblots are available in Supplementary Figure S1; p values resulting from comparison of control and tumor means of log-transformed levels through t Student test are written above each boxplot pair.
Figure 2
Figure 2
Box-plots of log-transformed biomarker levels in tumor and paired normal tissue samples. Selected log-transformed biomarker values did not exibit normal distribution. (a) CHI3L1; (b) IFN γ; (c) IL8; (d) IL22; (e) IL35; (f) Light TNF; (g) MMP1; (h) MMP3; (i) sIL6Rα; (j) sTNFR1; (k) sTNFR2; (l) CEA; (m) OCLN; (n) STAT1; (o) STAT3; in box-plots (m), (n), (o) the source data was the average relative density of immunoblot bands of all tumor and paired normal tissue samples; the cropped inserts show representative immunoblot examples for OCLN, STAT1, STAT3, The original immunoblots are available in Supplementary Figures S2, S3 and S4; p values resulting from comparison of control and tumor means of log-transformed concentration values through the Wilcoxon test are written above each boxplot pair.
Figure 3
Figure 3
Combined multi-type variables correlation matrix containing the highest values of the correlation coefficients. Combinations of the two levels of significance (0.01 and 0.05) and the type of correlation (Pearson or Spearman) is color-coded, as shown in the legend below the matrix.
Figure 4
Figure 4
Correlated biomarkers pairs connected according to their two by two positive (in red) or negative (in blue) Pearson correlation significance levels. All Pearson correlation values are shown in the Fig. 3 correlation matrix.
Figure 5
Figure 5
Plot of APRIL, BAFF, IL8 and MMP2 ratios (tumor/normal tissue) in log scale versus the CD163 ratios (tumor/normal tissue). Linear trend lines sharing the same color as the data points have been represented for each data set. The scatter plot chart area has been divided into three regions corresponding to the CD163 ratios 0.001–0.5, 0.5–4.0 and 4.0–6.0, with increasing red color intensity corresponding to the immune infiltrate observed in the histopathology reports: reduced, moderate and large.

References

    1. Komura T, et al. Immune condition of colorectal cancer patients featured by serum chemokines and gene expressions of CD4+ cells in blood. Can. J. Gastroenterol. Hepatol. 2018;2018:7436205. doi: 10.1155/2018/7436205. - DOI - PMC - PubMed
    1. Corvinus FM, et al. Persistent STAT3 activation in colon cancer is associated with enhanced cell proliferation and tumor growth. Neoplasia. 2005;7:545–555. doi: 10.1593/neo.04571. - DOI - PMC - PubMed
    1. Klampfer L. Cytokines, inflammation and colon cancer. Curr. Cancer Drug Targets. 2011;11:451–464. doi: 10.2174/156800911795538066. - DOI - PMC - PubMed
    1. Coussens LM, Werb Z. Inflammation and cancer. Nature. 2002;420:860–867. doi: 10.1038/nature01322. - DOI - PMC - PubMed
    1. Nogueira-Costa G, et al. Prognostic utility of neutrophil-to-lymphocyte ratio in patients with metastatic colorectal cancer treated using different modalities. Curr. Oncol. 2020;27:237–243. doi: 10.3747/co.27.6573. - DOI - PMC - PubMed

Publication types