. 2021 Apr 12;11(1):7951.
doi: 10.1038/s41598-021-86967-9.

Abundance and size of hyaluronan in naked mole-rat tissues and plasma

Affiliations

Abundance and size of hyaluronan in naked mole-rat tissues and plasma

Delphine Del Marmol et al. Sci Rep. .

Abstract

Large amounts of ultra-high molecular weight hyaluronan (HA) have been described as the main cause of cancer resistance in naked mole-rats (Heterocephalus glaber, NMR). Our work examined HA metabolism in these rodents more closely. HA was localized and quantified using HA binding proteins. Its molecular weight was determined using size exclusion chromatography and gel electrophoresis, HA family gene expression using RNAseq analysis, and hyaluronidase activity using zymography. Guinea pigs (Cavia porcellus) and mice (Mus musculus) were used as controls for some experiments. We found that HA localization was similar in NMR, guinea pig, and mouse tissues but NMR had larger amounts and higher molecular weight (maximum, around 2.5 MDa) of HA in serum and almost all tissues tested. We could not find ultra-high molecular weight HA (≥ 4 MDa) in NMR samples, in contrast to previous descriptions. Hyaluronidase-1 had lower expression and activity in NMR than mouse lymph nodes. RNAseq results showed that, among HA family genes, Tnfaip6 and hyaluronidase-3 (Hyal3) were systematically overexpressed in NMR tissues. In conclusion, NMR samples, contrary to expectations, do not harbor ultra-high molecular weight HA, although its amount and average molecular weight are higher in NMR than in guinea pig tissues and serum. Although hyaluronidase expression and activity are lower in NMR than mouse lymph nodes, this not sufficient to explain the presence of high molecular weight HA. A different activity of the NMR HA synthases remains possible. These characteristics, together with extremely high Hyal3 and Tnfaip6 expression, may provide the NMR with a bespoke, and perhaps protective, HA metabolism.


Conflict of interest statement

The authors have stated explicitely that there are no conflicts of interest. This work was partly supported by the Leibniz association competitive grants SAW-2012-FLI-2 and SAS-2016–2020-IZW-LFV. The study was carried out in compliance with the ARRIVE guidelines (http://www.nc3rs.org.uk/page.asp?id=1357).

Figures

Figure 1
Figure 1
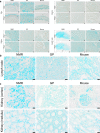
Alcian blue staining of NMR, GP, and mouse tissues. (a) NMR, GP, and mouse tissues (skin, muscle, kidney, lymph node) stained with Alcian Blue, with (+) or without (−) 3-h pre-incubation with 100 U/ml hyaluronidase from Streptomyces hyalurolyticus. Scale bars, 100 µm. (b) NMR, GP and mouse lymph node and (c) NMR, GP, and mouse kidney (cortex and medulla) at higher magnification. Scale bars, 10 µm. NMR, naked mole-rat; GP, guinea pig.
Figure 2
Figure 2
HA staining of NMR, GP, and mouse tissues. (a,b) skin; (c) muscle; (d) kidney cortex; (e) kidney medulla; (f,g) lymph node. All tissues were stained using a HA binding protein followed by peroxidase detection, with (+) or without (−) 3-h incubation with 100 U/ml hyaluronidase from Streptomyces hyalurolyticus. Positive signals are revealed in brown. Scale bars, 20 µm (a,c,d,f), 10 µm (b) and 100 µm (f). NMR naked mole-rat, GP guinea pig.
Figure 2
Figure 2
HA staining of NMR, GP, and mouse tissues. (a,b) skin; (c) muscle; (d) kidney cortex; (e) kidney medulla; (f,g) lymph node. All tissues were stained using a HA binding protein followed by peroxidase detection, with (+) or without (−) 3-h incubation with 100 U/ml hyaluronidase from Streptomyces hyalurolyticus. Positive signals are revealed in brown. Scale bars, 20 µm (a,c,d,f), 10 µm (b) and 100 µm (f). NMR naked mole-rat, GP guinea pig.
Figure 3
Figure 3
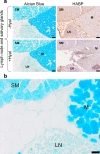
Alcian blue and HA stainings of mouse lymph node and salivary glands. (a) Mouse lymph node (LN), and sero-mucosal (SM) and mucosal (M) salivary glands stained with either Alcian Blue or a HA binding protein followed by peroxidase detection, with ( +) or without (−) 3-h incubation with 100 U/ml hyaluronidase from Streptomyces hyalurolyticus. Scale bars, 100 µm. (b) Alcian blue staining in mouse LN, and SM and M salivary glands at higher magnification. Scale bars, 20 µm.
Figure 4
Figure 4
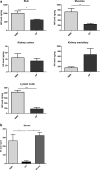
HA level in NMR and GP tissues and in NMR, GP, and mouse serum. (a) HA level (mean ± SEM) in NMR (n = 5) vs GP (n = 4) skin, NMR (n = 4) vs GP (n = 5) muscle, NMR (n = 4) vs GP (n = 4) kidney cortex and medulla, and NMR (n = 5) vs GP (n = 4) lymph node. (b) HA level in NMR (n = 8), GP (n = 4), and mouse serum (n = 4). Differences between NMR and GP are significant (***, P < 0.001; **, P < 0.01; *, P < 0.05) in skin, muscle, and lymph node (Student's t test), and in serum (ANOVA followed by Holm-Sidak test; the difference between mouse and GP is also significant using that test).
Figure 5
Figure 5
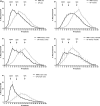
HA molecular weight distribution in NMR and GP tissues, and in NMR, GP, and mouse serum. HA molecular weight in (a) NMR (n = 4) vs GP (n = 4) skin, NMR (n = 4) vs GP (n = 4) muscles, NMR (n = 3) vs GP (n = 4) lymph nodes, and NMR (n = 3) vs GP (n = 3) kidney cortex, and NMR (n = 3) vs GP (n = 4) kidney medulla, and (b) NMR (n = 11), GP (n = 3) and mouse (n = 4) serum. The elution peaks of three HA standards (2500, 500, and 150 kDa, respectively) are shown by arrows on each graph. (c) Ratios of high- (> 500 kDa; HMW) to low- (< 150 kDa; HMW) molecular weight HA in different tissues and the serum of NMR vs GP. Means and SEM are shown.
Figure 5
Figure 5
HA molecular weight distribution in NMR and GP tissues, and in NMR, GP, and mouse serum. HA molecular weight in (a) NMR (n = 4) vs GP (n = 4) skin, NMR (n = 4) vs GP (n = 4) muscles, NMR (n = 3) vs GP (n = 4) lymph nodes, and NMR (n = 3) vs GP (n = 3) kidney cortex, and NMR (n = 3) vs GP (n = 4) kidney medulla, and (b) NMR (n = 11), GP (n = 3) and mouse (n = 4) serum. The elution peaks of three HA standards (2500, 500, and 150 kDa, respectively) are shown by arrows on each graph. (c) Ratios of high- (> 500 kDa; HMW) to low- (< 150 kDa; HMW) molecular weight HA in different tissues and the serum of NMR vs GP. Means and SEM are shown.
Figure 6
Figure 6
Agarose gel electrophoresis of HA in NMR skin samples. NMR skin samples (n = 3) and HA standards of 200 kDa, 400 kDa, 1260 kDa, 2500 kDa, and 3900 kDa, analyzed using agarose gel electrophoresis and Stains all detection (cropped gel). Full-length blots/gels are presented in Supplementary Fig. 1.
Figure 7
Figure 7
NMR fibroblast culture. (a) HA size distribution in NMR fibroblasts supernatant at 3 different times: days 3, 6, and 9, represented by supernatants 1, 2, and 3, respectively (n = 4 cultures for each condition). (b) NMR fibroblast culture treated with (+) and without (−) 3 U/ml hyaluronidase from Streptomyces hyalurolyticus in the culture media, and with (+) and without (−) attachment factor (AF).
Figure 8
Figure 8
HA-family gene expression in NMR vs mouse lymph nodes. Volcano plot of HA-family genes, spotted in red on grey background of all other genes. The p-value for differential gene expression between the two species is plotted vs gene expression fold-change.
Figure 9
Figure 9
HA-family gene expression in NMR vs GP. Volcano plot of 6 HA-family genes (Has3, Hmmr, Hyal2, Hyal3, Lyve1, Tmem2 and Tnfaip6), spotted in red on background of all other genes in grey, representing on y-axis, the statistical significance (log(P value)) vs, on x-axis, the magnitude of change (RPKM ratio) between NMR vs GP gene expression in 11 tissues (skin, heart, hypothalamus, testis, ovary, kidney, liver, thyroid, pituitary gland, cerebellum, adrenal gland).
Figure 10
Figure 10
HYAL1 activity in NMR, GP, and mouse lymph nodes (a,b) and serum (c,d). HYAL1 activity was measured using native zymography in mouse, NMR, and GP (a) lymph nodes, and (c) serum (cropped gels). Relative HYAL1 activity was assessed in (b) lymph nodes (n = 3), and (d) serum (n = 3). Means ± SEM are shown. Differences are significant (***P < 0.001; **P < 0.01; *P < 0.05) in mouse vs NMR lymph nodes (Student’s t-test; no detectable activity was found in GP lymph nodes), and between the three species in serum (ANOVA and Bonferroni test). Full-length blots/gels are presented in Supplementary Fig. 2A,B.

References

    1. Cowman MK, Lee HG, Schwertfeger KL, McCarthy JB, Turley EA. The content and size of hyaluronan in biological fluids and tissues. Front. Immunol. 2015;6:261. doi: 10.3389/fimmu.2015.00261. - DOI - PMC - PubMed
    1. Garantziotis S, Savani RC. Hyaluronan biology: A complex balancing act of structure, function, location and context. Matrix Biol. 2019;78–79:1–10. doi: 10.1016/j.matbio.2019.02.002. - DOI - PMC - PubMed
    1. Stern R, Asari AA, Sugahara KN. Hyaluronan fragments: An information-rich system. Eur. J. Cell Biol. 2006;85:699–715. doi: 10.1016/j.ejcb.2006.05.009. - DOI - PubMed
    1. Murai T. Lipid raft-mediated regulation of hyaluronan-CD44 interactions in inflammation and cancer. Front. Immunol. 2015;6:420. doi: 10.3389/fimmu.2015.00420. - DOI - PMC - PubMed
    1. Triggs-Raine B, Natowicz MR. Biology of hyaluronan: Insights from genetic disorders of hyaluronan metabolism. World J. Biol. Chem. 2015;6:110–120. doi: 10.4331/wjbc.v6.i3.110. - DOI - PMC - PubMed