

Nitrogen isotope effects can be used to diagnose N transformations in wastewater anammox systems
- PMID: 33846510
- PMCID: PMC8041819
- DOI: 10.1038/s41598-021-87184-0
Nitrogen isotope effects can be used to diagnose N transformations in wastewater anammox systems
Abstract
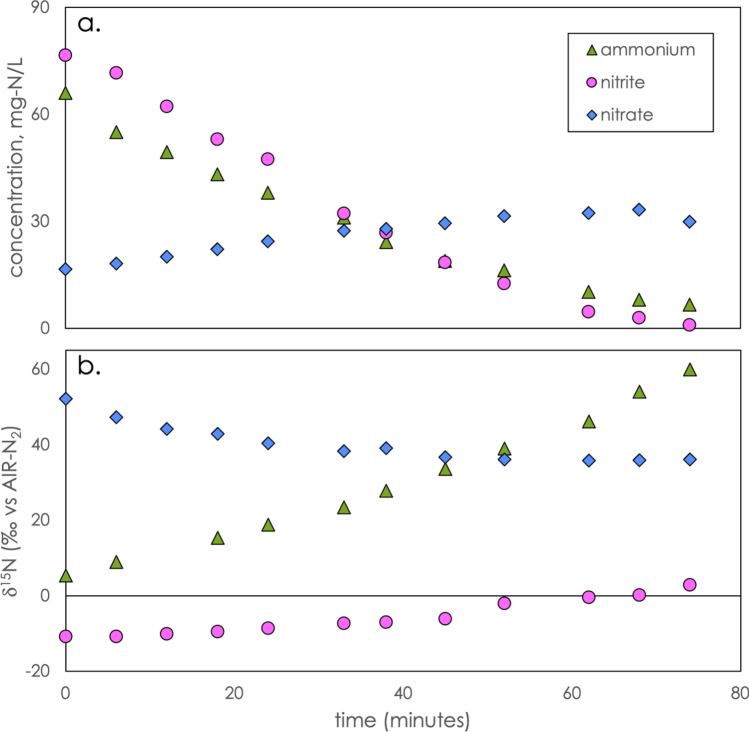
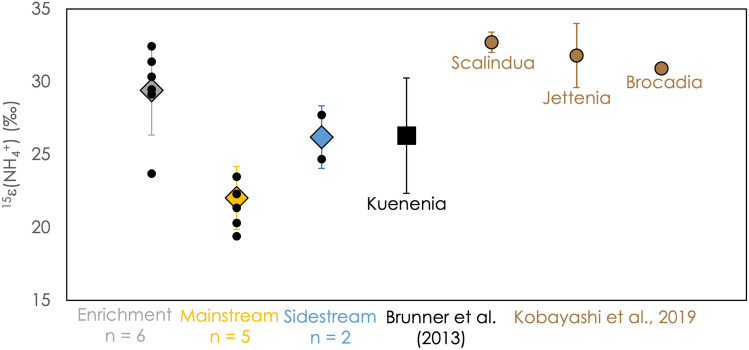
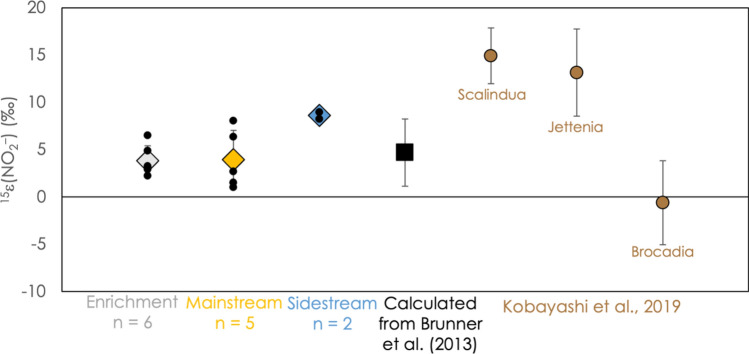
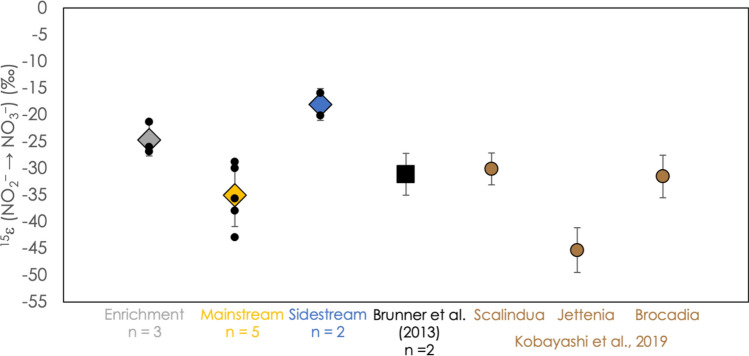
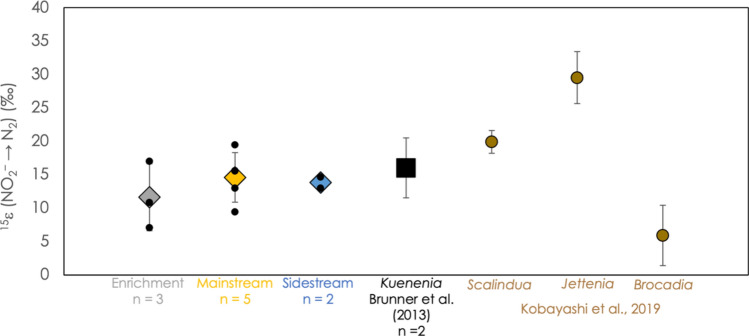
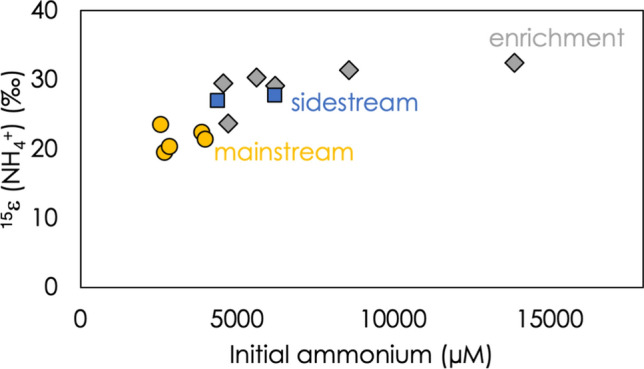
Anaerobic ammonium oxidation (anammox) plays an important role in aquatic systems as a sink of bioavailable nitrogen (N), and in engineered processes by removing ammonium from wastewater. The isotope effects anammox imparts in the N isotope signatures (15N/14N) of ammonium, nitrite, and nitrate can be used to estimate its role in environmental settings, to describe physiological and ecological variations in the anammox process, and possibly to optimize anammox-based wastewater treatment. We measured the stable N-isotope composition of ammonium, nitrite, and nitrate in wastewater cultivations of anammox bacteria. We find that the N isotope enrichment factor 15ε for the reduction of nitrite to N2 is consistent across all experimental conditions (13.5‰ ± 3.7‰), suggesting it reflects the composition of the anammox bacteria community. Values of 15ε for the oxidation of nitrite to nitrate (inverse isotope effect, - 16 to - 43‰) and for the reduction of ammonium to N2 (normal isotope effect, 19-32‰) are more variable, and likely controlled by experimental conditions. We argue that the variations in the isotope effects can be tied to the metabolism and physiology of anammox bacteria, and that the broad range of isotope effects observed for anammox introduces complications for analyzing N-isotope mass balances in natural systems.
Conflict of interest statement
The authors declare no competing interests.
Figures
Similar articles
-
Nitrogen isotope effects induced by anammox bacteria.Proc Natl Acad Sci U S A. 2013 Nov 19;110(47):18994-9. doi: 10.1073/pnas.1310488110. Epub 2013 Nov 4. Proc Natl Acad Sci U S A. 2013. PMID: 24191043 Free PMC article.
-
Dual nitrogen and oxygen isotope fractionation during anaerobic ammonium oxidation by anammox bacteria.ISME J. 2019 Oct;13(10):2426-2436. doi: 10.1038/s41396-019-0440-x. Epub 2019 May 28. ISME J. 2019. PMID: 31138875 Free PMC article.
-
Nitrogen and Oxygen Isotope Signatures of Nitrogen Compounds during Anammox in the Laboratory and a Wastewater Treatment Plant.Microbes Environ. 2020;35(4):ME20031. doi: 10.1264/jsme2.ME20031. Microbes Environ. 2020. PMID: 33162466 Free PMC article.
-
Molecular and stable isotope methods to detect and measure anaerobic ammonium oxidation (anammox) in aquatic ecosystems.Methods Enzymol. 2011;496:63-89. doi: 10.1016/B978-0-12-386489-5.00003-8. Methods Enzymol. 2011. PMID: 21514460 Review.
-
Anammox--growth physiology, cell biology, and metabolism.Adv Microb Physiol. 2012;60:211-62. doi: 10.1016/B978-0-12-398264-3.00003-6. Adv Microb Physiol. 2012. PMID: 22633060 Review.
Cited by
-
Oxygen isotope fractionation during anaerobic ammonium oxidation by the marine representative Candidatus Scalindua sp.ISME J. 2025 Jan 2;19(1):wraf115. doi: 10.1093/ismejo/wraf115. ISME J. 2025. PMID: 40454557 Free PMC article.
-
Geochemical study on nitrogen isotope composition, speciation distribution, and influencing factors of vitrinite-rich coal seams during the Late Carboniferous.Sci Rep. 2025 May 30;15(1):19095. doi: 10.1038/s41598-025-03810-1. Sci Rep. 2025. PMID: 40447772 Free PMC article.
-
Microbial Denitrification: Active Site and Reaction Path Models Predict New Isotopic Fingerprints.ACS Earth Space Chem. 2022 Nov 17;6(11):2582-2594. doi: 10.1021/acsearthspacechem.2c00102. Epub 2022 Oct 20. ACS Earth Space Chem. 2022. PMID: 36425342 Free PMC article.
-
Tracing N2O formation in full-scale wastewater treatment with natural abundance isotopes indicates control by organic substrate and process settings.Water Res X. 2022 Feb 28;15:100130. doi: 10.1016/j.wroa.2022.100130. eCollection 2022 May 1. Water Res X. 2022. PMID: 35287381 Free PMC article.
References
-
- Mulder A, van de Graaf AA, Robertson LA, Kuenen JG. Anaerobic ammonium oxidation discovered in a denitrifying fluidized bed reactor. FEMS Microbiol. Ecol. 1995;16:177–183. doi: 10.1111/j.1574-6941.1995.tb00281.x. - DOI
Publication types
LinkOut - more resources
Full Text Sources
Other Literature Sources
