. 2021 Apr 12;4(1):457.
doi: 10.1038/s42003-021-01949-x.

Population genomics and antimicrobial resistance dynamics of Escherichia coli in wastewater and river environments

Affiliations

Population genomics and antimicrobial resistance dynamics of Escherichia coli in wastewater and river environments

Jose F Delgado-Blas et al. Commun Biol. .

Abstract

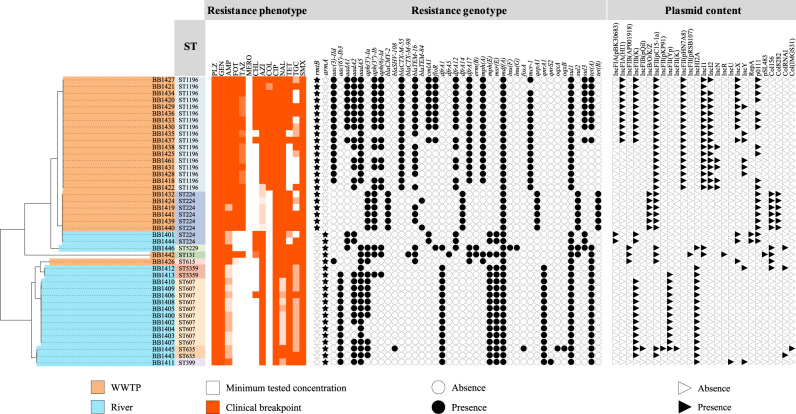
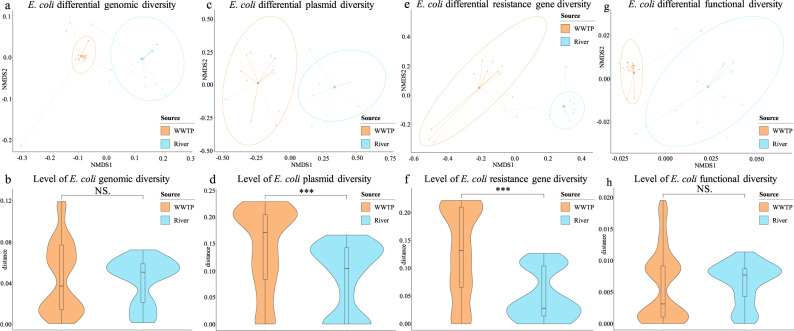
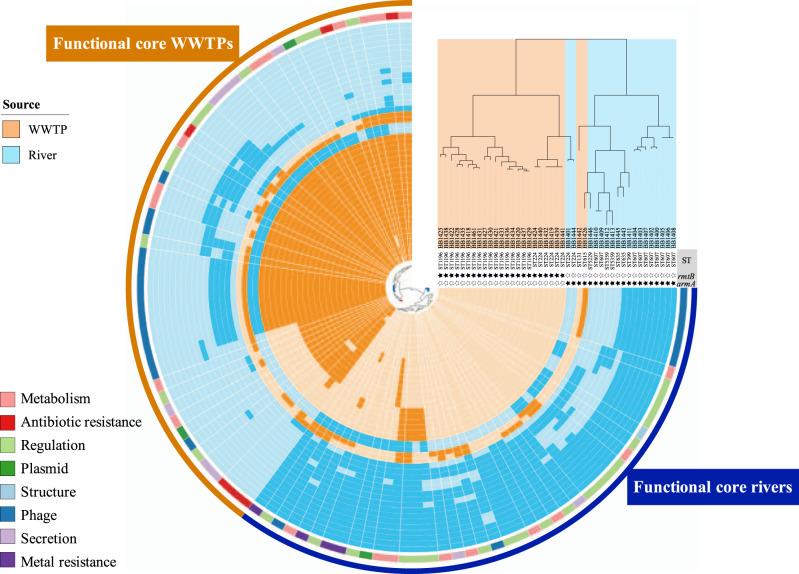
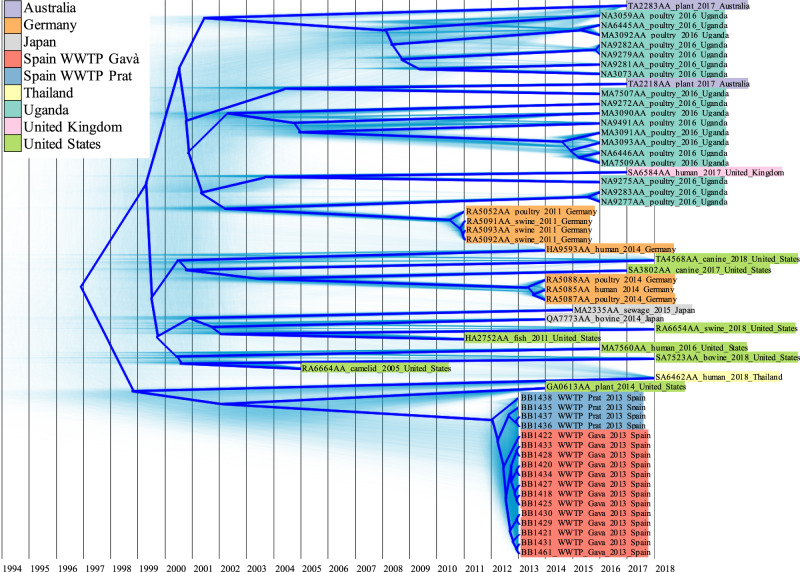
Aquatic environments are key niches for the emergence, evolution and dissemination of antimicrobial resistance. However, the population diversity and the genetic elements that drive the dynamics of resistant bacteria in different aquatic environments are still largely unknown. The aim of this study was to understand the population genomics and evolutionary events of Escherichia coli resistant to clinically important antibiotics including aminoglycosides, in anthropogenic and natural water ecosystems. Here we show that less different E. coli sequence types (STs) are identified in wastewater than in rivers, albeit more resistant to antibiotics, and with significantly more plasmids/cell (6.36 vs 3.72). However, the genomic diversity within E. coli STs in both aquatic environments is similar. Wastewater environments favor the selection of conserved chromosomal structures associated with diverse flexible plasmids, unraveling promiscuous interplasmidic resistance genes flux. On the contrary, the key driver for river E. coli adaptation is a mutable chromosome along with few plasmid types shared between diverse STs harboring a limited resistance gene content.


Conflict of interest statement

The authors declare no competing interests.

Figures

Fig. 1
Fig. 1. Geographical distribution of sampled points in the region of Barcelona (Spain).
The location of Barcelona city is indicated by black circled city icon. The Llobregat river is presented in light blue and the Cardener river in dark blue. The three river sampled locations are indicated by black circled river icon. The two sampled WWTPs are indicated by black circled droplet icon. The collection area of the El Prat WWTP is highlighted in dark green, whereas the area of the Gavà WWTP is highlighted in pale green, collecting the wastewater of 2,000,000 and 370,000 inhabitants, respectively. Total number of pan-aminoglycoside-resistant bacteria collected from each sampling location is indicated in the center of the sunburn diagrams. Inner rings represent the proportion of different pan-aminoglycoside-resistant bacterial species identified in each sampling location, indicating the total number of E. coli, K. pneumoniae and other species, and the number of E. coli isolates selected for later Illumina (I) and Nanopore sequencing (N). Outer rings show the 16S-RMTase gene harbored by these bacteria.
Fig. 2
Fig. 2. Sequenced E. coli data.
The source of the isolates is specified by different colors in the genomic SNP-tree branches, as well as the related sequence type. Level of resistance to all tested antibiotics is shown in a gradient of colors: PLZ (plazomicin), GEN (gentamicin), AMP (ampicillin), FOT (cefotaxime), TAZ (ceftazidime), MERO (meropenem), CHL (chloramphenicol), TMP (trimethoprim), AZI (azithromycin), COL (colistin), CIP (ciprofloxacin), NAL (nalidixic acid), TET (tetracycline), TGC (tigecycline), and SMX (sulfamethoxazole). The presence and absence of antibiotic resistance genes and plasmid incompatibility groups are indicated by circle and triangle symbols, respectively. The presence and absence of specific 16S-RMTase genes are indicated by star symbols.
Fig. 3
Fig. 3. Non-metric multidimensional scaling (NMDS) and violin plots according to Jaccard distance index and the environment (WWTP and river, indicated by colors).
NMDS graphs show the differential content in the total wastewater E. coli population (n = 25 independent isolates) and river E. coli population (n = 18 independent isolates), indicating the centroids for the means of each group and clustering them by colored ellipses. Violin plots show medians and quartiles for diversity levels per E. coli ST, comparing them by the origin of the isolates. Highly significant differences are indicated by ***. Non-significant differences are indicated by NS. a Differential genomic content based on core-genome analysis. b Level of genomic diversity per E. coli ST based on core-genome analysis. c Differential plasmid content based on plasmid incompatibility groups. d Level of plasmid diversity per E. coli ST based on plasmid incompatibility groups. e Differential antibiotic resistance gene content. f Level of antibiotic resistance gene diversity per E. coli ST. g Differential function content based on function prediction from core-genome analysis (BB1442 was excluded from NMDS graph to optimize the visualization). h Level of function diversity per E. coli ST based on function prediction from core-genome analysis.
Fig. 4
Fig. 4. Functional core-genome E. coli analysis.
The origin of the isolates is indicated by colors in the tree and the circular diagram. E. coli ST is indicated in the tips, as well as the presence (black star) and the absence (white star) of 16S-RMTas genes. Functional core-genome tree distribution is based on all predicted functions. A circular diagram shows the presence (dark color) and absence (light color) of functions that are specifically related to one of the environments. Inner ring colors indicate the different functions according to the classification shown in the legend. Outer ring colors indicate the functions related to the functional core-genome of wastewater and river isolates.
Fig. 5
Fig. 5. Plasmid structure comparison of 16S-RMTase gene-carrying plasmids.
a IncFII type plasmids comparison. From the inside out, the rings represent the reference plasmid (black inner ring), the GC content (black ring), the GC skew (purple/green ring), the compared plasmids (order, carrying isolate, source of the isolate, and IncFII plasmid type are shown in the table), backbone/variable region of the reference plasmid (black/gray ring) and genetic annotation for the reference plasmid (arrows are colored according to the functional groups indicated in the legend). b Pairwise comparison of the variable regions of IncFII plasmids. Names of carrying isolate are colored according to the source of the isolate. Gradient blue shades represent the sequence identity. Genetic annotation is represented by arrows and colored according to functional groups (legend). c IncHI2A type plasmids comparison. From the inside out, the rings represent the reference plasmid (black inner ring), the GC content (black ring), the GC skew (purple/green ring), the compared plasmids (order, carrying isolate and source of the isolate), backbone/variable region of the reference plasmid (black/gray ring) and genetic annotation for the reference plasmid (arrows are colored according to the functional groups indicated in the legend).
Fig. 6
Fig. 6. Phylogenetic tree of E. coli ST1196.
Probable phylogenetic reconstructions are shown with shaded green trees. Summarized root-canal tree is indicated by thick blue tree. Grid indicates the years to locate the divergent events through the evolutionary history of the ST. The name of the isolate, the source, the year of isolation, and the country of origin are indicated in the tips of the tree and colored according to the country of origin as shown in the legend.

References

    1. Vaz-Moreira I, Nunes OC, Manaia CM. Bacterial diversity and antibiotic resistance in water habitats: searching the links with the human microbiome. FEMS Microbiol. Rev. 2014;38:761–778. doi: 10.1111/1574-6976.12062. - DOI - PubMed
    1. Baquero F, Martínez JL, Cantón R. Antibiotics and antibiotic resistance in water environments. Curr. Opin. Biotechnol. 2008;19:260–265. doi: 10.1016/j.copbio.2008.05.006. - DOI - PubMed
    1. Kümmerer K. Antibiotics in the aquatic environment-a review-part II. Chemosphere. 2009;75:435–441. doi: 10.1016/j.chemosphere.2008.12.006. - DOI - PubMed
    1. Hernando-Amado S, Coque TM, Baquero F, Martínez JL. Defining and combating antibiotic resistance from one health and global health perspectives. Nat. Microbiol. 2019;4:1432–1442. doi: 10.1038/s41564-019-0503-9. - DOI - PubMed
    1. Doi Y, Wachino J-I, Arakawa Y. Aminoglycoside resistance: the emergence of acquired 16S ribosomal RNA methyltransferases. Infect. Dis. Clin. North Am. 2016;30:523–537. doi: 10.1016/j.idc.2016.02.011. - DOI - PMC - PubMed

Publication types