

Nutrient supplementation experiments with saltern microbial communities implicate utilization of DNA as a source of phosphorus
- PMID: 33846564
- PMCID: PMC8443641
- DOI: 10.1038/s41396-021-00960-8
Nutrient supplementation experiments with saltern microbial communities implicate utilization of DNA as a source of phosphorus
Abstract
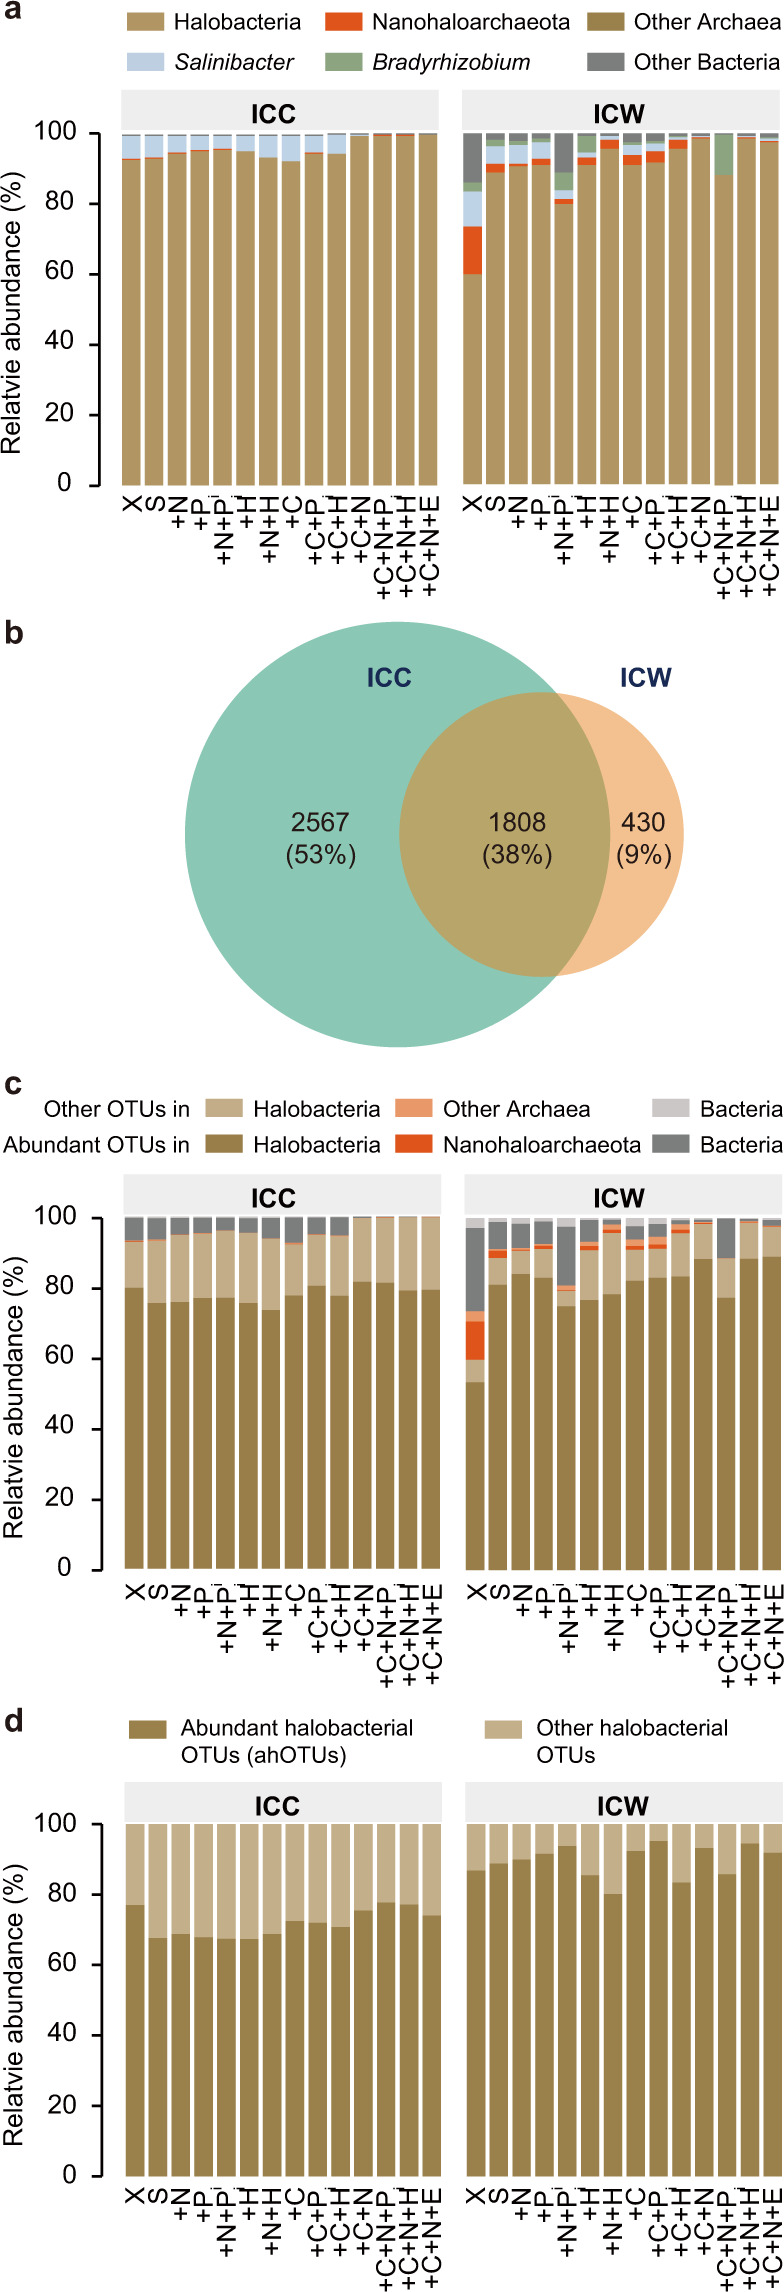
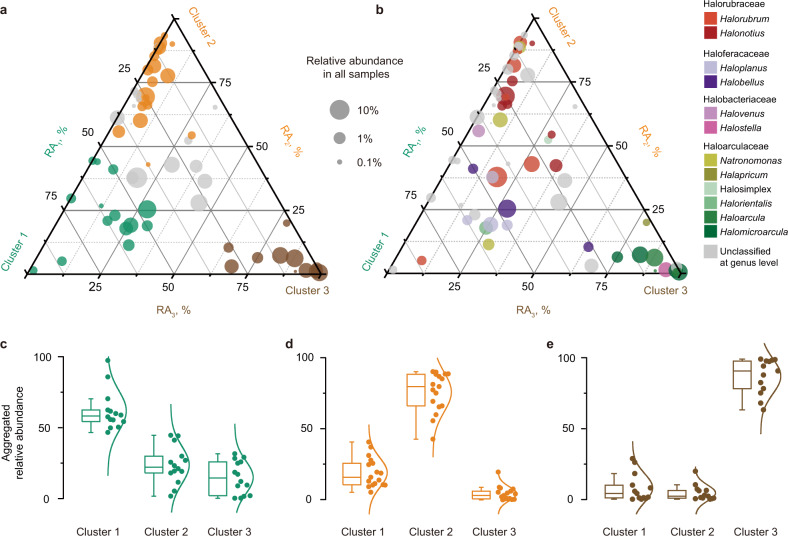
All environments including hypersaline ones harbor measurable concentrations of dissolved extracellular DNA (eDNA) that can be utilized by microbes as a nutrient. However, it remains poorly understood which eDNA components are used, and who in a community utilizes it. For this study, we incubated a saltern microbial community with combinations of carbon, nitrogen, phosphorus, and DNA, and tracked the community response in each microcosm treatment via 16S rRNA and rpoB gene sequencing. We show that microbial communities used DNA only as a phosphorus source, and provision of other sources of carbon and nitrogen was needed to exhibit a substantial growth. The taxonomic composition of eDNA in the water column changed with the availability of inorganic phosphorus or supplied DNA, hinting at preferential uptake of eDNA from specific organismal sources. Especially favored for growth was eDNA from the most abundant taxa, suggesting some haloarchaea prefer eDNA from closely related taxa. The preferential eDNA consumption and differential growth under various nutrient availability regimes were associated with substantial shifts in the taxonomic composition and diversity of microcosm communities. Therefore, we conjecture that in salterns the microbial community assembly is driven by the available resources, including eDNA.
© 2021. The Author(s).
Conflict of interest statement
The authors declare no competing interests.
Figures


Similar articles
-
Long-term nitrogen amendment alters the diversity and assemblage of soil bacterial communities in tallgrass prairie.PLoS One. 2013 Jun 28;8(6):e67884. doi: 10.1371/journal.pone.0067884. Print 2013. PLoS One. 2013. PMID: 23840782 Free PMC article.
-
Chicken manure-based bioponics: Effects of acetic acid supplementation on nitrogen and phosphorus recoveries and microbial communities.Waste Manag. 2022 Jan 1;137:264-274. doi: 10.1016/j.wasman.2021.11.023. Epub 2021 Nov 20. Waste Manag. 2022. PMID: 34814072
-
Microbial Activities and Selection from Surface Ocean to Subseafloor on the Namibian Continental Shelf.Appl Environ Microbiol. 2022 May 10;88(9):e0021622. doi: 10.1128/aem.00216-22. Epub 2022 Apr 11. Appl Environ Microbiol. 2022. PMID: 35404072 Free PMC article.
-
eDNA revealed in situ microbial community changes in response to Trapa japonica in Lake Qionghai and Lake Erhai, southwestern China.Chemosphere. 2022 Feb;288(Pt 3):132605. doi: 10.1016/j.chemosphere.2021.132605. Epub 2021 Oct 19. Chemosphere. 2022. PMID: 34678346
-
Impact of nutrients and trace elements on freshwater microbial communities in Croatia: identifying bacterial bioindicator taxa.Environ Sci Pollut Res Int. 2023 Jul;30(34):82601-82612. doi: 10.1007/s11356-023-28179-4. Epub 2023 Jun 17. Environ Sci Pollut Res Int. 2023. PMID: 37328727
Cited by
-
Reduction and discharge of SARS-CoV-2 RNA in Chicago-area water reclamation plants.FEMS Microbes. 2022 May 7;3:xtac015. doi: 10.1093/femsmc/xtac015. eCollection 2022. FEMS Microbes. 2022. PMID: 37332512 Free PMC article.
-
Prokaryotic Communities in the Thalassohaline Tuz Lake, Deep Zone, and Kayacik, Kaldirim and Yavsan Salterns (Turkey) Assessed by 16S rRNA Amplicon Sequencing.Microorganisms. 2021 Jul 17;9(7):1525. doi: 10.3390/microorganisms9071525. Microorganisms. 2021. PMID: 34361960 Free PMC article.
-
Isolation and Staining Reveal the Presence of Extracellular DNA in Marine Gel Particles.Gels. 2023 Mar 21;9(3):251. doi: 10.3390/gels9030251. Gels. 2023. PMID: 36975700 Free PMC article.
-
Mode of killing determines the necrotrophic response of oral bacteria.J Oral Microbiol. 2023 Mar 6;15(1):2184930. doi: 10.1080/20002297.2023.2184930. eCollection 2023. J Oral Microbiol. 2023. PMID: 36926228 Free PMC article.
-
Soil Microbial Community Composition and Tolerance to Contaminants in an Urban Brownfield Site.Microb Ecol. 2023 Apr;85(3):998-1012. doi: 10.1007/s00248-022-02061-1. Epub 2022 Jul 8. Microb Ecol. 2023. PMID: 35802172 Free PMC article.
References
-
- Karl DM, Bailiff MD. The measurement and distribution of dissolved nucleic acids in aquatic environments. Limnol Oceanogr. 1989;34:543–58. doi: 10.4319/lo.1989.34.3.0543. - DOI
-
- Paul JH, Cazares LH, David AW, DeFlaun MF, Jeffrey WH. The distribution of dissolved DNA in an oligotrophic and a eutrophic river of Southwest Florida. Hydrobiologia. 1991;218:53–63. doi: 10.1007/BF00006418. - DOI
-
- Carini P, Marsden PJ, Leff JW, Morgan EE, Strickland MS, Fierer N, et al. is abundant in soil and obscures estimates of soil microbial diversity. Nat Microbiol. 2016;2:1–6. - PubMed
Publication types
MeSH terms
Substances
LinkOut - more resources
Full Text Sources
Other Literature Sources
