. 2021 May;40(18):3273-3286.
doi: 10.1038/s41388-021-01761-1. Epub 2021 Apr 12.

Schlafen 5 as a novel therapeutic target in pancreatic ductal adenocarcinoma

Affiliations

Schlafen 5 as a novel therapeutic target in pancreatic ductal adenocarcinoma

Mariafausta Fischietti et al. Oncogene. 2021 May.

Abstract

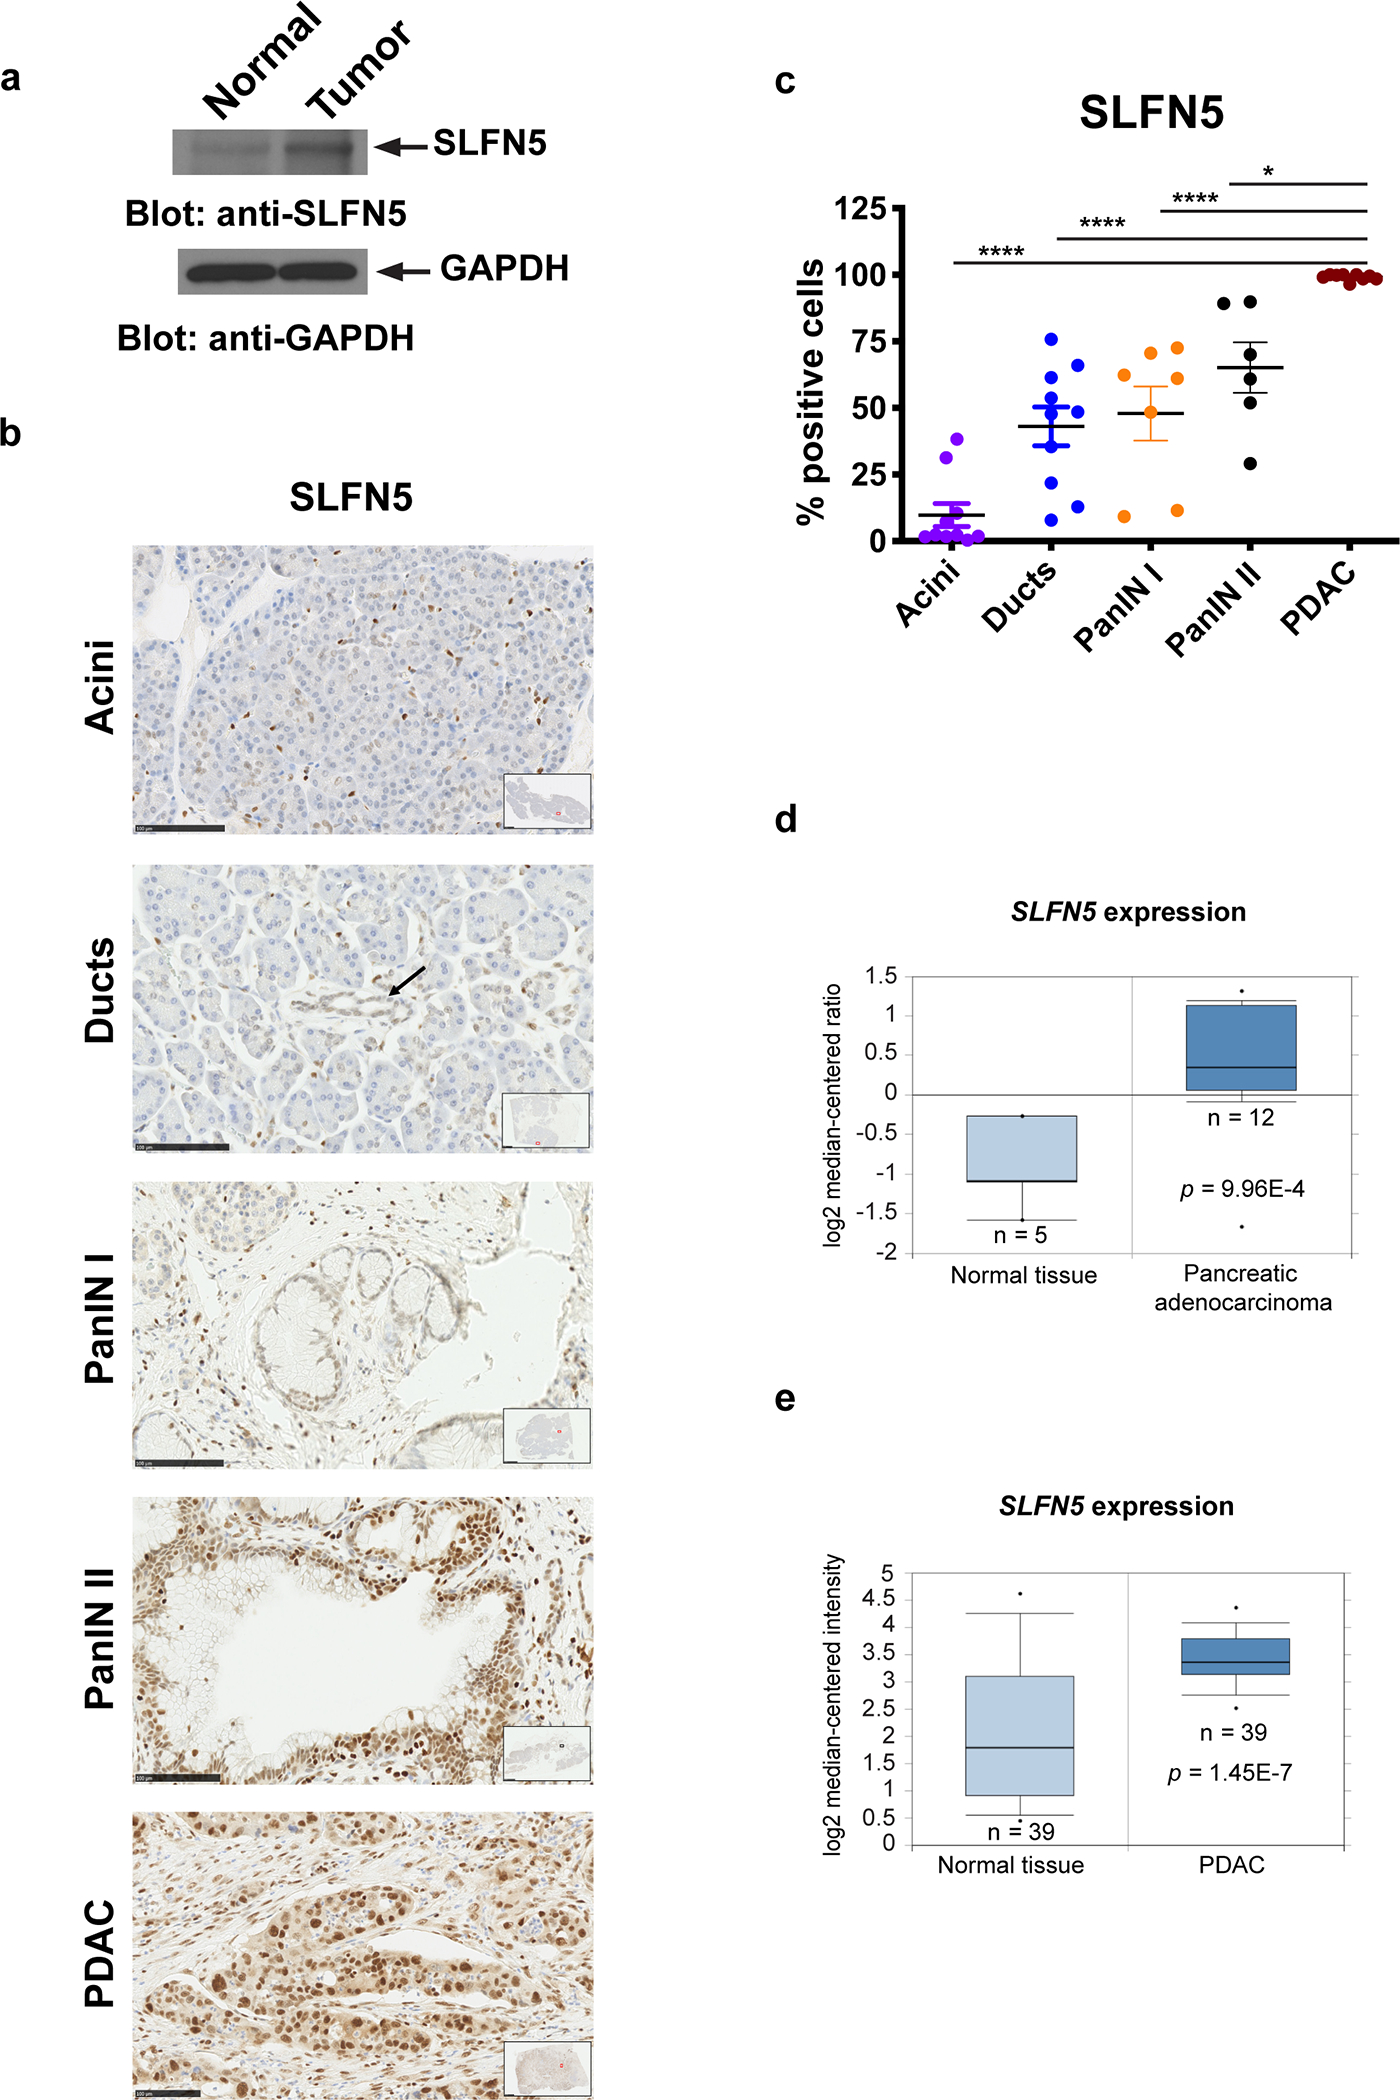
We provide evidence that a member of the human Schlafen (SLFN) family of proteins, SLFN5, is overexpressed in human pancreatic ductal adenocarcinoma (PDAC). Targeted deletion of SLFN5 results in decreased PDAC cell proliferation and suppresses PDAC tumorigenesis in in vivo PDAC models. Importantly, high expression levels of SLFN5 correlate with worse outcomes in PDAC patients, implicating SLFN5 in the pathophysiology of PDAC that leads to poor outcomes. Our studies establish novel regulatory effects of SLFN5 on cell cycle progression through binding/blocking of the transcriptional repressor E2F7, promoting transcription of key genes that stimulate S phase progression. Together, our studies suggest an essential role for SLFN5 in PDAC and support the potential for developing new therapeutic approaches for the treatment of pancreatic cancer through SLFN5 targeting.


Conflict of interest statement

Conflict of Interest: The authors declare no potential conflicts of interest.

Figures

Figure 1:
Figure 1:. SLFN5 is overexpressed in human pancreatic adenocarcinoma tumors.
(a) Equal amounts of total cell lysates (G-Bioscience) isolated from normal, healthy human pancreatic tissue and human pancreatic tumor were resolved by SDS-PAGE and immunoblotted with the indicated antibodies. (b) Representative images of pancreas tissues for SLFN5 IHC stained slides depicting normal pancreas [including acini (first panel) and interlobular ducts (second panel, as marked by an arrow)], PanIN lesions [including PanIN I (third panel) and PanIN II (fourth panel)] and PDAC (fifth panel). Insets show an overview of the tissue sections and red squares depict the location of the magnified, representative image. Scalebar = 100 μm. (c) Quantitation of SLFN5 expression (IHC staining) in different histopathological grades from pancreas tissues, using QuPath software (threshold for DAB IHC staining background: OD < 0.25). A total of 19 specimens were analyzed, including 10 morphologically normal pancreas tissues (for both normal acini and ducts), 7 PanIN I and 6 PanIN II lesions (identified in the pancreas tissue adjacent to PDAC, but no PanIN III lesions were identified in any of the 19 specimens), and 9 PDAC. Data are shown as the percentile of SLFN5 positive cells per selected areas (by reviewing the entire slide, 10 selected areas with >2,500 cells were counted for each lesion). Data represent means ± SEM. (*, p < 0.05; ****, p < 0.0001, using a one-way ANOVA with Tukey’s multiple comparison test). (d-e) SLFN5 relative gene expression levels in pancreatic cancers (dark blue) and in normal pancreatic tissues (light blue) are shown using the Iacobuzio-Donahue dataset (d) and the Badea dataset (e), both available through the Oncomine database.
Figure 2:
Figure 2:. Elevated expression of SLFN5 mRNA in pancreatic cancer patient tissues correlates with poor overall survival.
Survival analysis of pancreatic cancer patients expressing high (red) versus low (green) levels of SLFN5 (a), SLFNL1 (b), SLFN11 (c), SLFN12 (d), SLFN12L (e), SLFN13 (f) and SLFN14 (g) genes. Plots and statistical analyses were generated using PROGeneV2 software using a median score cut-off method and data were extracted from the GSE57495 dataset.
Figure 3:
Figure 3:. Loss of SLFN5 reduces pancreatic cancer cell viability in vitro.
(a) SLFN5 KO PANC-1 and MIA-Pa-Ca-2 cells were generated using CRISPR/Cas9 technology. Expression of SLFN5 in SLFN5 WT and KO PANC-1 and MIA-Pa-Ca-2 cells was determined by immunoblotting. Equal amounts of total cell lysates from the indicated cells were resolved by SDS-PAGE and immunoblotted with the indicated antibodies. (b) SLFN5 WT and KO PANC-1 and MIA-Pa-Ca-2 cells were seeded into individual wells of 96-well plates, in triplicate. Cellular proliferation was assessed every day for 5 (PANC-1) or 7 (MIA-Pa-Ca-2) days, using an Alamar-Blue viability assay. Data are means of fluorescence intensity ± SEM of 3 independent experiments (*, p < 0.05; ***, p < 0.001; ****, p < 0.0001, using a two-way ANOVA with Sidak’s multiple comparison test) (AU arbitrary units). (c) SLFN5 WT and KO PANC-1 and MIA-Pa-Ca-2 cells were plated, in triplicate, into wells of a round bottom 96-well plate (4000 cells per well) under CSCs culture conditions, to form 3-D tumor-spheres. After 14 days, tumor-spheres were stained with acridine orange and visualized using a Cytation 3 Cell Imaging Multi-Mode Reader, to determine cross-sectional area. One representative 3-D tumor-sphere image is shown (bottom panels). Data are expressed as percentages of WT parental cells and represent means ± SEM of 3 independent experiments (**, p < 0.01, using two-tailed paired t test). (d) PANC-1 and MIA-Pa-Ca-2 SLFN5 KO cells were stably transduced with Flag-SLFN5-pLenti. Expression of SLFN5 in SLFN5 KO cells was monitored by immunoblotting. Equal amounts of total cell lysates from the indicated cells were resolved by SDS-PAGE and immunoblotted with the indicated antibodies. (e) SLFN5 WT, KO and SLFN5-KO+SLFN5 PANC-1 and MIA-Pa-Ca-2 cells were seeded into individual wells of 96-well plates, in duplicate. Cellular viability was assessed every day for 6 (PANC-1) or 7 (MIA-Pa-Ca-2) days, using an Alamar-Blue viability assay. Data are means of fluorescence intensity ± SEM of 3 independent experiments (statistical analysis was performed using a two-way ANOVA with Sidak’s multiple comparison test) (AU; arbitrary units). (f) SLFN5 WT, KO and SLFN5-KO+SLFN5 PANC-1 and MIA-Pa-Ca-2 cells were plated, in triplicate, into wells of a round bottom 96-well plate (4000 cells per well) under CSCs culture conditions, to form 3-D spheroids. After 14 days, spheres were stained with acridine orange and visualized using a Cytation 3 Cell Imaging Multi-Mode Reader, to determine cross-sectional area. Representative 3-D sphere images are shown (bottom panels). Data are expressed as percentages of WT parental cells and represent means ± SEM of 3 independent experiments (****, p < 0.0001, statistical analysis was performed using a one-way ANOVA with Tukey’s multiple comparison test).
Figure 4:
Figure 4:. Identification of E2F7 interaction with SLFN5.
(a) Stable PANC-1 doxycycline-inducible flag-tagged SLFN5 overexpressing cells (PANC-1-SLFN5-Flag) were either left untreated (negative control), or were treated with doxycycline (DOX) for 48 hrs. Cells were subsequently incubated in the presence or absence of IFNα (10000 IU/ml) for 30 minutes, as indicated, and lysates were immunoprecipitated (IP) with FLAG-M2 conjugated sepharose beads. 10% of the co-IP proteins were resolved by SDS-PAGE and immunoblotted with anti-Flag-HRP specific antibody (left panel). Equal amounts of cell lysates were resolved by SDS-PAGE and immunoblotted with the indicated antibodies (right panel). (b) The remaining 90% of the co-IP proteins were submitted for LC-MS/MS analysis. Venn diagram shows the number of proteins identified as putative interactors of SLFN5 under untreated (UT) and/or IFNα-treated conditions (left panel). Ontology analysis of the 49 putative SLFN5 binding partners identified under both untreated and IFNα-treated conditions (right panel). (c) PANC-1-SLFN5-Flag cells were cultured for 48 hours in the absence or presence of DOX and then were either left untreated, or were treated with IFNα for 30 minutes, as indicated. Cell pellets were subjected to cytosolic and nuclear fractionation and protein-SLFN5-Flag complexes were co-IPed using FLAG-M2 conjugated sepharose beads followed by immunoblotting analyses using the indicated antibodies (left panel). Equal amounts of cytosolic and nuclear fractions from the co-IP experiment shown (INPUT) were resolved by SDS-PAGE and immunoblotted with the indicated antibodies (right panel).
Figure 5:
Figure 5:. Effects of loss of SLFN5 on cell cycle progression
(a) WT and SLFN5 KO PANC-1 and MIA-Pa-Ca-2 cells were either left unsynchronized (NS) or were synchronized in S phase of the cell cycle by treatment with 2mM of hydroxyurea (HU) for 16 hours, and then processed immediately (0 hrs) or processed after 6 hrs following release from HU treatment. Equal amounts of total cell lysates were resolved by SDS-PAGE and immunoblotted with the indicated antibodies. (b) SLFN5 KO PANC-1 and MIA-Pa-Ca-2 cells were transfected with control siRNA or siRNA targeting E2F7. Cells were subsequently synchronized in S phase of the cell cycle by treatment with 2mM of HU for 16hrs and then released from HU for 6 hrs. Equal amounts of total cell lysates were resolved by SDS-PAGE and immunoblotted with the indicated antibodies. (c) WT and SLFN5 KO PANC-1 and MIA-Pa-Ca-2 cells were synchronized in S phase of the cell cycle by treatment with 2mM of HU for 16 hrs and then released for 6 hrs. Cells were cross-linked with 1% formaldehyde. Chromatin-protein complexes were immunoprecipitated with anti-E2F7 antibody. Rabbit IgG antibody was used as a negative control. qPCR was performed on immunoprecipitated DNA with primers for the E2F7 binding site in the E2F1 promoter and CDC6 promoter. Data were normalized to their own IgG control, and are expressed as fold enrichment over WT cells. Shown are means ± SEM of 3 independent experiments. (*, p < 0.05 using two-tailed ratio paired t test). (d) HU-synchronized WT and SLFN5 KO PANC-1 and MIA-Pa-Ca-2 cells were released into medium containing 10μM of EdU, or left synchronized in medium containing 10μM of EdU (used as control: CTRL). Cells were then fixed and permeabilized, and EdU incorporated into newly synthesized DNA was detected using the Click-IT EdU Alexa Fluor 555 assay. Quantitative analysis was performed using a Cytation3 Cell Imaging Multi-Mode Reader. Data are expressed as fold change over CTRL samples and bar graphs represent means ± SEM of 4 independent experiments (* p < 0.05, using two-tailed ratio paired t test). (e) WT and SLFN5 KO MIA-Pa-Ca-2 cells were either synchronized in late G1 phase with double thymidine block (Thy) and released for the indicated time points, or left unsynchronized (NS). Equal amounts of total cell lysates were resolved by SDS-PAGE and immunoblotted with the indicated antibodies. (f-g) SLFN5 WT and KO PANC-1 cells were either synchronized in late G1 phase with double thymidine block (Thy) and released for the indicated time points or left unsynchronized (NS). Flow cytometric analysis of DNA content of propidium iodide (PI)-stained cells. Representative plots (f) and quantitative measurement of cell cycle phases (g) of 3 independent experiments are shown.
Figure 6:
Figure 6:. Loss of SLFN5 inhibits tumor growth and prolongs survival in an orthotopic pancreatic cancer xenograft mouse model.
WT and SLFN5 KO MIA-Pa-Ca-2 luciferase-expressing cells (n=13 per genotype) were injected into the pancreas of athymic NUDE mice and tumor growth was monitored weekly by bioluminescence (BLI) visualization (a) Representative BLI of WT and SLFN5 KO pancreatic tumors 32 days after tumor cell implantation. (b) Measurement of tumor volumes by BLI over time. Arrows and numbers indicate the day after implantation of tumor cells and the number of tumors that reached BLI Radiance ≥ 2.5X10¹⁰, respectively. Data are means ± SEM of normalized BLI values for each genotypic group. (***, p < 0.001 for day 18, using two-way ANOVA with Sidak’s multiple comparison test). (c) Kaplan-Meier survival curves of mice bearing WT and SLFN5 KO PDAC tumors. Statistical analysis was performed using Kaplan Meier with a Mantel-Cox (log rank) test. (d-f) WT (n=4) and SLFN5 KO (n=5) MIA-Pa-Ca-2 luciferase-expressing cells were injected into the pancreas of each athymic NUDE mice and tumors were collected 25 days after tumor cell implantation. (d) Representative hematoxylin and eosin (H&E) staining images of mouse pancreas implanted with WT MIA-Pa-Ca-2 cells (upper panel) and SLFN5 KO MIA-Pa-Ca-2 tumor cells (lower panel). Scalebar = 2.5 mm. (e) Representative SLNF5 immunostaining images of mouse pancreas implanted with WT MIA-Pa-Ca-2 cells (upper panel) and SLFN5 KO MIA-Pa-Ca-2 cells (lower panel). Insets show overview of the sections, and red squares depict location of the magnified, representative image. Scalebar = 100 μm. (f) Representative Ki67 immunostaining images (left panel) of mouse pancreas implanted with WT MIA-Pa-Ca-2 cells (upper panel) and SLFN5 KO MIA-Pa-Ca-2 cells (lower panel). Insets show overview of the sections and red squares depict location of the magnified, representative image. Scalebar = 100 μm. Percentage of Ki67-positive cells in the mice pancreas implanted with WT MIA-Pa-Ca-2 cells (n=4) and SLFN5 KO MIA-Pa-Ca-2 cells (n=3) was quantified using QuPath software (right panel) (threshold 0.55). Data are shown as the percentile of Ki67 positive cells per tumor area. Data represent means ± SEM for each experimental group. (p = 0.0571, using Mann-Whitney U test).
Figure 7:
Figure 7:. Proposed model for the role of SLFN5 in pancreatic cancer.
SLFN5 is overexpressed in pancreatic tumor cells and binds the transcriptional repressor E2F7, blocking its function. Activator E2Fs are therefore able to bind to the promoter regions of cell cycle genes, inducing their expression and promoting cell cycle progression, leading to cell proliferation and tumor progression. Targeted deletion or inhibition of SLFN5 frees E2F7 that can then bind to the promoter region of cell cycle genes repressing gene expression and, consequently, slowing cell cycle progression and tumor growth.

Similar articles

Cited by

References

    1. Mavrommatis E, Fish EN, Platanias LC. The schlafen family of proteins and their regulation by interferons. J Interferon Cytokine Res 2013; 33: 206–210. - PMC - PubMed
    1. Liu F, Zhou P, Wang Q, Zhang M, Li D. The Schlafen family: complex roles in different cell types and virus replication. Cell Biol Int 2018; 42: 2–8. - PubMed
    1. Soper A, Kimura I, Nagaoka S, Konno Y, Yamamoto K, Koyanagi Y et al. Type I Interferon Responses by HIV-1 Infection: Association with Disease Progression and Control. Front Immunol 2017; 8: 1823. - PMC - PubMed
    1. Fletcher SJ, Johnson B, Lowe GC, Bem D, Drake S, Lordkipanidze M et al. SLFN14 mutations underlie thrombocytopenia with excessive bleeding and platelet secretion defects. J Clin Invest 2015; 125: 3600–3605. - PMC - PubMed
    1. Xia Z, Liu Q, Berger CT, Keenan BT, Kaliszewska A, Cheney PC et al. A 17q12 allele is associated with altered NK cell subsets and function. J Immunol 2012; 188: 3315–3322. - PMC - PubMed

Publication types

MeSH terms