. 2021 Jun;126(6):896-912.
doi: 10.1038/s41437-021-00426-9. Epub 2021 Apr 12.

Inferring number of populations and changes in connectivity under the n-island model

Affiliations

Inferring number of populations and changes in connectivity under the n-island model

Armando Arredondo et al. Heredity (Edinb). 2021 Jun.

Erratum in

Abstract

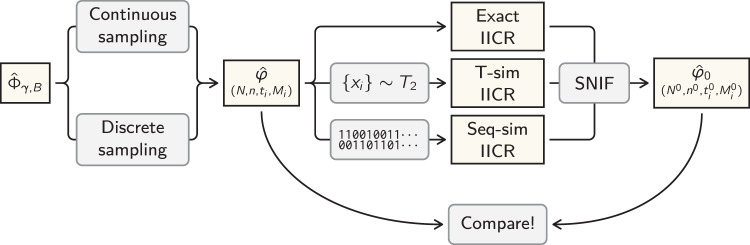
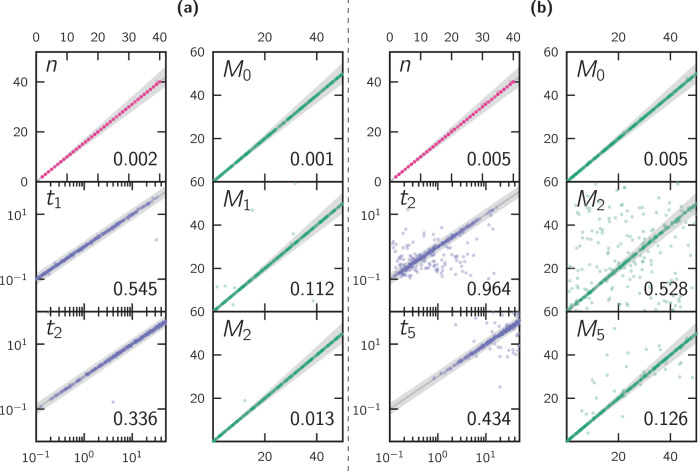
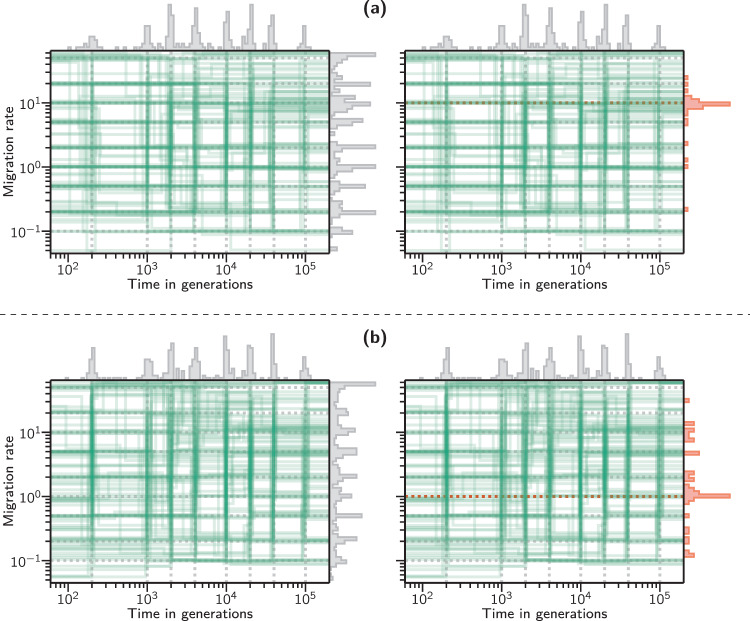
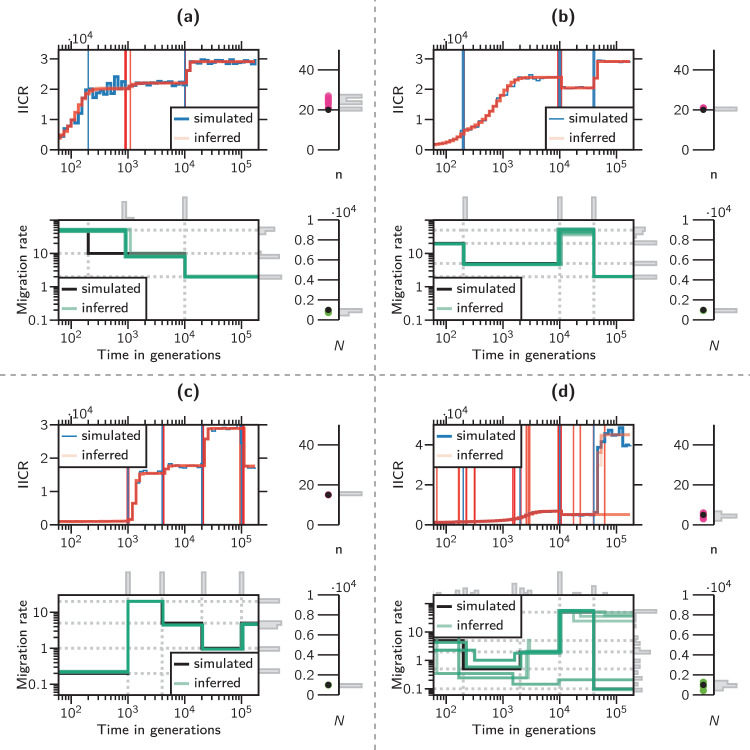
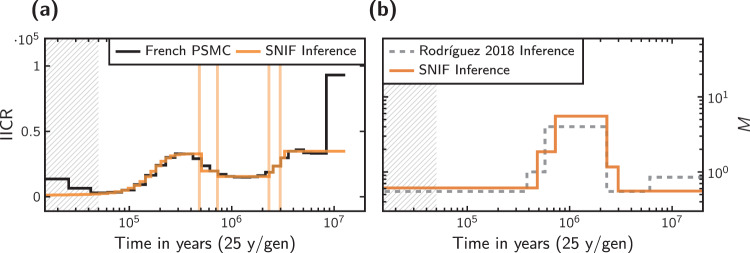
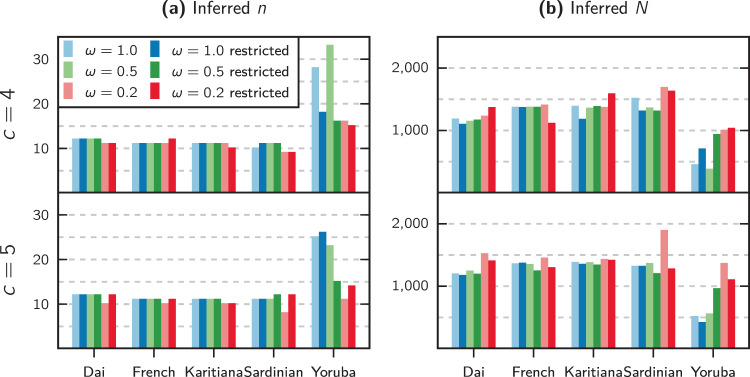
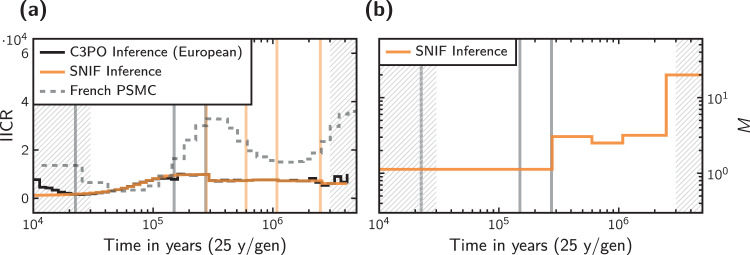
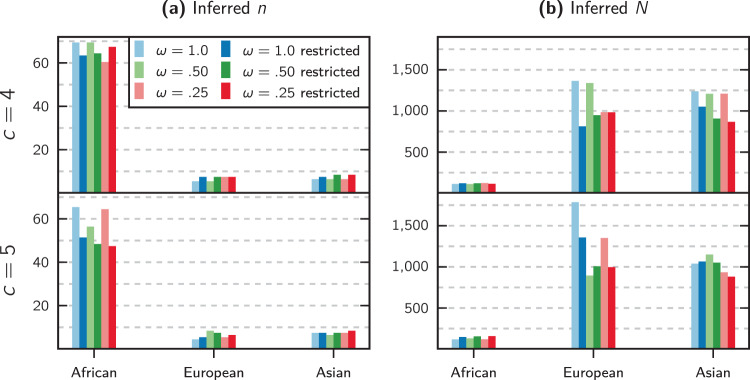
Inferring the demographic history of species is one of the greatest challenges in populations genetics. This history is often represented as a history of size changes, ignoring population structure. Alternatively, when structure is assumed, it is defined a priori as a population tree and not inferred. Here we propose a framework based on the IICR (Inverse Instantaneous Coalescence Rate). The IICR can be estimated for a single diploid individual using the PSMC method of Li and Durbin (2011). For an isolated panmictic population, the IICR matches the population size history, and this is how the PSMC outputs are generally interpreted. However, it is increasingly acknowledged that the IICR is a function of the demographic model and sampling scheme with limited connection to population size changes. Our method fits observed IICR curves of diploid individuals with IICR curves obtained under piecewise stationary symmetrical island models. In our models we assume a fixed number of time periods during which gene flow is constant, but gene flow is allowed to change between time periods. We infer the number of islands, their sizes, the periods at which connectivity changes and the corresponding rates of connectivity. Validation with simulated data showed that the method can accurately recover most of the scenario parameters. Our application to a set of five human PSMCs yielded demographic histories that are in agreement with previous studies using similar methods and with recent research suggesting ancient human structure. They are in contrast with the view of human evolution consisting of one ancestral population branching into three large continental and panmictic populations with varying degrees of connectivity and no population structure within each continent.


Conflict of interest statement

The authors declare no competing interests.

Figures

Fig. 1
Fig. 1. Flowchart of the validation procedures.
Starting from a parameter space Φ^γ,B we use one of two sampling methods (section “Sampling the parameter space”) to generate a demographic history φ^ defined (for the scaled case) by the parameters (N, n, ti, Mi). We then compute the IICR of that demographic history using one of three methods (section “The three types of target IICRs”) to obtain the target IICR. After that, we run the inference algorithm on this target IICR curve (using wider bounds than those in B) to obtain an estimated (or inferred) demographic history φ^0=(N0,n0,ti0,Mi0), which we then compare to the known φ^ in order to assess the accuracy of the inference methodology (section “Results”).
Fig. 2
Fig. 2. Scatter plots of simulated and inferred parameters.
a Corresponds to scenarios with c = 3 components, and b to scenarios with c = 6 components. The different sub-panels represent the simulated (horizontal axis) versus inferred (vertical axis) parameter values for all the parameters (or a representative selection of parameters in the case of b) of L = 400 unscaled simulated scenarios.
Fig. 3
Fig. 3. Connectivity graphs of 100 independently inferred histories obtained by sampling for each scenario from the values indicated by the dotted lines.
a Scenarios with c = 3 components. b Scenarios with c = 4 components. The right sub-panels show a side histogram with only the inferred migration rates for those components with a specific simulated migration rate (10 for (a) and 1 for (b)).
Fig. 4
Fig. 4. Simulated and inferred IICR plots, connectivity graphs, N and n.
The four panels correspond to four different scenarios. a A c = 3 components scenario. b A c = 4 components scenario. c A c = 5 components scenario. d A c = 5 components scenario. The left part of each panel represents the target and inferred IICRs (top), and the connectivity graphs (down). The right half of each panel shows the simulated and inferred values for n (top) and N (down). In each IICR graph, the ragged blue line represents the target IICR whereas the red lines represent 10 independently inferred IICRs. The vertical blue and red lines are located at the simulated and inferred values of the event times ti, respectively. In the connectivity graphs, the black and green lines represent the simulated and inferred connectivity scenarios, respectively. The simulated n and N values are represented by black circles whereas the inferred values for the corresponding parameters are represented by red and green full circles and by gray histogram bars.
Fig. 5
Fig. 5. Results of performing demographic inference on the French PSMC curve.
a Shows the IICR plot inferred for c = 5 components and a weight parameter of ω = 0.2. The vertical lines represent the inferred times of the demographic events. b Shows the connectivity graph for the same inferred scenario. As a reference point, the connectivity graph of the scenario proposed in Rodríguez et al. (2018) is also shown. The vertical axis in b represent migration rates (M).
Fig. 6
Fig. 6. Results of performing demographic inference on the human PSMC curves.
a Shows the inferred number of islands n and b the inferred reference sizes N for each human population and each used combination of the weight parameter ω and number of components c (only 4 and 5 are shown here). The bars with the darker color, marked ’restricted’ in the legend, correspond to inferences realized with the option of ignoring recent population expansion.
Fig. 7
Fig. 7. Application of our inference method to a tree-like human demographic scenario with three modern populations.
a IICR plots showing the resulting IICR curve of the European population under this model and the inferred IICR curve obtained with our method (where the recent period of human expansion was ignored) for c = 5 components and a weight parameter of ω = 0.25. For reference purposes, we also show the real PSMC curve of the French individual. The gray vertical lines indicate the inferred event times in the C3PO model, and the colored vertical lines the inferred event times by SNIF. b Connectivity graph of the inferred scenario. For reference, we show the inferred event times in the C3PO model as gray vertical lines.
Fig. 8
Fig. 8. Application of our inference method to a generally accepted tree-like human demographic scenario with three modern populations.
a Inferred number of islands for each modern population. b Inferred local size of each island. Shown here are the scenarios with 4 and 5 components c, and all three values of the weight-shifting parameter ω. The bars with the darker color, marked ‘restricted’ in the legend, correspond to inferences realized with the option of ignoring recent population expansion.

Similar articles

Cited by

References

    1. Beaumont M. Recent developments in genetic data analysis: what can they tell us about human demographic history? Heredity. 2004;92(5):365–379. doi: 10.1038/sj.hdy.6800447. - DOI - PubMed
    1. Beaumont MA, Nichols RA. Evaluating loci for use in the genetic analysis of population structure. Proc R SocLond. 1996;263(1377):1619–1626. doi: 10.1098/rspb.1996.0237. - DOI
    1. Beichman AC, Phung TN, Lohmueller KE. Comparison of single genome and allele frequency data reveals discordant demographic histories. G3. 2017;7(11):3605–3620. doi: 10.1534/g3.117.300259. - DOI - PMC - PubMed
    1. Boitard S, Rodríguez W, Jay F, Mona S, Austerlitz F. Inferring population size history from large samples of genome-wide molecular data-an approximate bayesian computation approach. PLoS Genet. 2016;12(3):e1005877. doi: 10.1371/journal.pgen.1005877. - DOI - PMC - PubMed
    1. Cavalli-Sforza LL. Population structure and human evolution. Proc R Soc Lond. 1966;164(995):362–379. - PubMed

Publication types

LinkOut - more resources