. 2021 Jun;17(6):684-692.
doi: 10.1038/s41589-021-00776-9. Epub 2021 Apr 12.

Genome-wide screens uncover KDM2B as a modifier of protein binding to heparan sulfate

Affiliations

Genome-wide screens uncover KDM2B as a modifier of protein binding to heparan sulfate

Ryan J Weiss et al. Nat Chem Biol. 2021 Jun.

Erratum in

Abstract

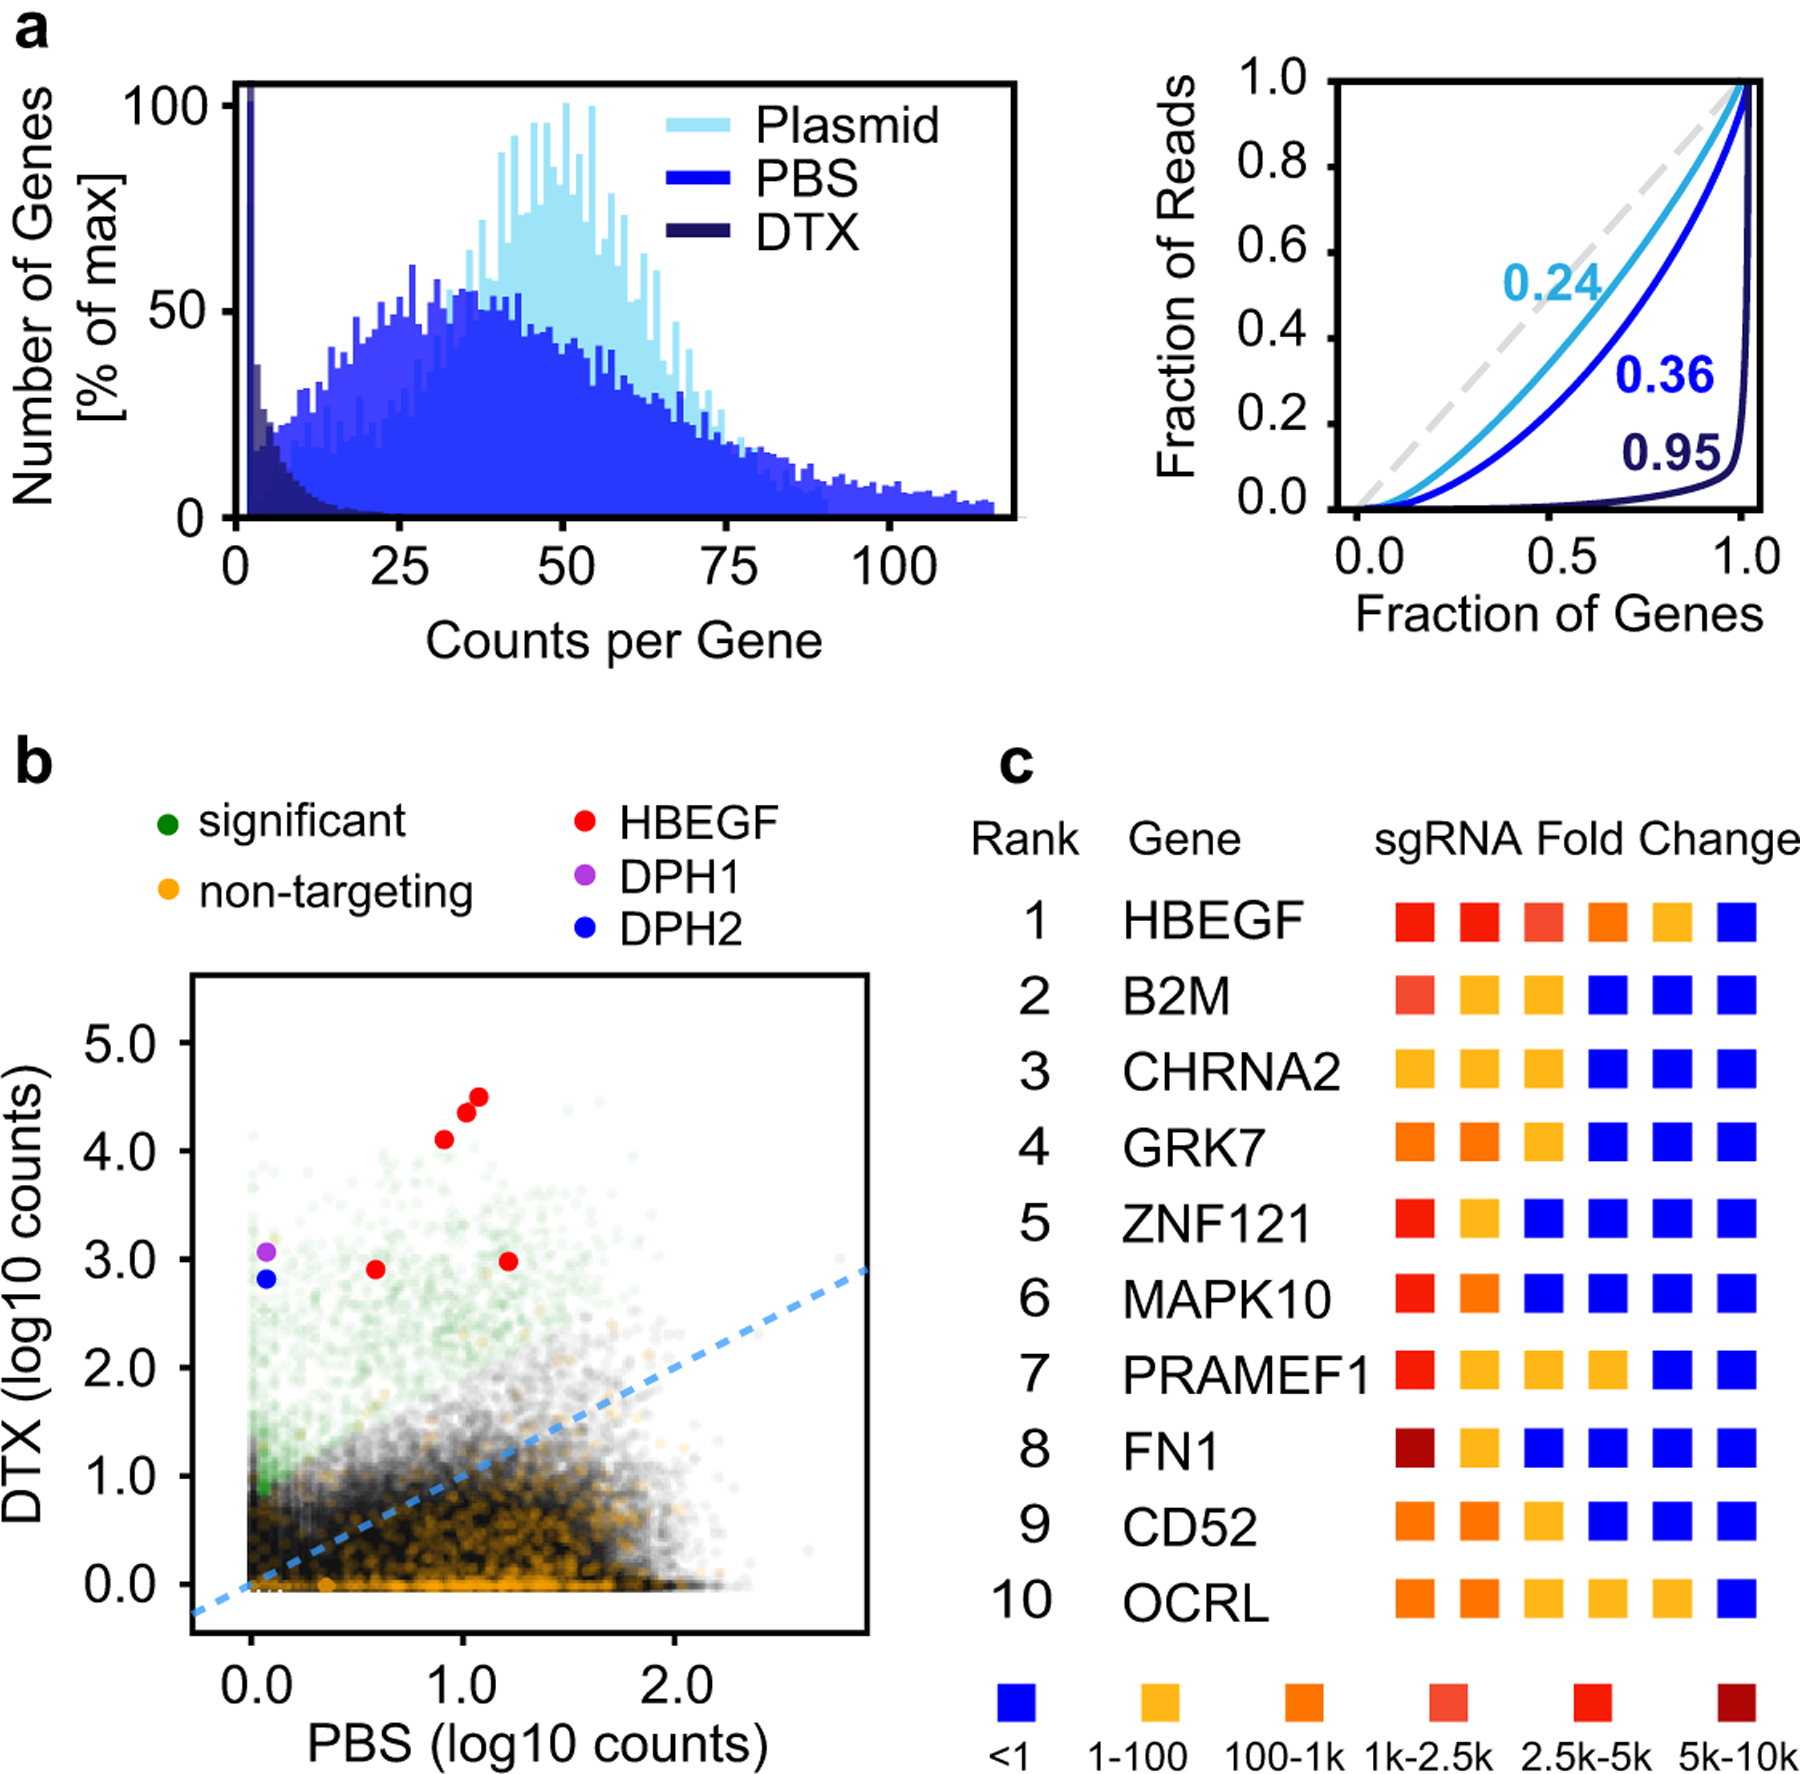
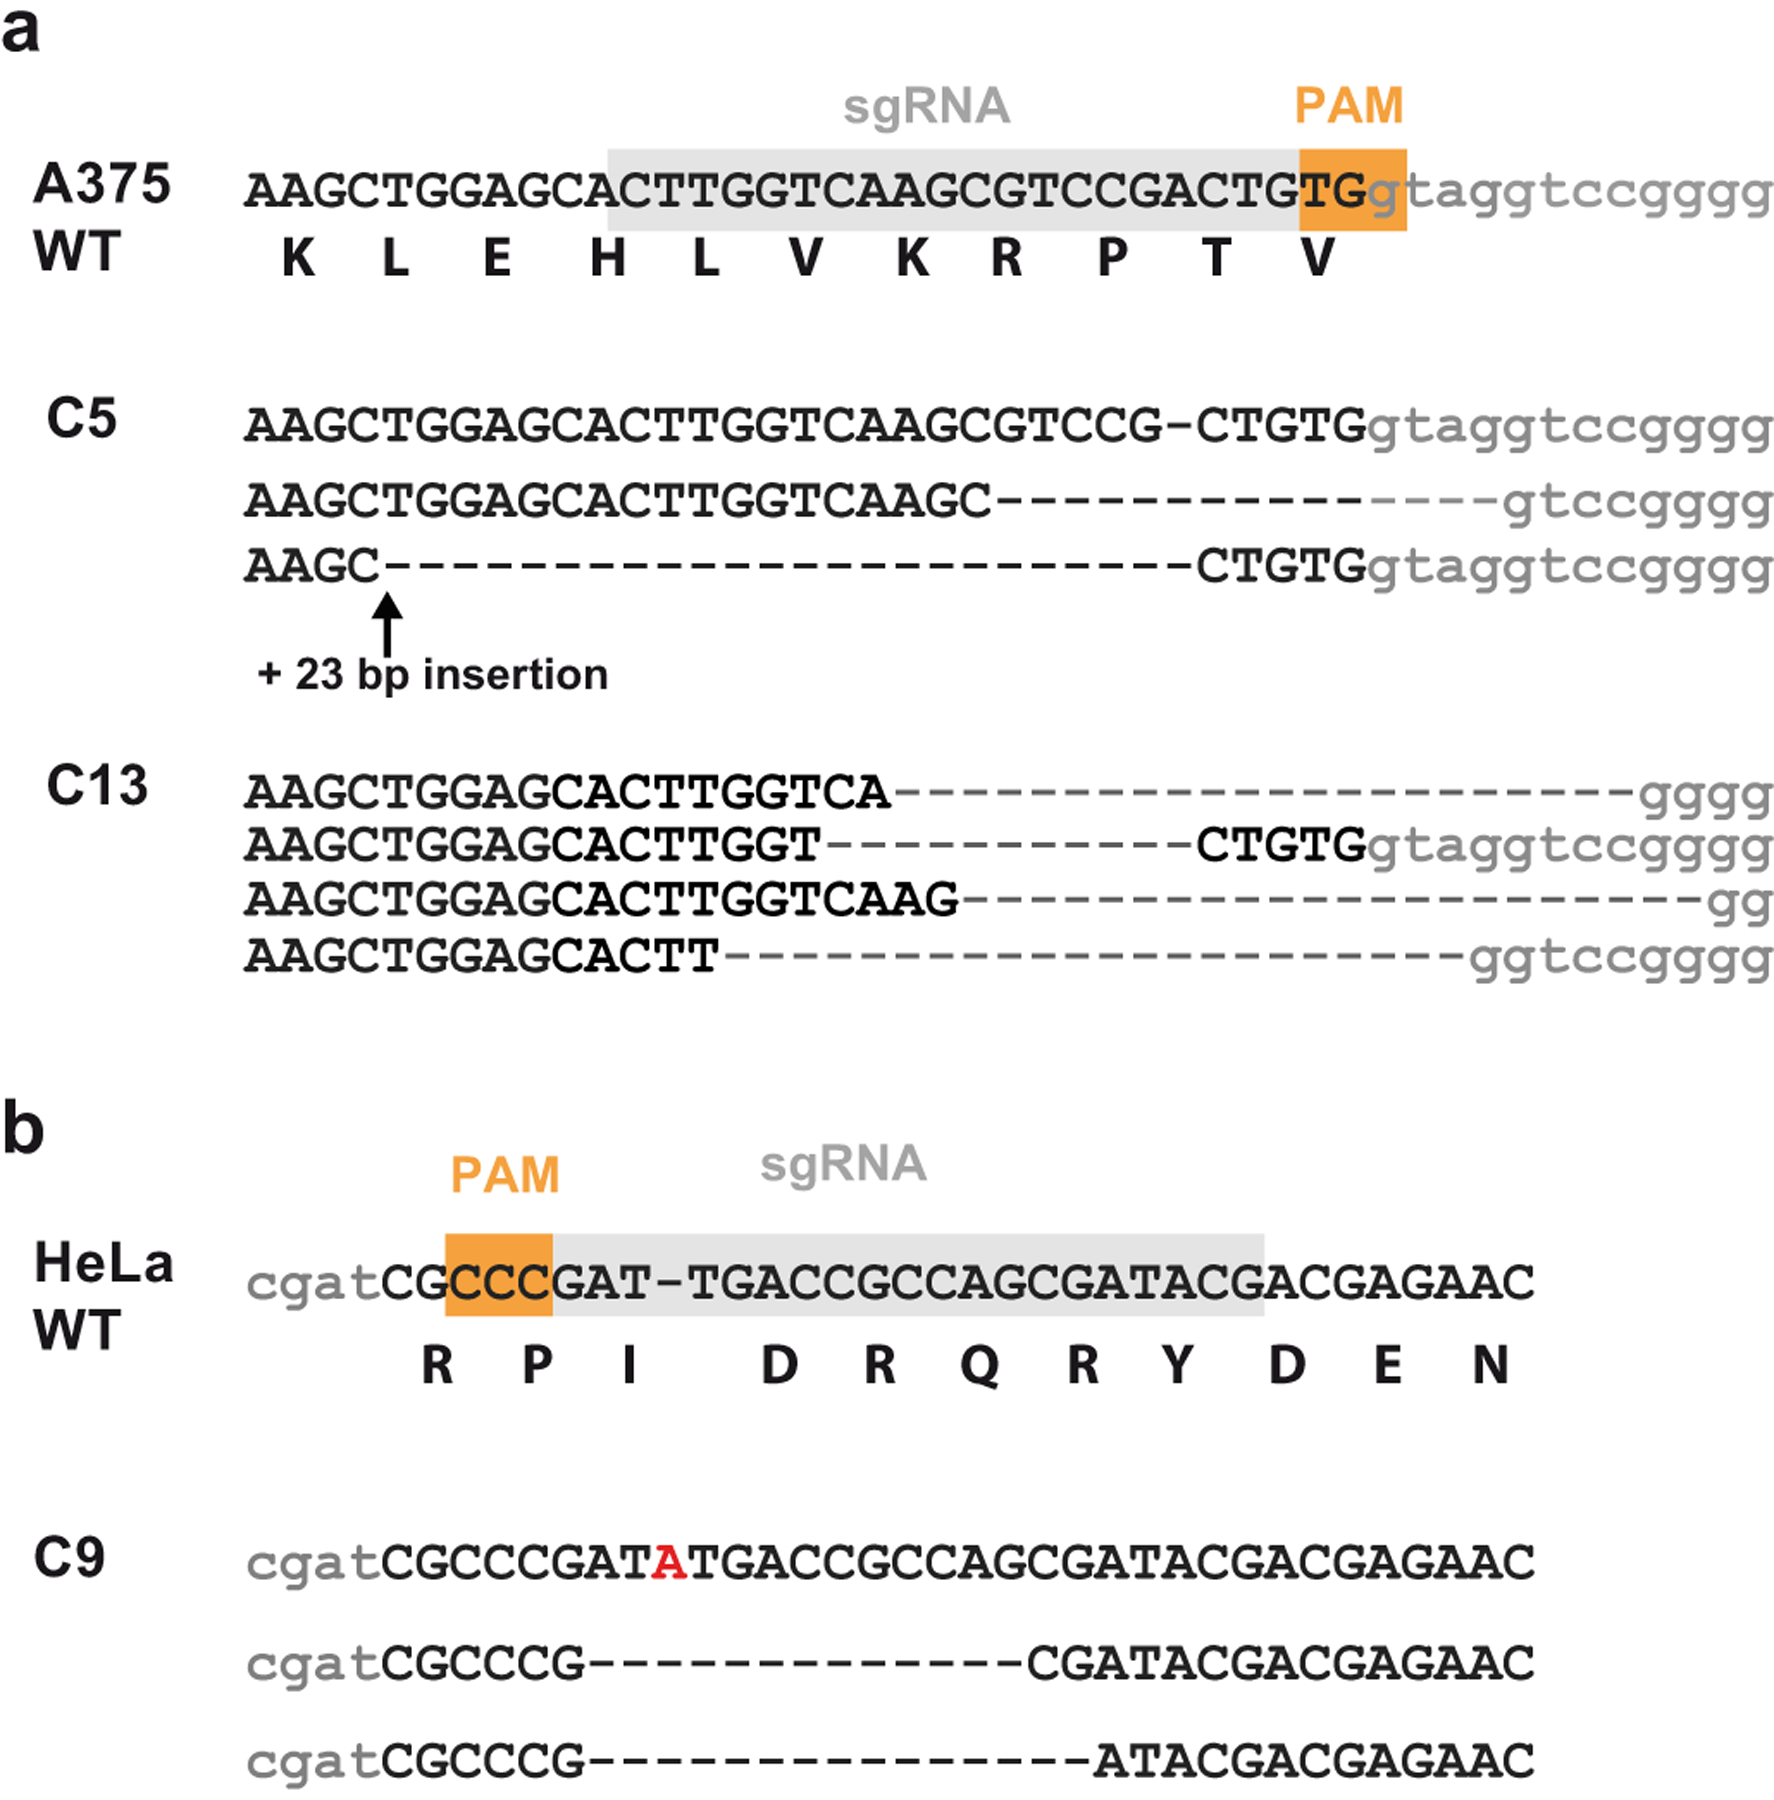
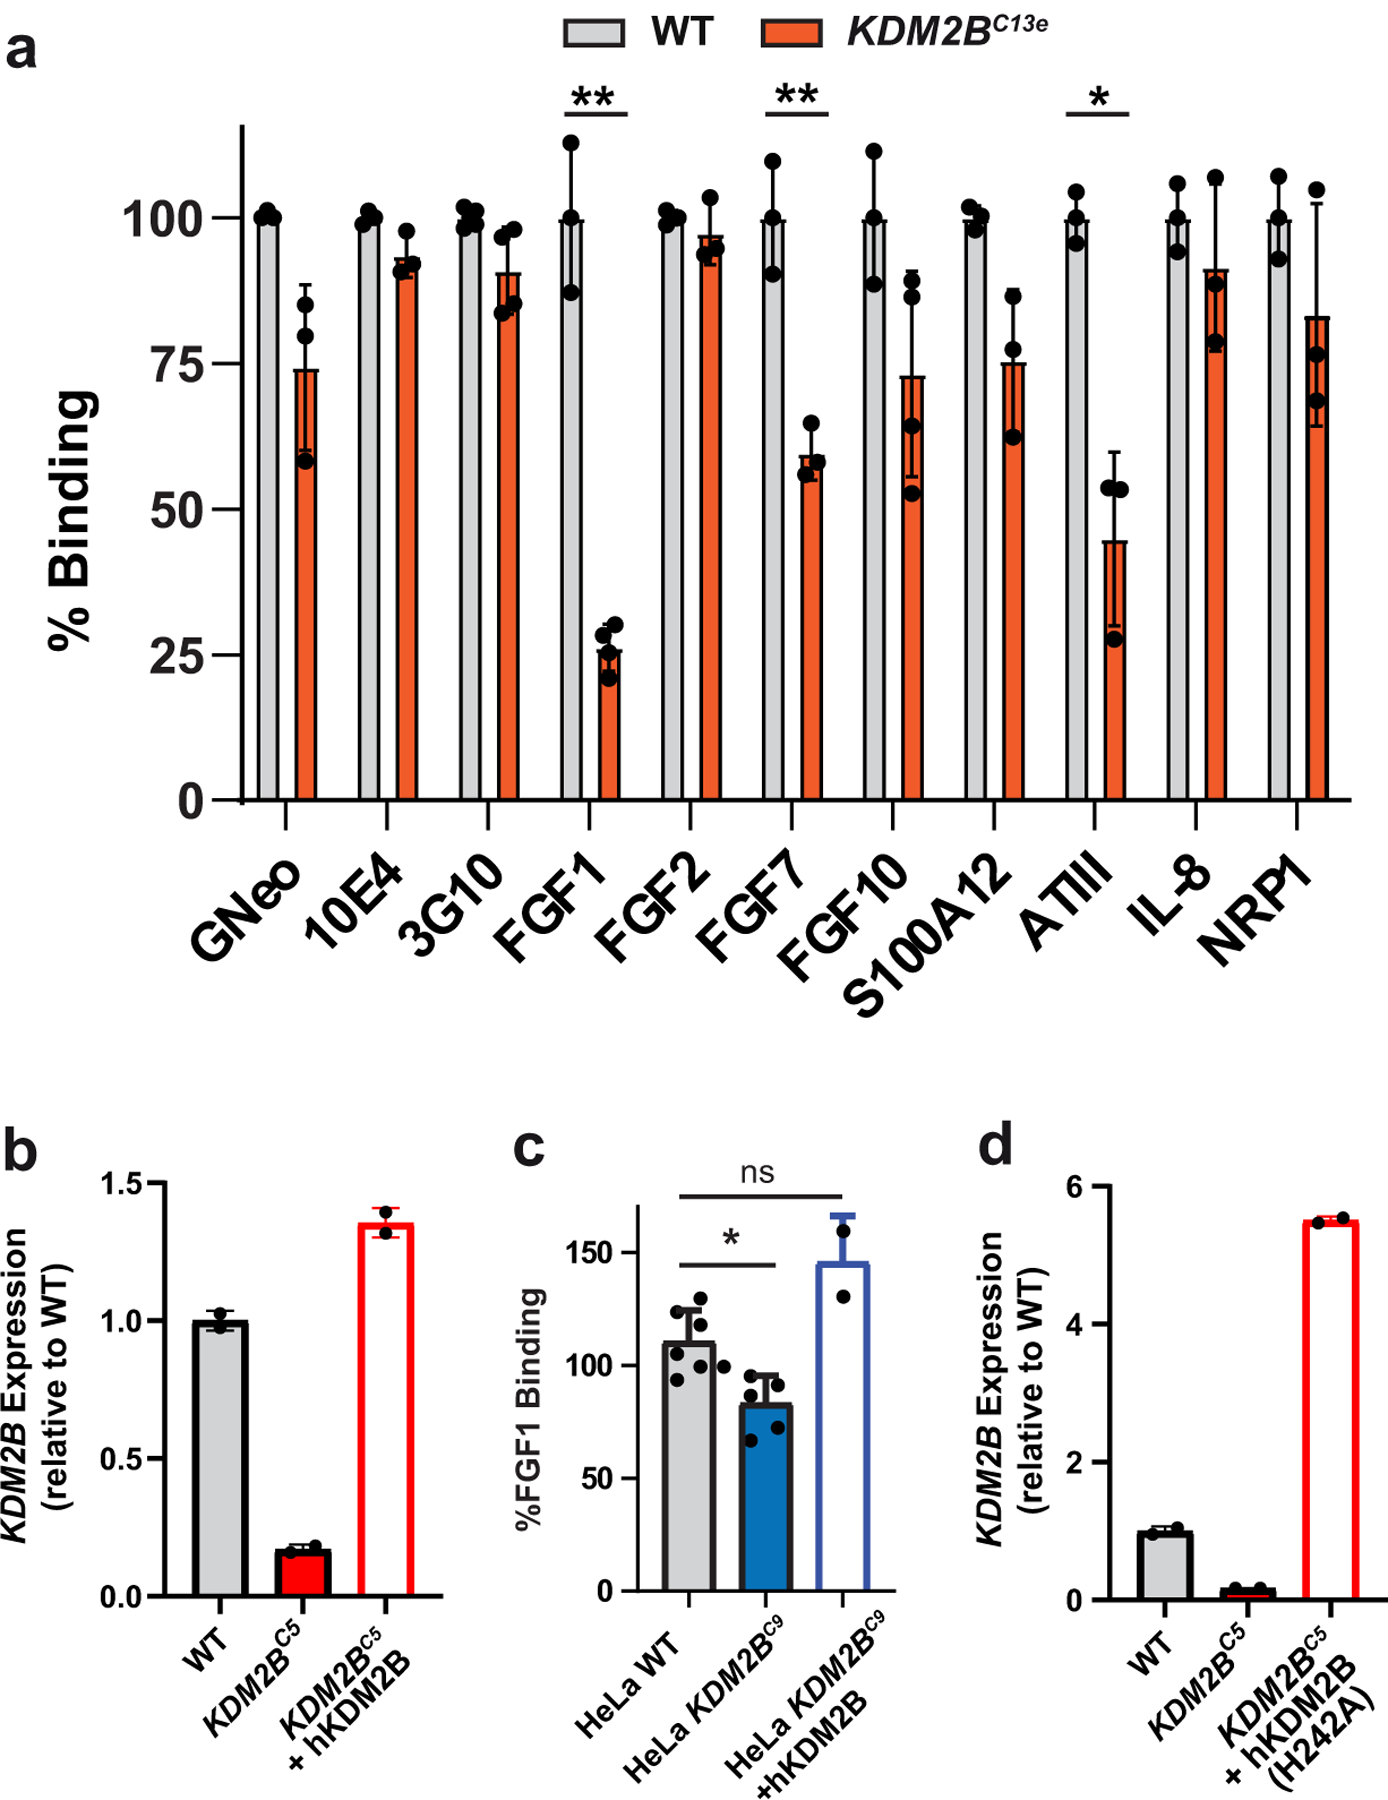
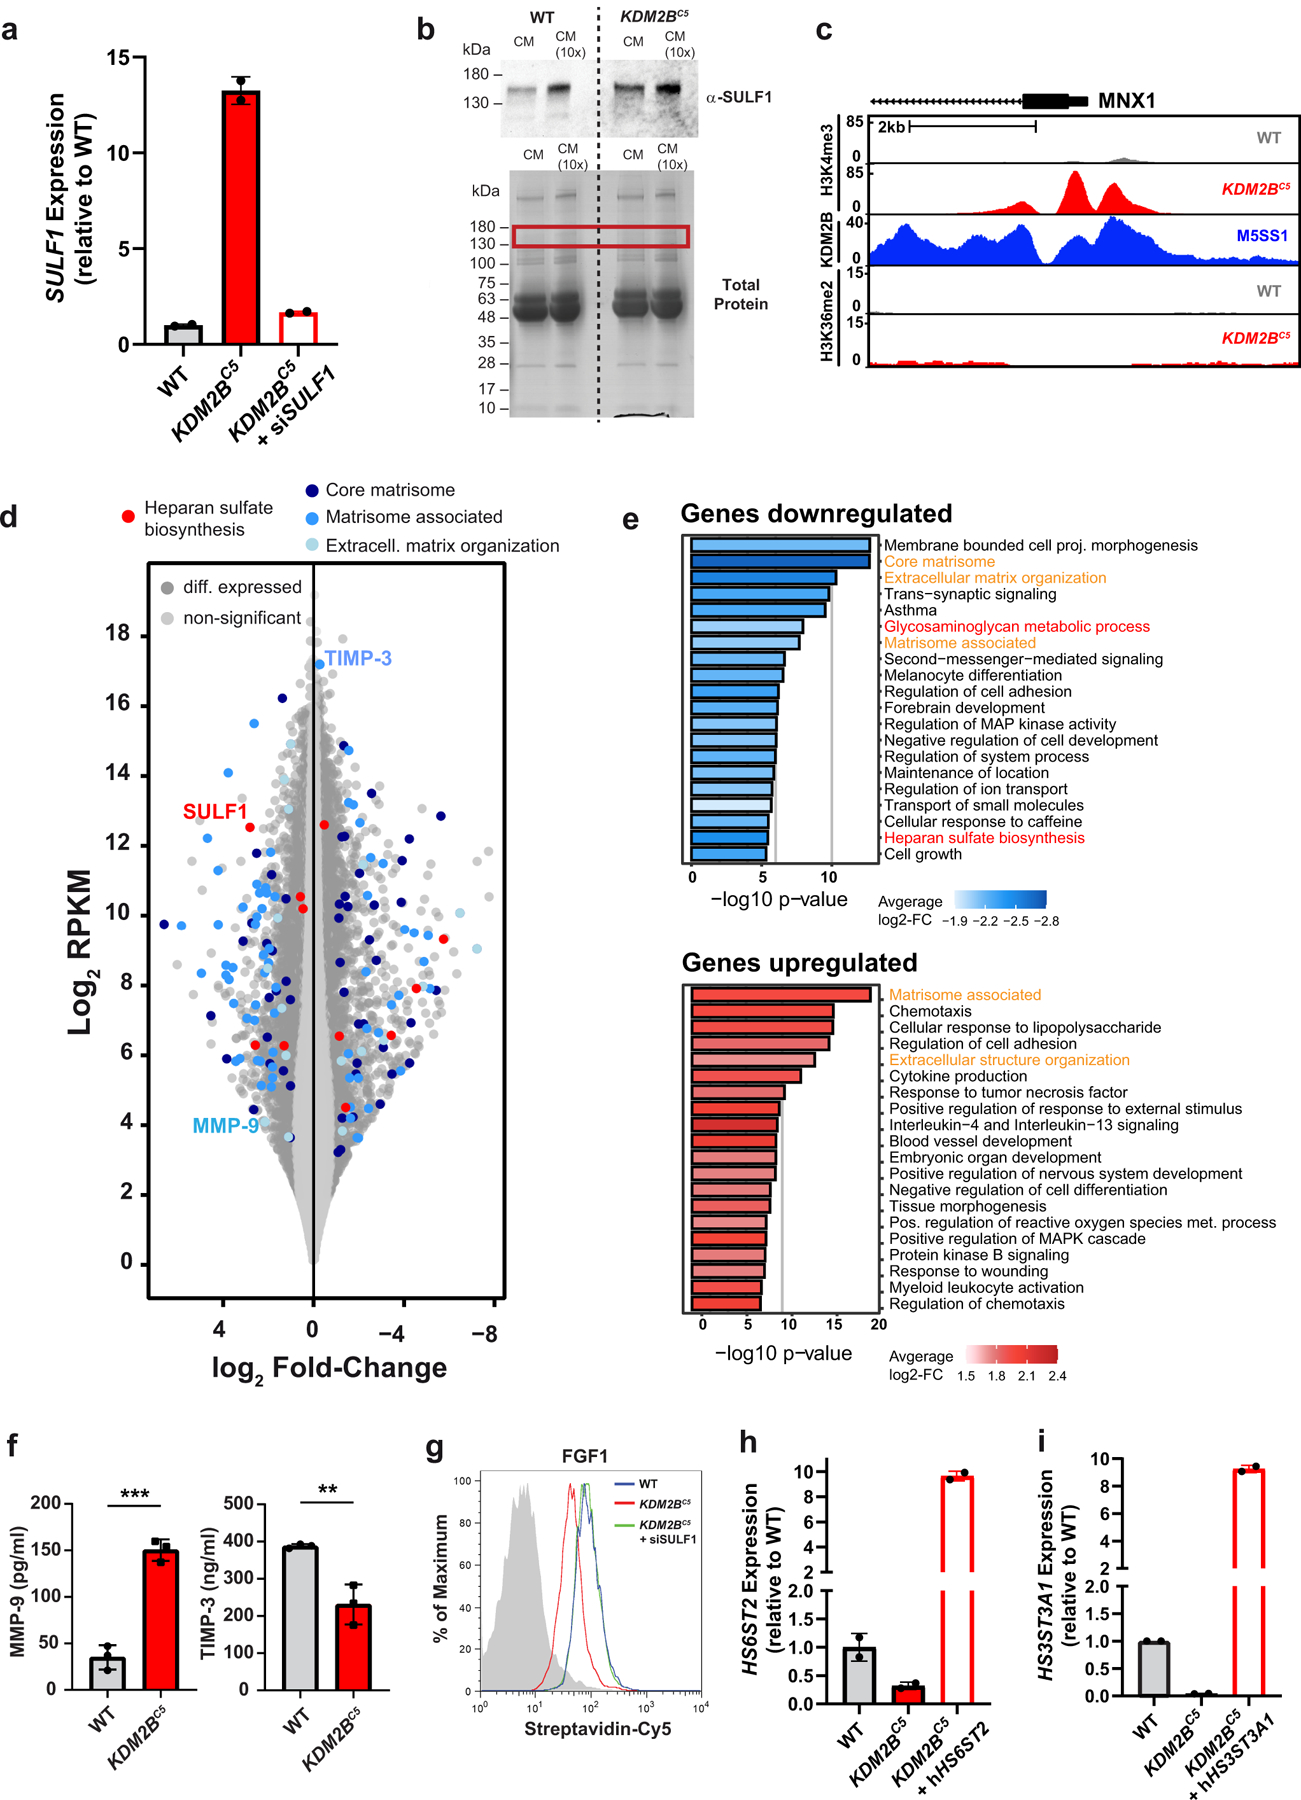
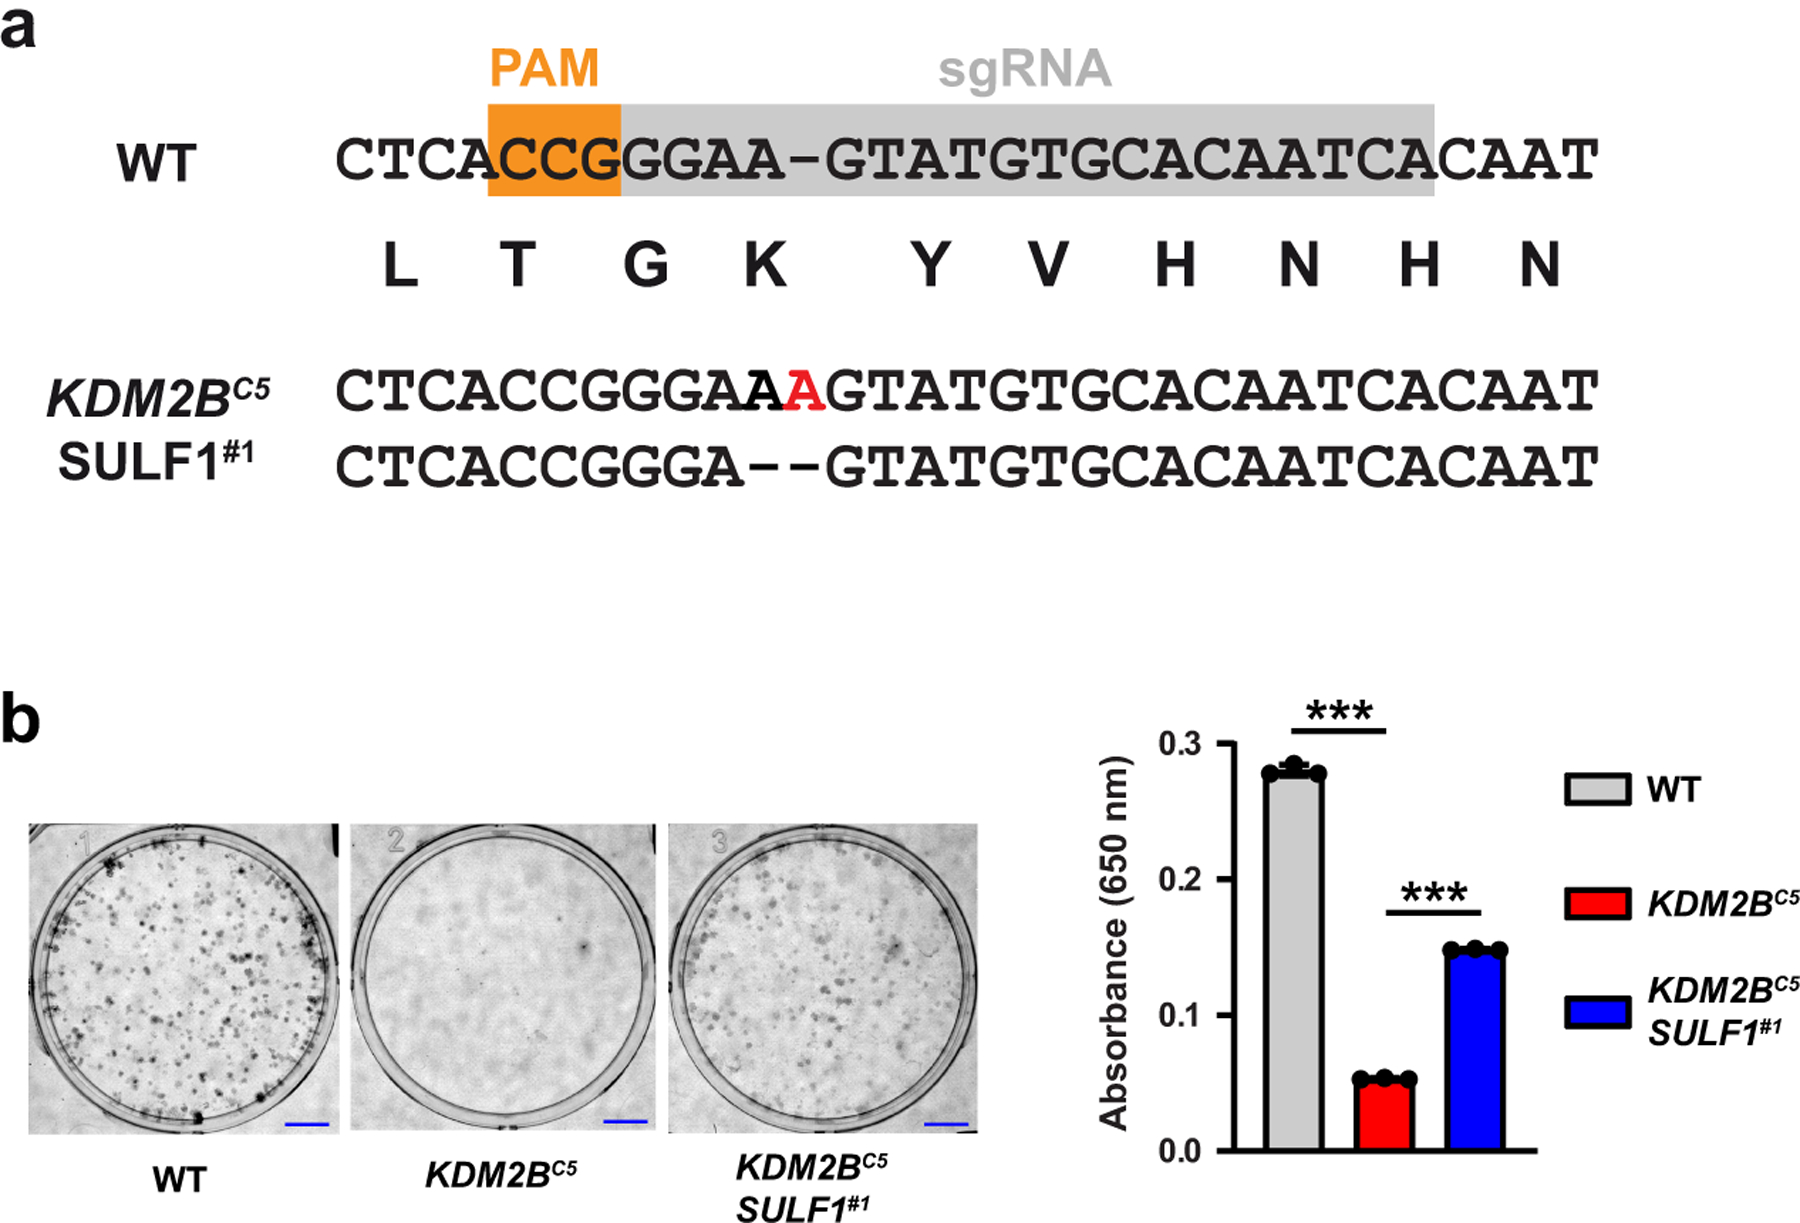
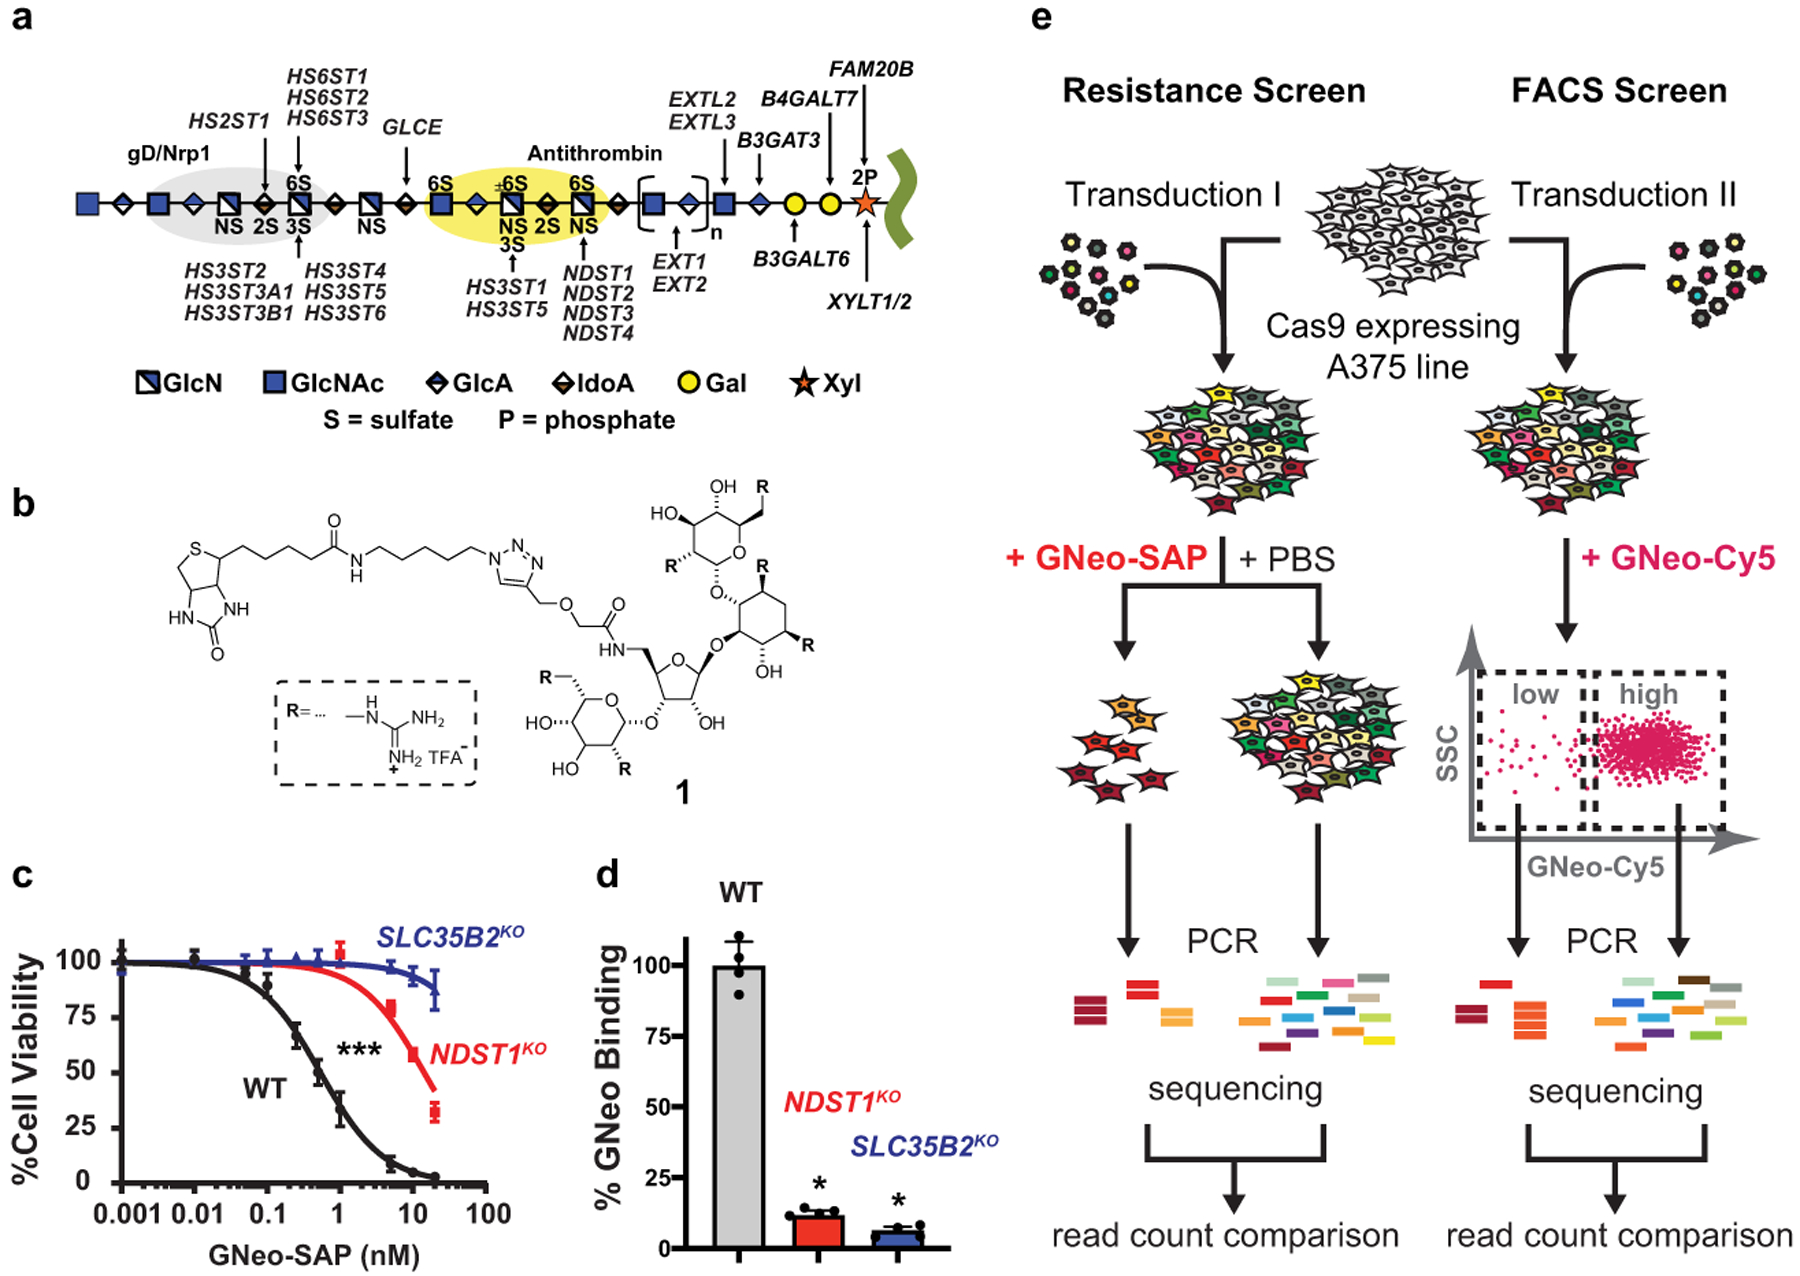
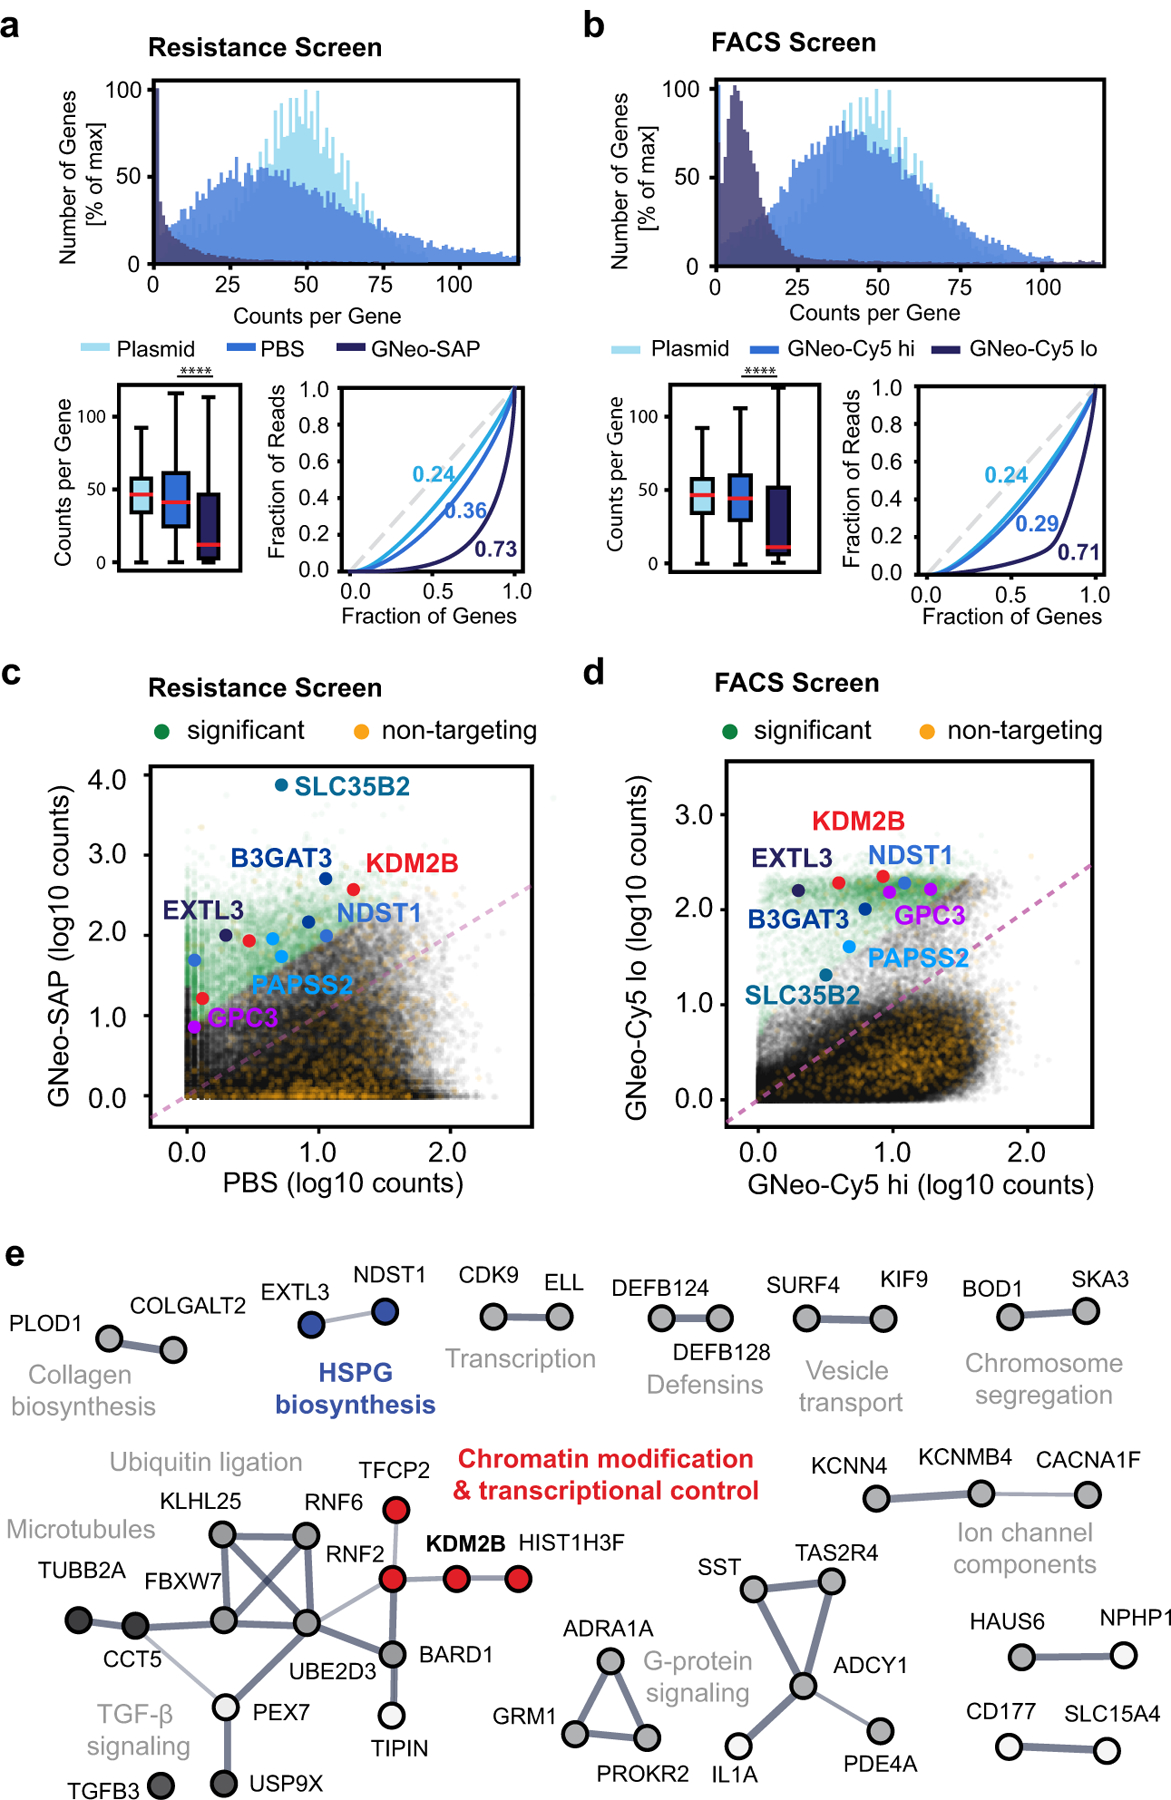
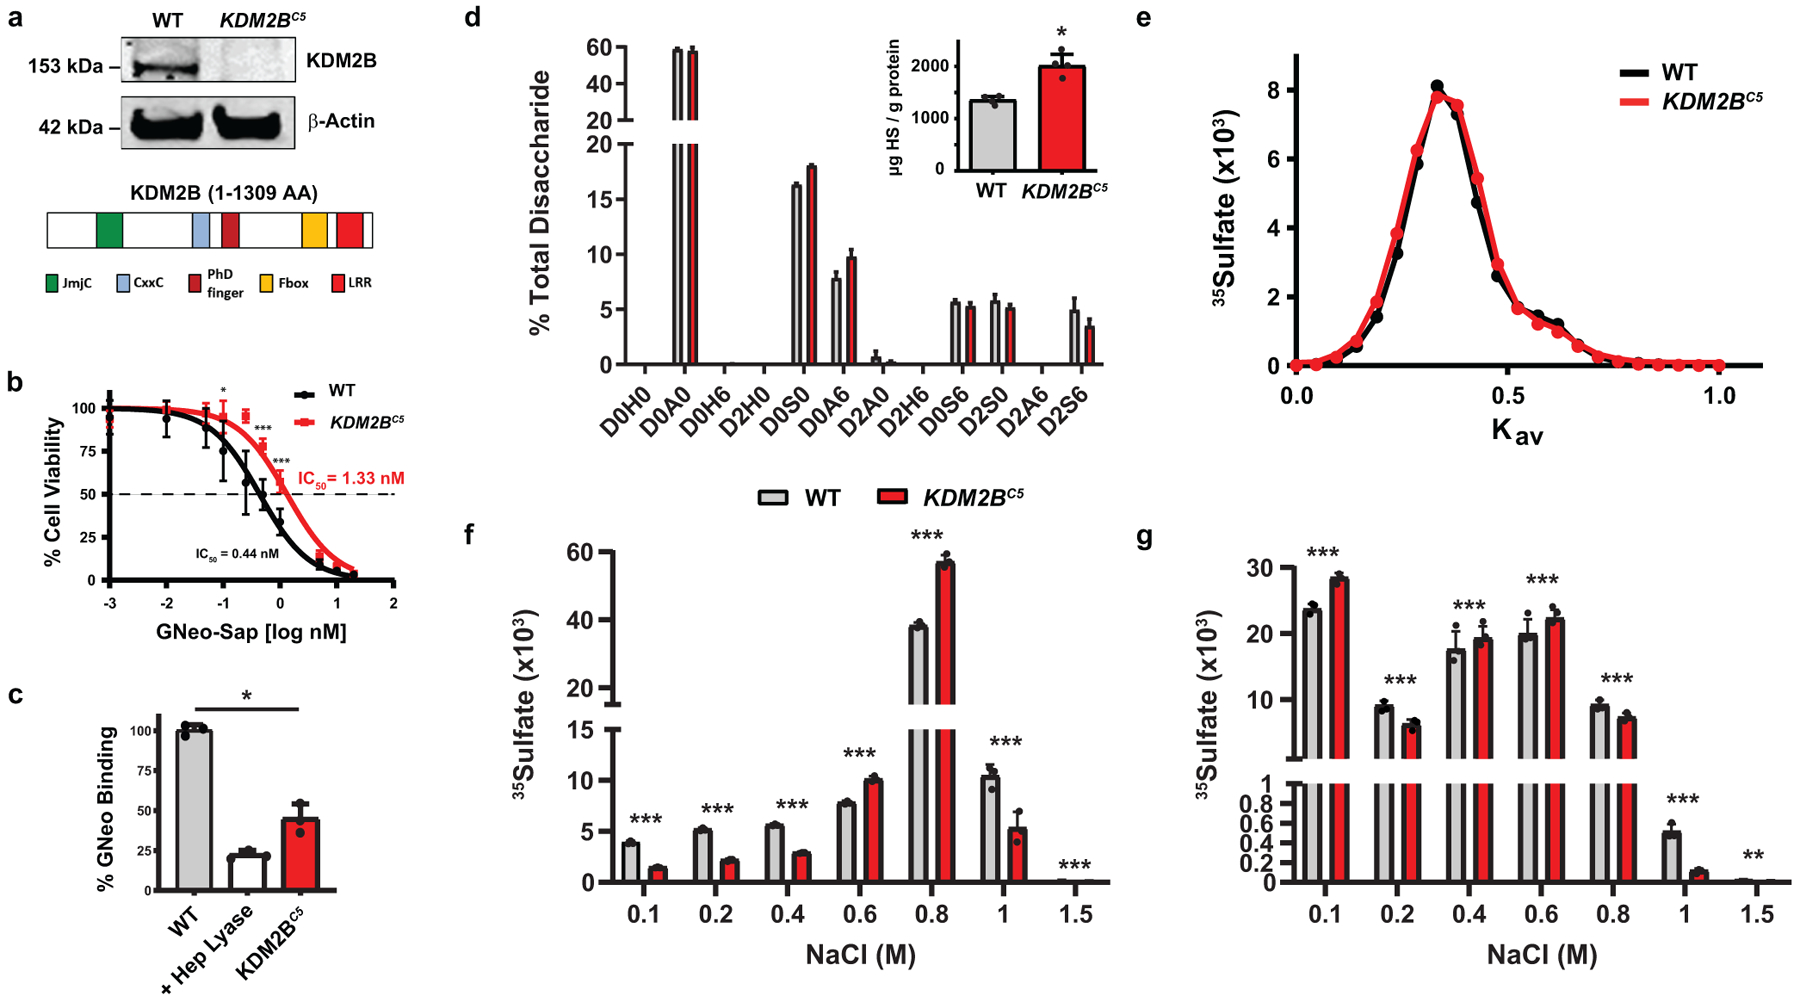
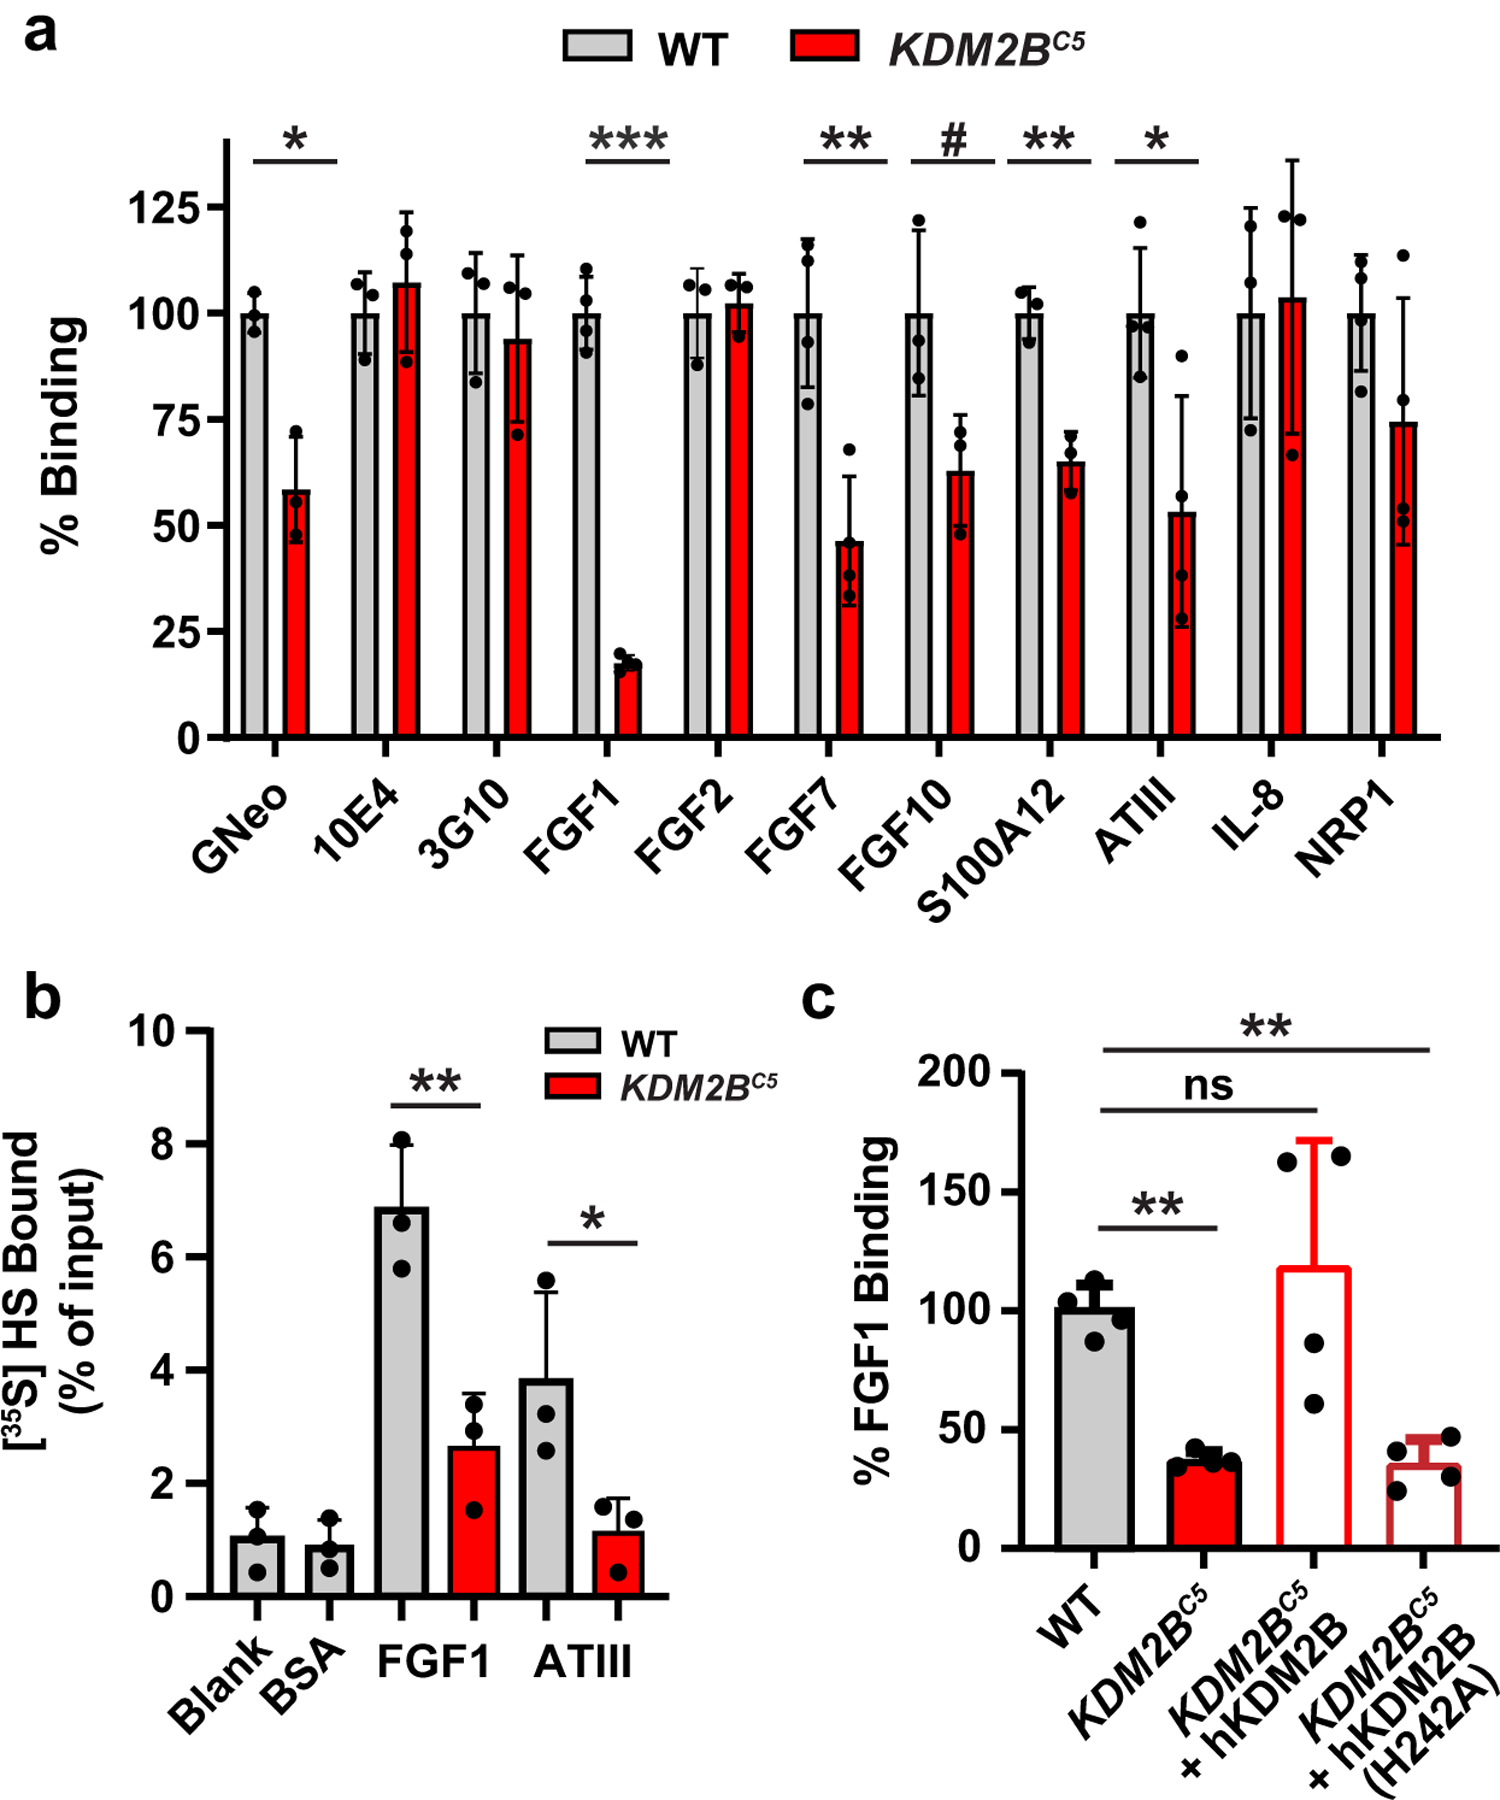
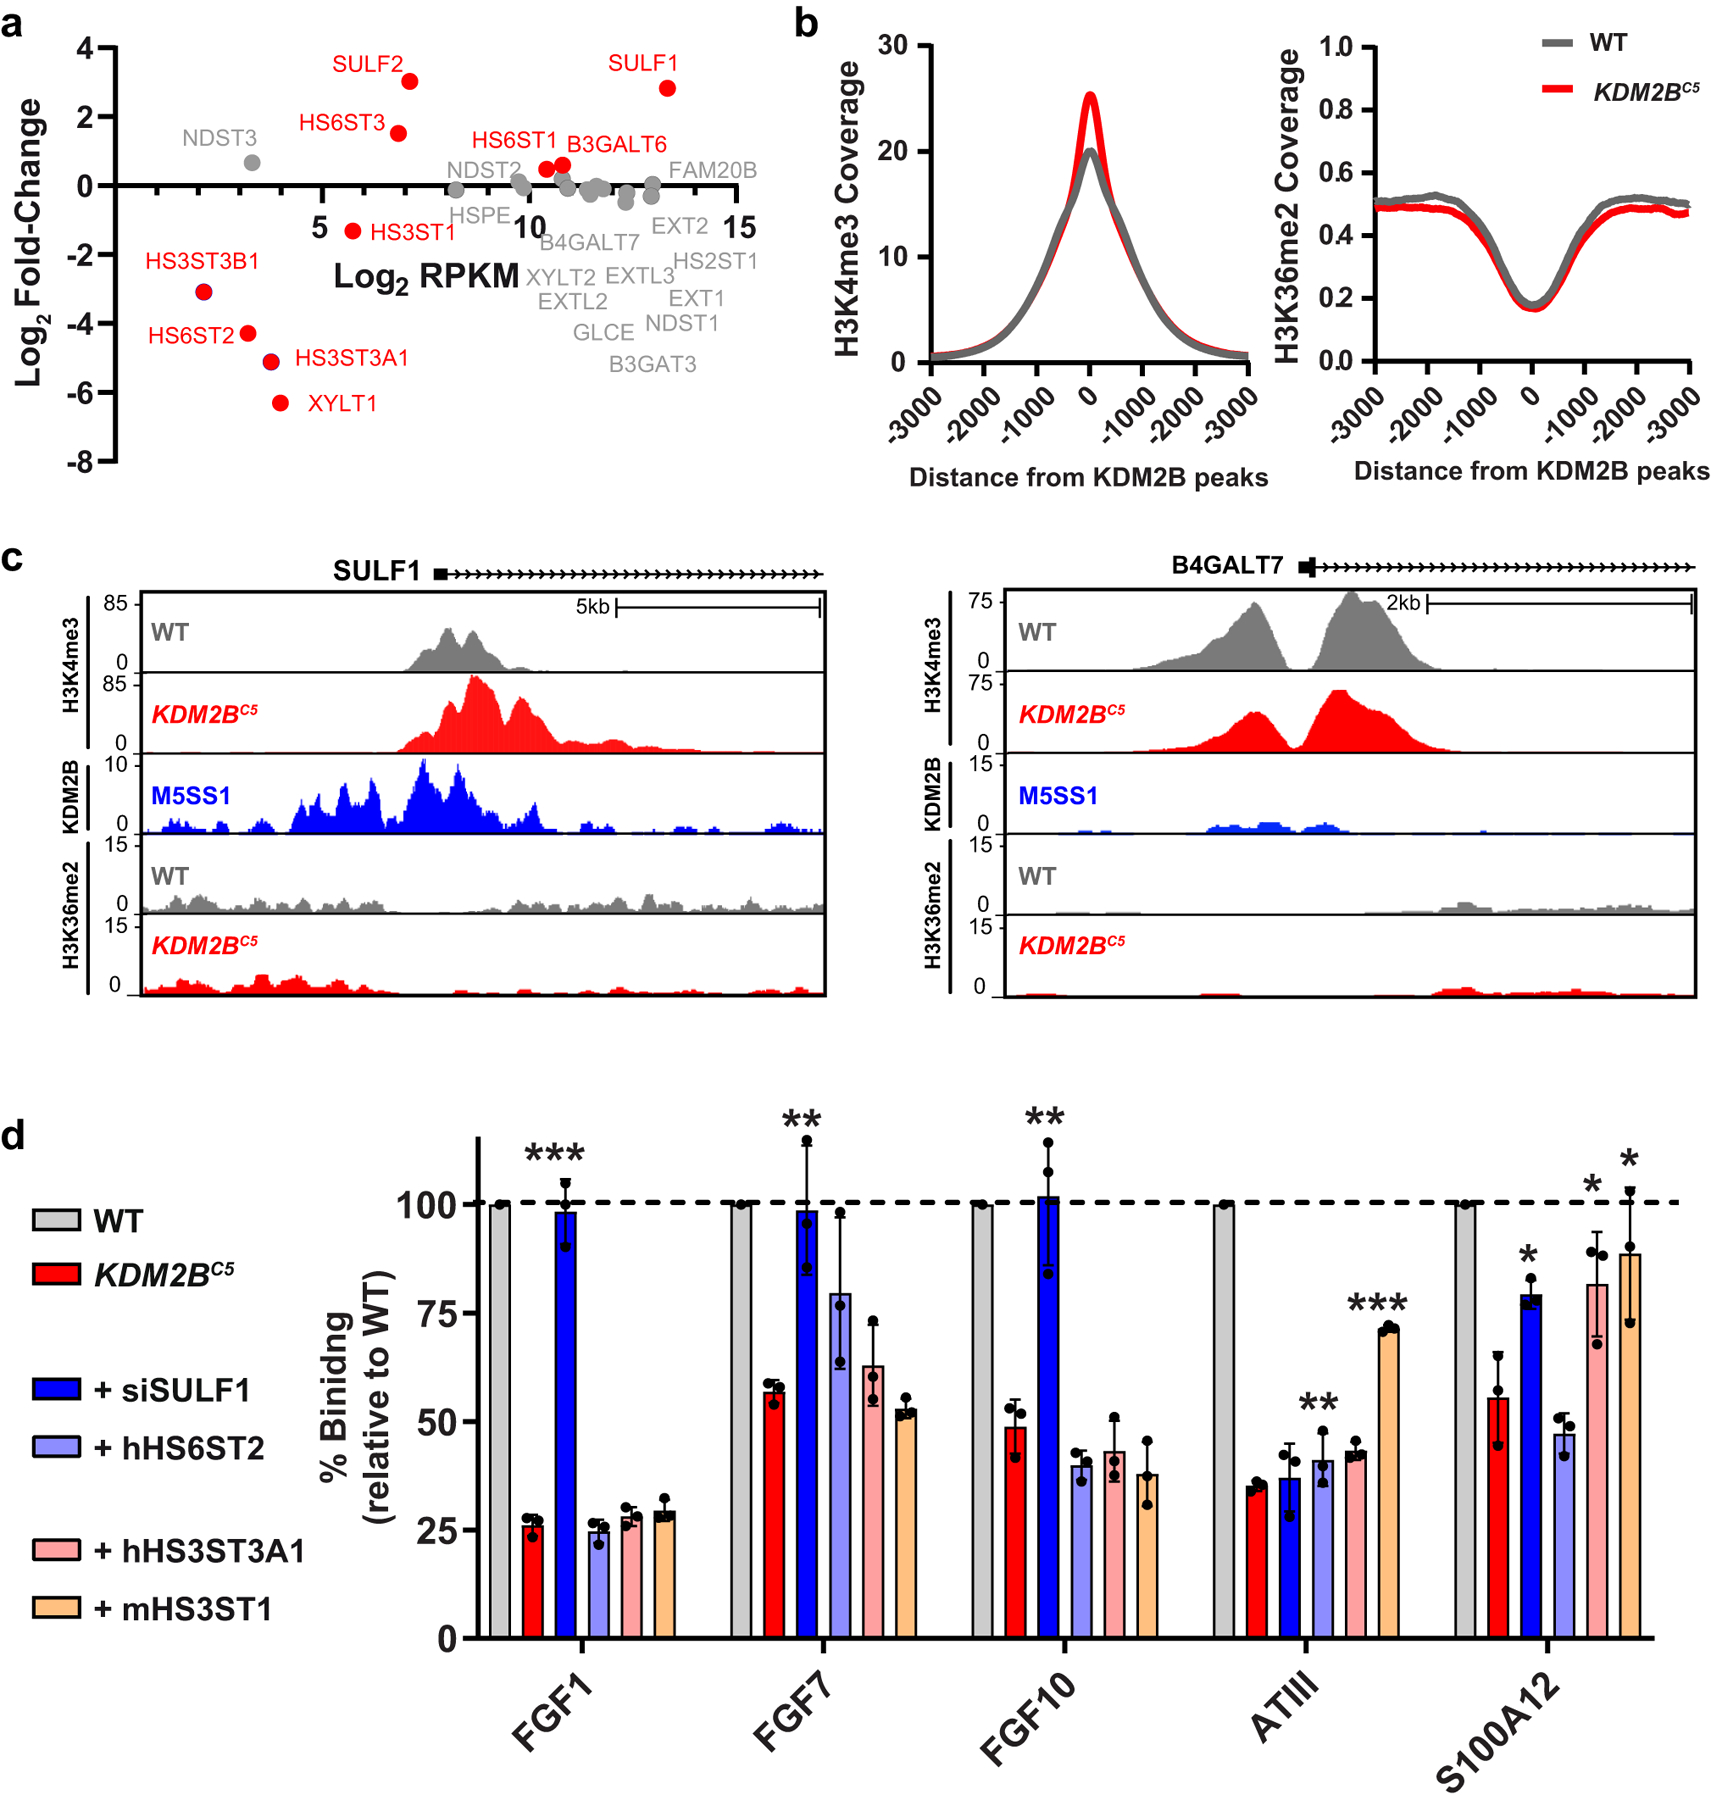
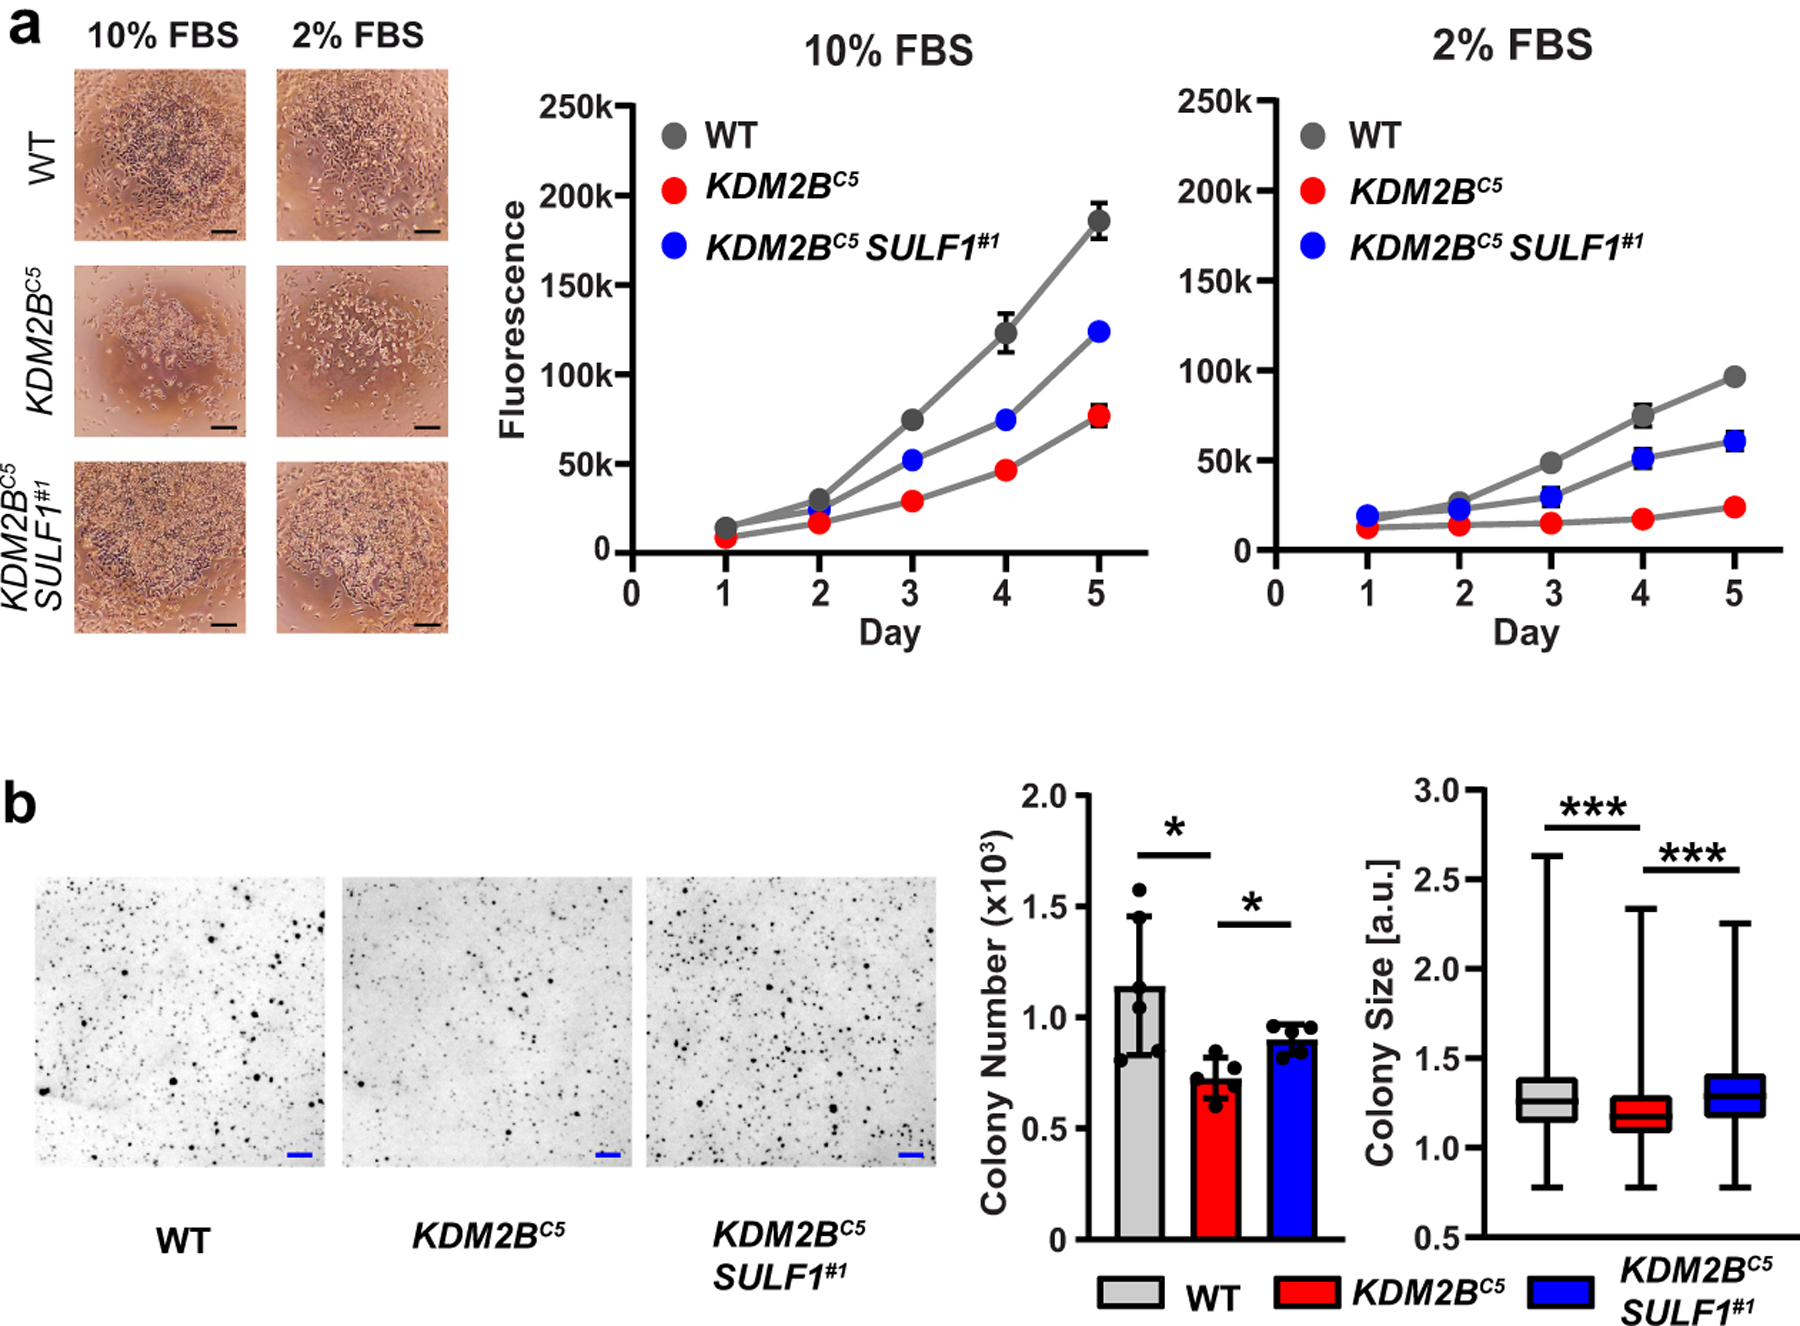
Heparan sulfate (HS) proteoglycans bind extracellular proteins that participate in cell signaling, attachment and endocytosis. These interactions depend on the arrangement of sulfated sugars in the HS chains generated by well-characterized biosynthetic enzymes; however, the regulation of these enzymes is largely unknown. We conducted genome-wide CRISPR-Cas9 screens with a small-molecule ligand that binds to HS. Screening of A375 melanoma cells uncovered additional genes and pathways impacting HS formation. The top hit was the epigenetic factor KDM2B, a histone demethylase. KDM2B inactivation suppressed multiple HS sulfotransferases and upregulated the sulfatase SULF1. These changes differentially affected the interaction of HS-binding proteins. KDM2B-deficient cells displayed decreased growth rates, which was rescued by SULF1 inactivation. In addition, KDM2B deficiency altered the expression of many extracellular matrix genes. Thus, KDM2B controls proliferation of A375 cells through the regulation of HS structure and serves as a master regulator of the extracellular matrix.


Conflict of interest statement

COMPETING INTERESTS

The University of California San Diego and J.D.E. have a financial interest in TEGA Therapeutics, Inc. The terms of this arrangement have been reviewed and approved by the University of California San Diego in accordance with its conflict-of-interest policies.

Figures

Extended Data Fig. 1
Extended Data Fig. 1. A genome-wide screen for resistance to diphtheria toxin.
(a) Left: Frequency distribution of gene counts after treatment with either diphtheria toxin (DTX) or PBS (Plasmid = GeCKO plasmid library). Right: Lorenz curves showing the distribution of sequencing reads over the gene library. Numbers represent Gini coefficients. (b) Scatterplot of sgRNA counts (log10, normalized) in samples after DTX treatment versus PBS treatment. The sgRNA fraction with significant fold-change is shown in green. sgRNA fraction representing non-targeting controls shown in orange. HBEGF-targeting sgRNAs shown in red, and DPH genes are shown in purple and blue. (c) Table of the top 10 ranked genes showing enrichment after DTX treatment. The enrichment level of the six gene-targeting sgRNAs is indicated by color.
Extended Data Fig. 2
Extended Data Fig. 2. KDM2B-deficient cell lines
(a) Sanger sequencing of two A375 KDM2B knockout clones (C5 and C13) and (b) Sanger sequencing of one HeLa knockout clone (C9) after targeting with the indicated sgRNAs. Intron sequence denoted in lower case.
Extended Data Fig. 3
Extended Data Fig. 3. KDM2B affects protein binding.
(a) Protein binding in A375 KDM2B knockout clone C13 (t-tests; n=3). (b) Fold change in KDM2B mRNA expression in A375 KDM2BC5 cells, and in A375 KDM2BC5 cells expressing a KDM2B cDNA from a lentiviral construct (hKDM2B) (n=2). (c) FGF1 binding in HeLa KDM2BC9 cells, and in HeLa KDM2BC9 cells expressing KDM2B cDNA (hKDM2B) (t-test on log10 fluorescence data, n=5). (d) Fold change in KDM2B mRNA expression in A375 KDM2BC5 cells expressing a KDM2B cDNA with a point mutation (H242A) in the demethlase domain (n=2).
Extended Data Fig. 4
Extended Data Fig. 4. Transcriptomic changes in KDM2B-deficient cells.
(a) Fold change in SULF1 mRNA expression in A375 KDM2BC5 cells, and in A375 KDM2BC5 cells expressing a siRNA against SULF1 (n=2). (b) top: Western blot of SULF1 protein levels in conditioned media (CM) collected from A375 wild-type and KDM2BC5 cells (CM 10x equals 10-fold concentrated solution) bottom: Total protein (coomassie-stained gel), red frame indicates position of SULF1. (c) Gene track for H3K4me3, KDM2B, and H3K36me2 ChIP-Seq at the MNX1 locus, a known target of KDM2B. (d) Transcriptome-wide expression data displaying differentially expressed genes in KDM2BC cells compared to wild-type. HS biosynthetic genes and extracellular matrix genes are highlighted. (e) Gene set enrichment analysis of significantly downregulated (log2 ≤ −0.5, p ≤ 0.05; FDR-corrected) and upregulated (log2 ≥ 0.5, p ≤ 0.05; FDR-corrected) genes in A375 wild-type and KDM2BC5 RNA-Seq datasets (n=3). (f) MMP-9 and TIMP-3 levels in the supernatant from cultured A375 wild-type and KDM2BC5 cells (t-test, n=3). (g) Histograms showing FGF1 binding in A375 wild-type, KDM2BC5 cells, and in KDM2BC5 cells upon treatment with an siRNA targeting SULF1. (h) Fold change in HS6ST2 mRNA expression in A375 KDM2BC5 cells, and in A375 KDM2BC5 cells expressing a HS6ST2 cDNA from a lentiviral construct (hHS6ST2) (n=2). (i) Fold change in HS3ST3A1 mRNA expression in A375 KDM2BC5 cells, and in A375 KDM2BC5 cells expressing a HS3ST3A1 cDNA from a lentiviral construct (hHS3ST3A1) (n=2).
Extended Data Fig. 5
Extended Data Fig. 5. KDM2B affects cell growth through SULF1.
(a) Sanger sequencing of a A375 KDM2B SULF1 double knock-out clone (KDM2BC5 SULF1#1) after targeting with the indicated sgRNA. Both sequence changes result in frameshift mutations. (b) Clonogenic assay under normal growth conditions. After 14 days, colony growth was quantified by methylene blue staining and absorption readings at 650 nm (t-test, n=3). Scale bar = 5 mm.
Fig. 1.
Fig. 1.. Finding novel regulators of heparan sulfate biosynthesis through genome-wide screens.
(a) Heparan sulfate (HS) assembles while attached via a tetrasaccharide to a core proteoglycan protein. NDSTs, HS2ST, HS3STs and HS6STs install sulfate groups at specific sites along the HS chain and an epimerase (GLCE) converts d-glucuronic acid to l-iduronic acid. The chain is rendered according the Symbol Nomenclature for Glycans. (b) Guanidinylated neomycin (GNeo) is as a highly selective ligand for HS. (c) Treatment of A375 WT, NDST1 mutant, and SLC35B2 mutant cell lines with increasing concentrations of GNeo-Saporin. NDST1 N-deacetylates subsets of N-acetylglucosamine units and adds N-sulfate to the glucosamine residues, which is required for GNeo binding. SLC35B2 is a Golgi transporter for 3′-phosphoadenosine-5′-phosphosulfate (PAPS), which is the high energy sulfate donor for sulfation of HS and other GAGs (Kruskal-Wallis-test on combined dataset, n=4). (d) Flow cytometry analysis of WT, NDST1 mutant, and SLC35B2 mutant cell lines after incubation with GNeo-biotin conjugated to streptavidin-Cy5 (Mann-Whitney test, n=4). (e) A375 cells, stably expressing Cas9, were transduced with the genome-wide GeCKO sgRNA library and subjected to a screen for resistance against GNeo-saporin (left) and a screen for low GNeo-Cy5 binding (right). For details see Online Methods.
Fig. 2.
Fig. 2.. Sequencing data analysis of CRISPR/Cas9 screens selecting for regulators of HS biosynthesis.
(a) Top: Frequency distribution of gene counts after treatment with either 10 nM GNeo-Saporin or PBS (Plasmid = GeCKO v2 plasmid library). Bottom left: Boxplots showing the gene count distribution for each sample (Kolmogorov-Smirnov-Test; n=21,915; Boxplot whiskers showing 5% and 95% percentiles, outliers omitted for clarity). Bottom right: Lorenz curves showing the distribution of sequencing reads over the gene library. Numbers represent Gini coefficients (0: reads cover gene library evenly, 1: reads cover only a single gene). (b) Left: Frequency distribution of gene counts after incubation with GNeo-Cy5 and collecting both the low and the high binding cell fractions (Plasmid = GeCKO v2 plasmid library). Bottom left: Boxplots showing the gene count distribution for each sample (Kolmogorov-Smirnov-Test; n=21,915; Boxplot whiskers showing 5% and 95% percentiles, outliers omitted for clarity). Bottom right: Lorenz curves showing the distribution of sequencing reads over the gene library. Numbers represent Gini coefficients. (c) Scatterplot of sgRNA counts (log10, normalized) in samples recovered after GNeo-Saporin treatment versus PBS treatment. (d) Scatterplot of sgRNA counts (log10, normalized) in the low binding versus the high binding cell fraction after incubation with GNeo-Cy5. In (c) and (d), the sgRNA fraction with significant fold-change is shown in green, and the sgRNA fraction representing non-targeting controls is shown in orange. The most significantly enriched sgRNAs targeting HS enzymes or solute carriers required for HS biosynthesis are captioned. (e) Protein-protein interaction network of top enriched targets in the GNeo-Saporin and the GNeo-Cy5 screens. Line width indicates the confidence level of the interaction. Proteins without direct interactions with other proteins from the list were omitted for clarity. See Supplementary Data Set 5 for full list.
Fig. 3.
Fig. 3.. Structural analysis of cell surface heparan sulfate in KDM2B mutant cells.
(a) Western blot of CRISPR-mediated inactivation of KDM2B in A375 cells and protein domains of human KDM2B. (b) Cell Titer Blue assay showing increased resistance to GNeo-Saporin (GNeo-SAP) conjugate over a wide concentration range (0–20 nM) (Mann-Whitney test, n=8). (c) Decreased cell surface binding of GNeo-biotin-streptavidin-Cy5 to KDM2BC cells compared to wild-type cells. A375 cells pre-treated with heparin lyases (I-III) were used as a positive control (t-test on log10 fluorescence data, n=3). (d) LC-MS quantification of disaccharides from HS in wild-type and KDM2BC cells (z-test with absolute quantities in pmol; n=3). The absolute values for the disaccharides and the different classes of disaccharides are shown in Supplementary Table 1. The disaccharide structure code is described in Supplementary Table 1 and. (inset) LC-MS quantification of total HS in wild-type and KDM2BC5 cells (Mann-Whitney test, n=3). (e) Gel filtration chromatography (Sepharose CL-6B) of [35S]HS from wild-type and KDM2BC cells. (f) [35S]HS was fractionated over a GNeo affinity column (0.1–1.5 M NaCl) (Poisson C-test, n=3). (g) [35S]HS was digested with heparin lyase III (10 mU) overnight at 37°C prior to fractionation over a GNeo affinity column (Poisson C-test, n=3).
Fig. 4.
Fig. 4.. Binding of growth factors and other heparan sulfate binding proteins to KDM2B mutant cells.
(a) KDM2BC5 cells show a significant decrease in binding of a subset of protein ligands (t-test on log10 fluorescence data, n=3). (b) Filter binding assays show decreased binding of FGF1 and antithrombin (ATIII) to [35S]HS from KDM2BC5 cells (t-test, n=3). (c) Re-introduction of wild-type KDM2B cDNA, but not a KDM2B catalytic mutant (H242A), restored binding of FGF1 in A375 (t-test on log10 fluorescence data, n=4).
Fig. 5.
Fig. 5.. Transcriptome and ChIP Analysis of KDM2B mutant cells.
(a) mRNA expression of HS biosynthetic enzymes and HS modifying enzymes from RNA-seq (differentially expressed genes shown in red). RPKM is “Reads Per Kilobase of transcript per Million mapped reads”. (b) H3K4me3 and H3K36me2 ChIP-Seq signals normalized by input sample in WT and KDM2BC5 cells at KDM2B-occupied genomic regions (GSE108929). (c) Gene track for H3K4me3, KDM2B, and H3K36me2 ChIP-Seq at the SULF1 and B4GALT7 loci. (d) Ligand binding of KDM2BC5 cells transfected with indicated expression plasmids (hHS6ST2/hHS3ST3A1/mHS3ST1) or an siRNA targeting SULF1 relative to mock-transfected wild-type cells (t-test, n=3).
Fig. 6.
Fig. 6.. KDM2B inactivation results in a SULF1-dependent decrease in cell growth.
(a) Viable cell density was monitored by Cell Titer Blue over five days under normal (10% FBS) and low serum (2% FBS) conditions (p<0.001. Two-way ANOVA; n=3). Images taken 48h after seeding. Scale bar = 100 μm. (b) Anchorage-independent growth was analyzed by soft agar assays. Colony number and size were measured after 11 days incubation (colony number: t-test, n=5; colony size: t-test on pooled dataset, n=3,000). Scale bar = 1 mm.

Similar articles

Cited by

References

    1. Xu D & Esko JD Demystifying heparan sulfate-protein interactions. Annu Rev Biochem 83, 129–57 (2014). - PMC - PubMed
    1. Bishop JR, Schuksz M & Esko JD Heparan sulphate proteoglycans fine-tune mammalian physiology. Nature 446, 1030–1037 (2007). - PubMed
    1. Esko JD & Selleck SB Order out of chaos: Assembly of ligand binding sites in heparan sulfate. Annu Rev Biochem 71, 435–471 (2002). - PubMed
    1. Presto J et al. Heparan sulfate biosynthesis enzymes EXT1 and EXT2 affect NDST1 expression and heparan sulfate sulfation. Proc Natl Acad Sci USA 105, 4751–6 (2008). - PMC - PubMed
    1. Kreuger J & Kjellen L Heparan sulfate biosynthesis: regulation and variability. J Histochem Cytochem 60, 898–907 (2012). - PMC - PubMed

Publication types

MeSH terms