. 2021 May;53(5):707-718.
doi: 10.1038/s41588-021-00828-9. Epub 2021 Apr 12.

Minor intron retention drives clonal hematopoietic disorders and diverse cancer predisposition

Affiliations

Minor intron retention drives clonal hematopoietic disorders and diverse cancer predisposition

Daichi Inoue et al. Nat Genet. 2021 May.

Abstract

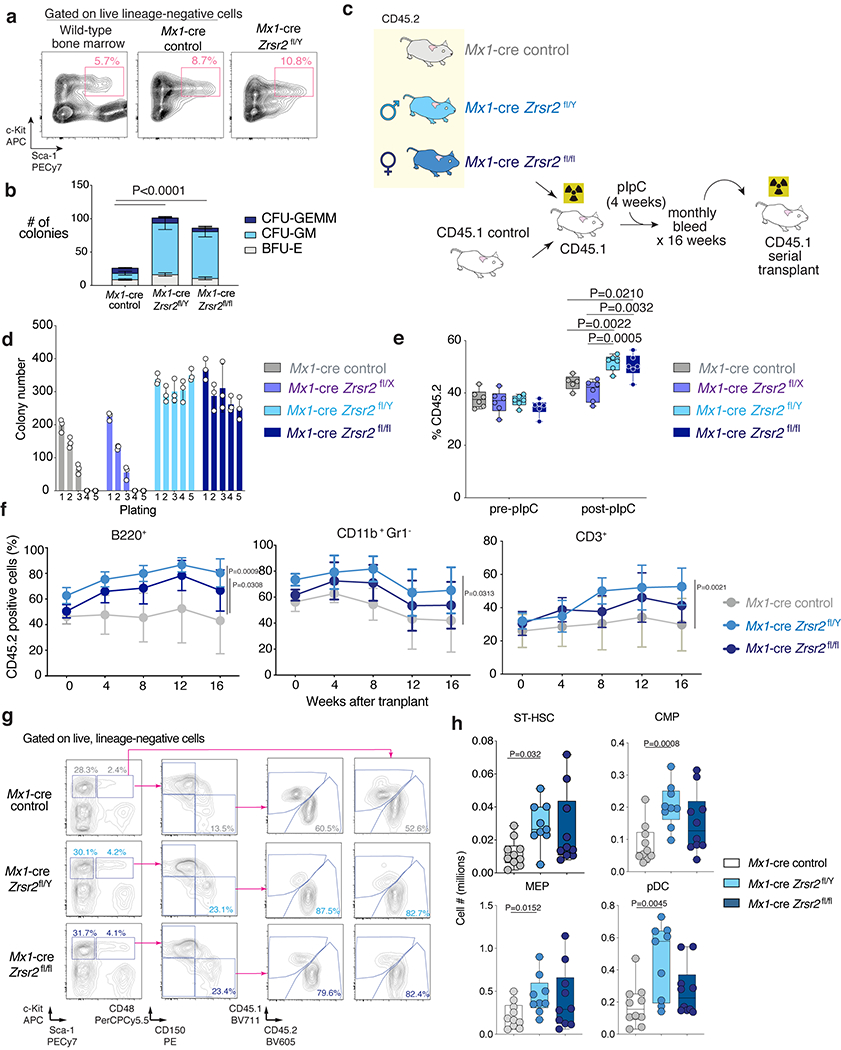
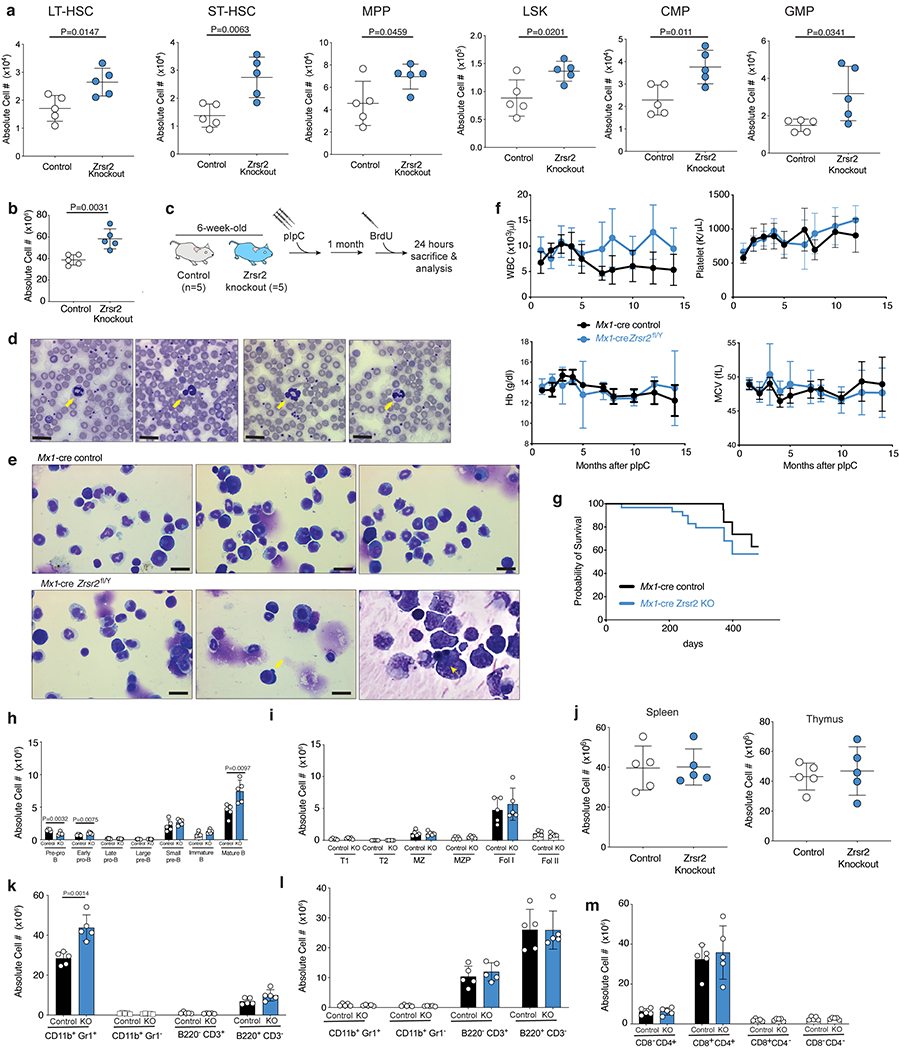
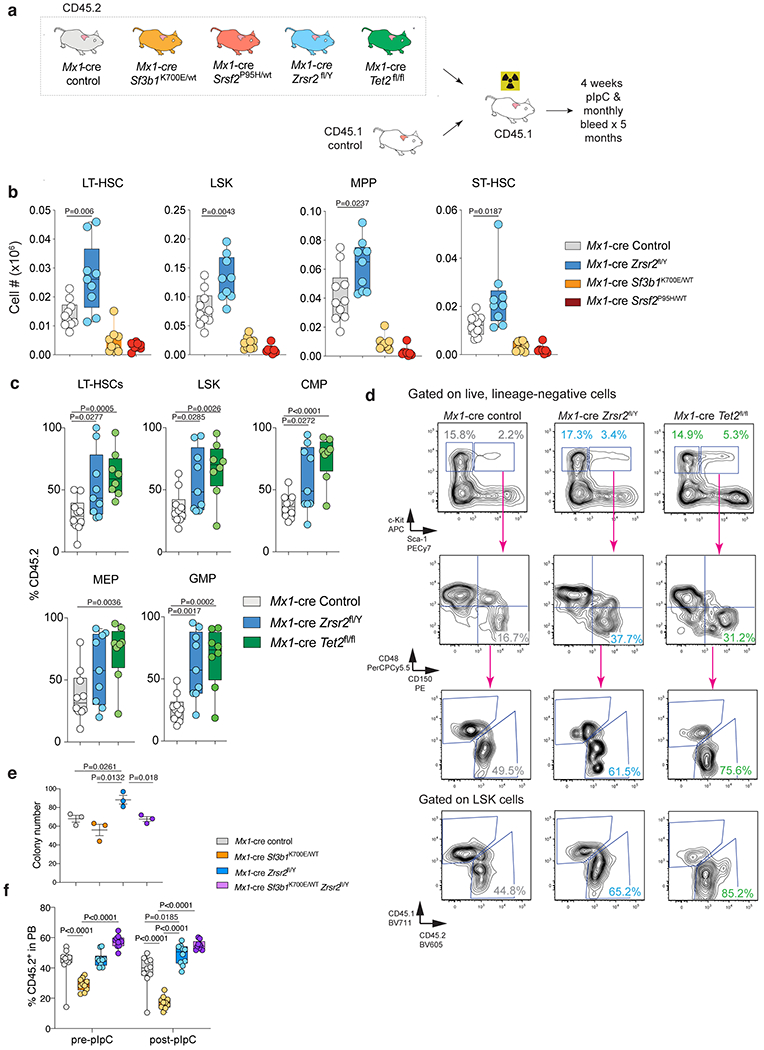
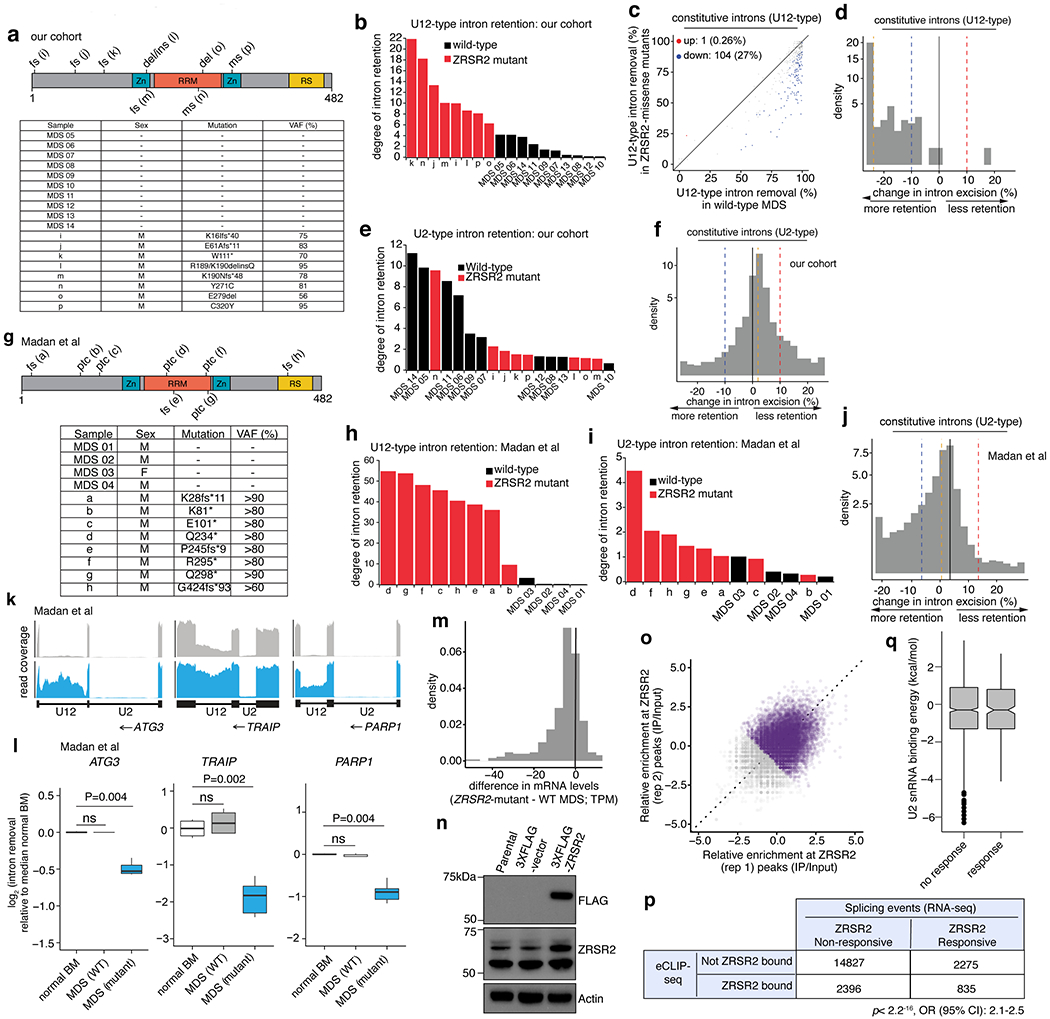
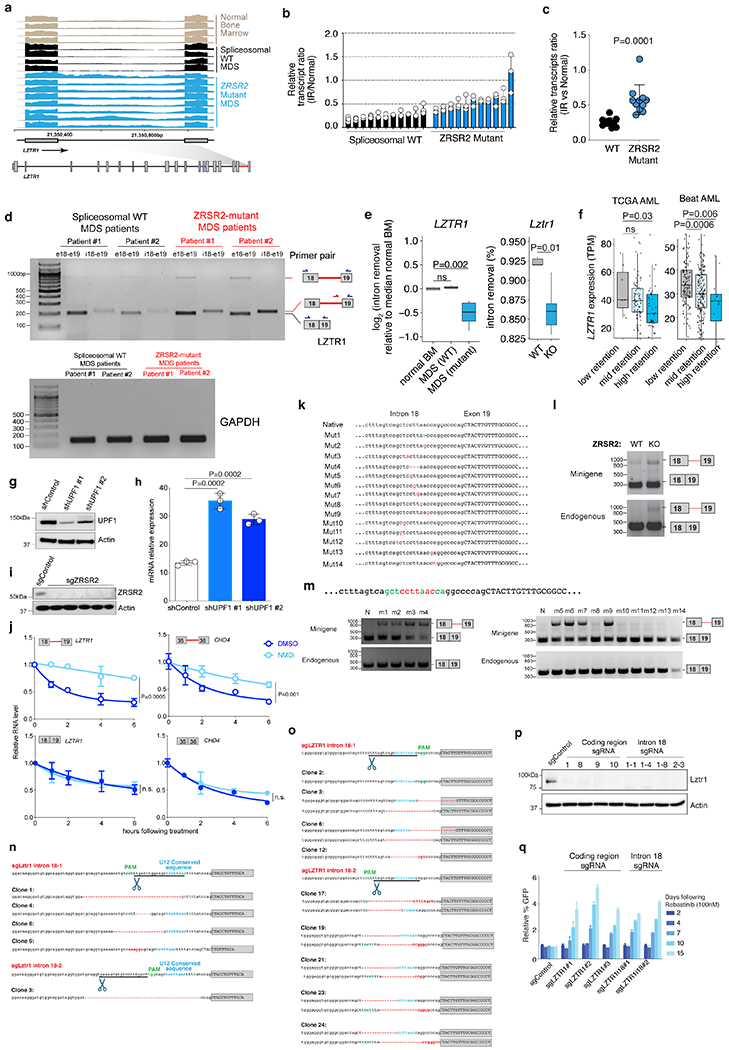
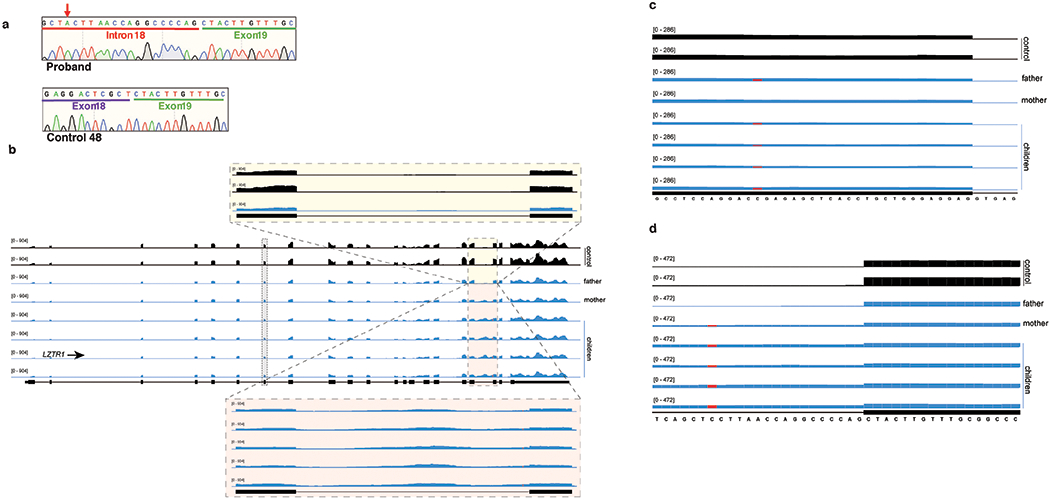
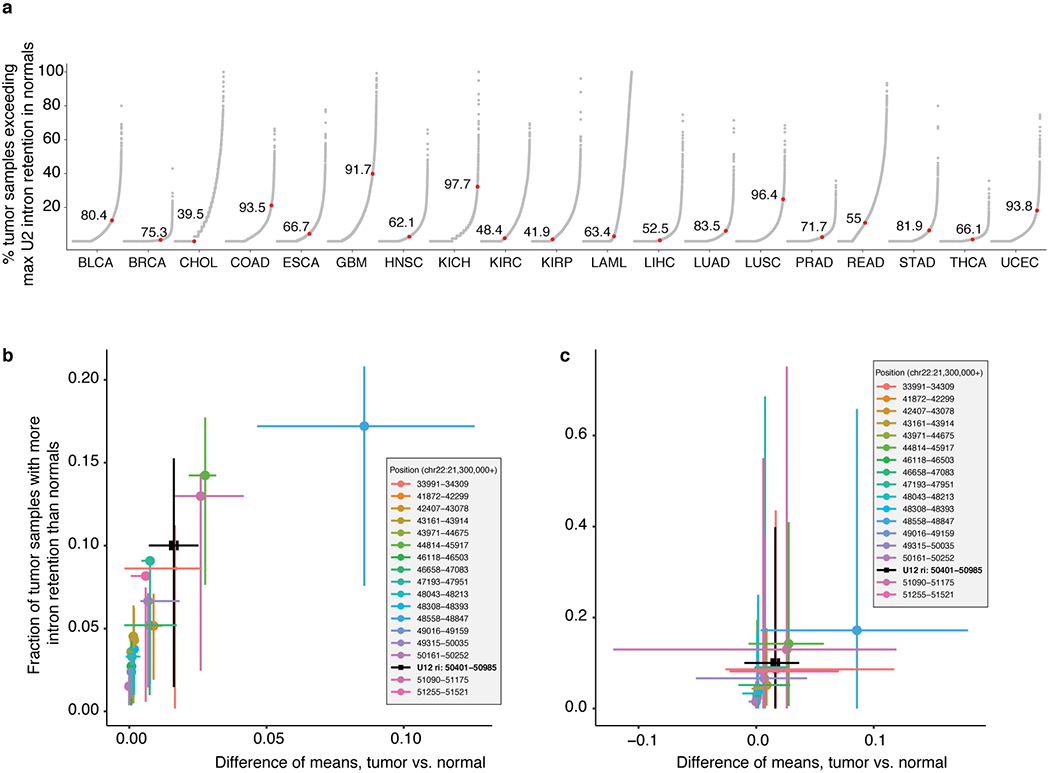
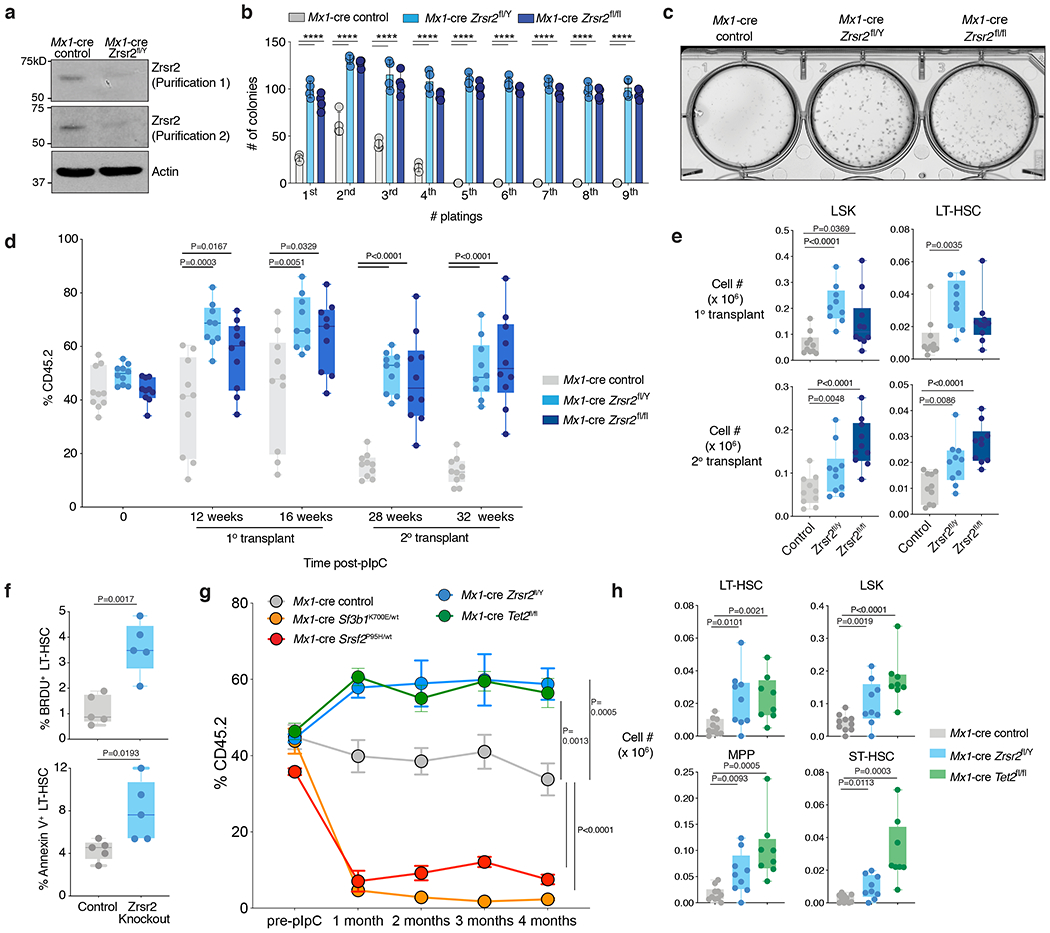
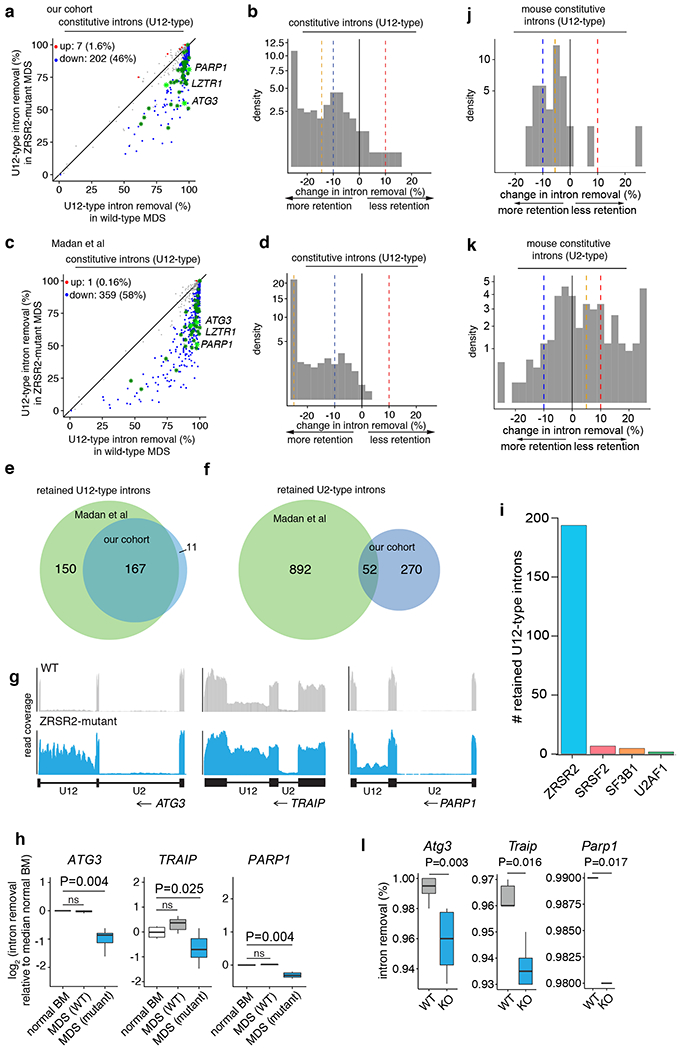
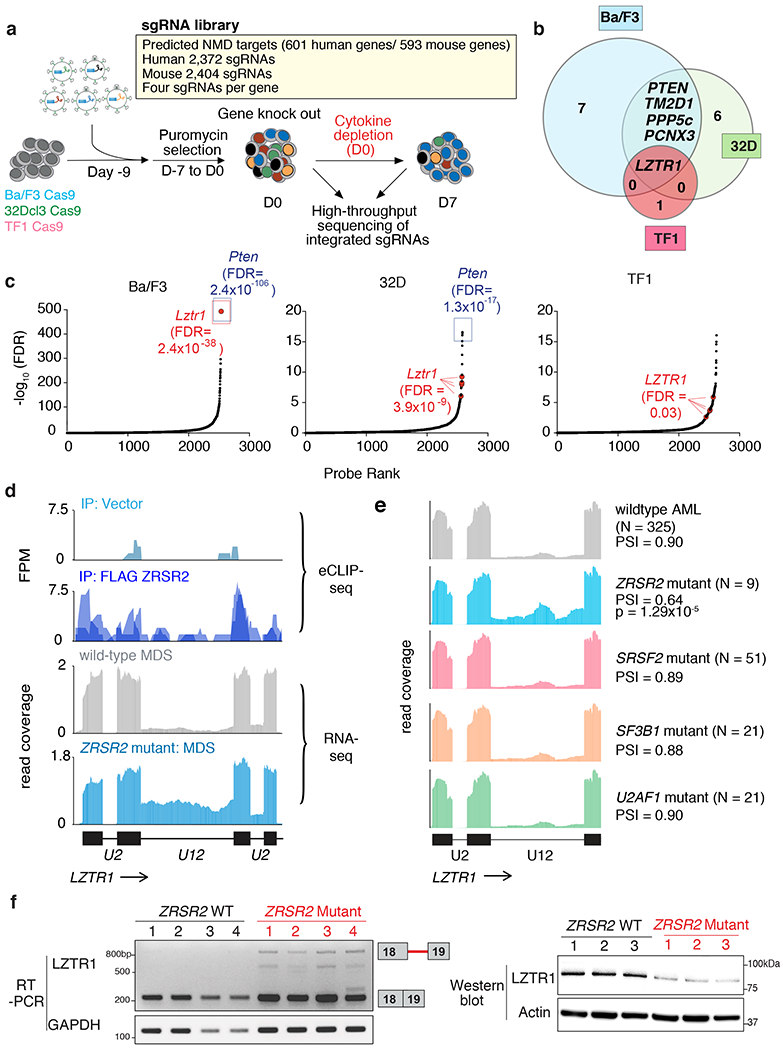
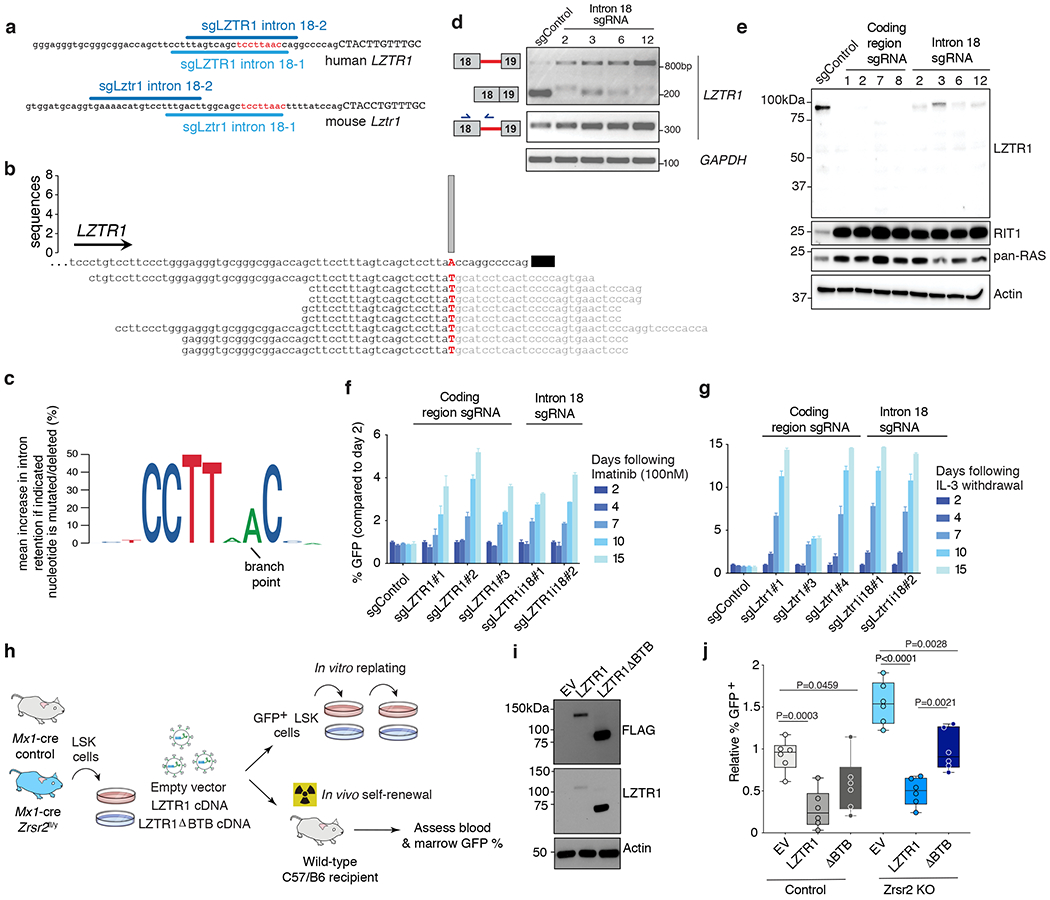
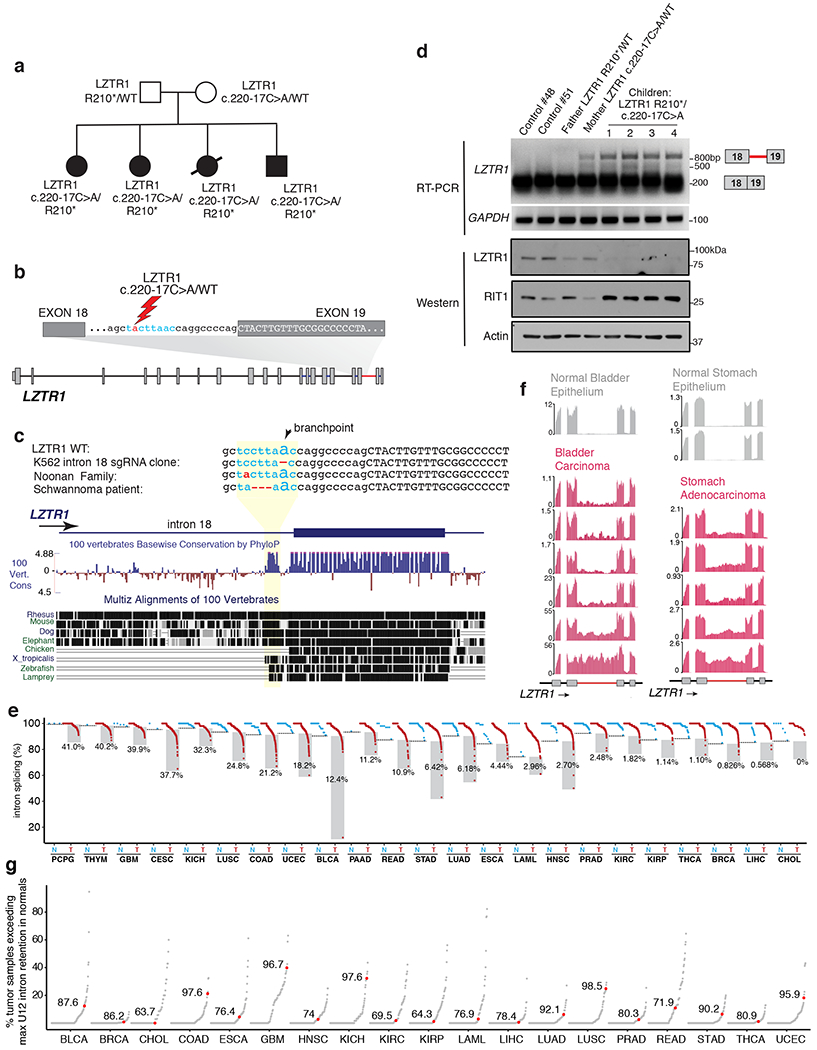
Most eukaryotes harbor two distinct pre-mRNA splicing machineries: the major spliceosome, which removes >99% of introns, and the minor spliceosome, which removes rare, evolutionarily conserved introns. Although hypothesized to serve important regulatory functions, physiologic roles of the minor spliceosome are not well understood. For example, the minor spliceosome component ZRSR2 is subject to recurrent, leukemia-associated mutations, yet functional connections among minor introns, hematopoiesis and cancers are unclear. Here, we identify that impaired minor intron excision via ZRSR2 loss enhances hematopoietic stem cell self-renewal. CRISPR screens mimicking nonsense-mediated decay of minor intron-containing mRNA species converged on LZTR1, a regulator of RAS-related GTPases. LZTR1 minor intron retention was also discovered in the RASopathy Noonan syndrome, due to intronic mutations disrupting splicing and diverse solid tumors. These data uncover minor intron recognition as a regulator of hematopoiesis, noncoding mutations within minor introns as potential cancer drivers and links among ZRSR2 mutations, LZTR1 regulation and leukemias.


Conflict of interest statement

COMPETING INTERESTS

O.A.-W. has served as a consultant for H3B Biomedicine, Foundation Medicine Inc, Merck, Prelude Therapeutics, and Janssen, and is on the Scientific Advisory Board of Envisagenics Inc., AIChemy, and Pfizer Boulder; O.A.-W. has received prior research funding from H3B Biomedicine and LOXO Oncology unrelated to the current manuscript. The remaining authors declare no competing interests.

Figures

Extended Data Fig. 1
Extended Data Fig. 1. Generation and validation of Zrsr2 conditional knockout (cKO) mice.
(a) Punnett square enumerating male and female myeloid neoplasm patients wild-type versus mutant for ZRSR2 across 2,302 patients. (b) Lollipop diagram of ZRSR2 mutations from (a). (c) Schematic depiction of the targeting strategy to generate Zrsr2 cKO mice. The Zrsr2 allele was deleted by targeting exon 4 in a manner that results in a frameshift following excision. Two LoxP sites flanking exon 4 and an Frt-flanked neomycin selection cassette were inserted in the downstream intron. (d) Verification of correct homologous recombination using Southern blots from targeted embryonic stem cells. The experiment was repeated twice with similar results. (e) Verification of the presence of Mx1-cre and Zrsr2 floxed alleles as well as excision of Zrsr2 using genomic PCR. The experiment was repeated three times with similar results. (f) Full-length Western blot of Zrsr2 protein in protein lysates from bone marrow mononuclear cells from Mx1-cre control or Mx1-cre Zrsr2fl/y mice. Black arrow indicates full-length Zrsr2 protein while grey arrows indicate non-specific bands. The experiment was repeated three times with similar results. (g) Zrsr2 expression (relative to 18s rRNA) in long-term hematopoietic stem cells (DAPI lineage-negative c-Kit+ Sca-1+ CD150+ CD48) in Mx1-cre control, Mx1-cre Zrsr2fl/y, and Mx1-cre Zrsr2fl/fl mice 6-weeks following polyinosinic-polycytidylic acid (pIpC) administration. Mean values ± SD. P-values calculated relative to the control group by a two-sided t-test. n=3 biologically independent experiments. (h) RNA-seq coverage plots from lineage-negative c-Kit+ cells from mice in (g) illustrating excision of exon 4 of Zrsr2 following pIpC.
Extended Data Fig. 2
Extended Data Fig. 2. Zrsr2 loss enhances self-renewal of hematopoietic stem cells (HSCs).
(a) FACS of cells from 5th methylcellulose plating (see Fig. 1b) for live, LSK cells. Wild-type bone marrow (BM) from 6-week old mouse (left) as a staining control. (b) Number of CFU-GM, CFU-GEMM, and BFU-E colonies from initial plating of LT-HSCs (lin LSK CD150+ CD48) from Mx1-cre control, Mx1-cre Zrsr2fl/y, and Mx1-cre Zrsr2fl/fl mice into methylcellulose. Mean ± SD, two-sided t-test. n=4 biologically independent experiments. (c) Schematic of competitive BM transplantation. (d) Number of methylcellulose colonies from LT-HSCs from Mx1-cre control, Mx1-cre Zrsr2fl/x, Mx1-cre Zrsr2fl/y, and Mx1-cre Zrsr2fl/fl. Mean value ± SD. n=3 biologically independent experiments. (e) Box-and-whisker plots of percentage of peripheral blood CD45.2+ cells in competitive transplantation pre- and post-pIpC using CD45.2+ Mx1-cre control, Mx1-cre Zrsr2fl/x, Mx1-cre Zrsr2fl/y, and Mx1-cre Zrsr2fl/fl mice. For box and whiskers plots throughout, bar indicates median, box edges first and third quartile values, and whisker edges minimum and maximum values, two-sided t-test. Experiment repeated three times with similar results in (d) and (e). (f) Percentage of CD45.2+ B220+ (left), CD45.2+ CD11b+ Gr1 (middle), and CD45.2+ CD3+ cells (right) in primary competitive transplantation. Mean ± SD. P values by two-sided t-test using the values at 16 weeks after transplant. P value relative to the control group at 16 weeks by a two-sided t-test. (g) FACS analysis and gating strategy of BM cells from representative primary recipient mice in competitive transplantation. (h) Box-and-whisker plots of numbers of ST-HSCs, CMPs, MEPs, and pDCs in BM of primary recipient mice in competitive transplantation. For box and whiskers plots throughout, bar indicates median, box edges first and third quartile values, and whisker edges minimum and maximum values. P value relative to control by a two-sided t-test.
Extended Data Fig. 3
Extended Data Fig. 3. Characterization of Zrsr2 conditional knockout (cKO) mice.
(a) Absolute number of LT-HSCs, ST-HSCs, MPPs, LSKs, CMPs, and GMPs in primary, non-transplanted 20-week-old Mx1-cre control (“control”) and Mx1-cre Zrsr2fl/y mice. Mean ± SD. n=5 animals. (b) Absolute number of live, bone marrow (BM) mononuclear cells in 10-week old Mx1-cre control (“control”) and Mx1-cre Zrsr2fl/y mice (“Zrsr2 knockout”) 4-weeks following Zrsr2 excision. Mean ± SD. n=5 animals. P-values relative to control by two-sided t-test and indicated in figures. (c) Schematic of BrdU analysis of hematopoietic stem cells from mice in (b) and Fig. 1f. (d) Hyposegmented, hypogranular neutrophils in peripheral blood of 10-week old Mx1-cre Zrsr2fl/y mice (yellow arrows). Bar: 10mm. (e) BM cytospins indicating hyposegmented, hypogranular neutrophils (left panel) and dysplastic erythroid progenitors (middle and right panels, yellow arrows). Bar: 10mm. Experiment repeated three times with similar results in (d) and (e). (f) Peripheral blood white blood cell counts (WBC), platelet count, hemoglobin (Hb), and mean corpuscular volume (MCV) in primary Mx1-cre control (n=9) and Mx1-cre Zrsr2fl/y (n=10) mice (following Zrsr2 excision at 6 weeks age). Mean ± SD. (g) Kaplan-Meier survival of primary control and Zrsr2 KO mice (following Zrsr2 excision at 6 weeks age). Absolute numbers of (h) bone marrow and (i) spleen B-cell subsets. (j) Numbers of live, spleen (left) and thymic (right) mononuclear cells in mice from (h)-(i). Mean ± SD. Absolute numbers of live mature hematopoietic cells (k) in marrow and (l) spleen of 8-week-old Mx1-cre control (“control”) and Mx1-cre Zrsr2fl/y (“knockout” or “KO”) mice (Zrsr2 excision at 4 weeks). (m) Absolute numbers of T-cell subsets in thymus of mice from (k). Mean ± SD shown throughout. Mx1-cre control (n=5) and Mx1-cre Zrsr2fl/y (n=5) mice were used in (h) to (m). P-values relative to control by two-sided t-test and indicated in figures.
Extended Data Fig. 4
Extended Data Fig. 4. Comparison of the effects of Zrsr2 loss versus Tet2 knockout or Sf3b1K700E or Srsrf2P95H mutations on hematopoietic stem and progenitor cells.
(a) Schema of competitive bone marrow (BM) transplantation assays. (b) Absolute number of CD45.2+ long-term HSCs (LT-HSCs), LSK, and MPPs in the bone marrow of CD45.1 recipient mice 16 weeks following pIpC (n=8-10 each). For box and whiskers plots throughout, bar indicates median, box edges first and third quartile values, and whisker edges minimum and maximum values. (c) Percentage of CD45.2+ LT-HSCs, LSK, CMP, MEP, and GMP cells in the BM of CD45.1 recipient mice 16-weeks following pIpC (n=8-10 per each). P value was calculated relative to the control group by a two-sided t-test. (d) Representative FACS plots of data in (c). (e) Number of methylcellulose colonies generated from 100 sorted LT-HSCs from mice with the indicated genotype. n=3 biologically independent experiments. Error bars, mean values +/− SEM. P-values by one-way ANOVA with Tukey’s multiple comparisons test. (f) Percentage of CD45.2+ cells in the blood of recipient mice from Zrsr2 knockout/Sf3b1K700E/WT double mutant cells and relevant controls pre- and post-pIpC administration to recipient mice (n=10 each). P-values by two-way ANOVA with Tukey’s multiple comparisons test. Data in (b), (c), and (f) are shown as box-and-whisker plots where bar indicates median, box edges first and third quartile values, and whisker edges minimum and maximum values.
Extended Data Fig. 5
Extended Data Fig. 5. Effect of ZRSR2 loss on minor intron splicing.
(a) ZRSR2 mutations in our cohort. “MDS 05-14” are wild-type; “i-p” are ZRSR2-mutant. VAF: variant allele frequency, fs: frameshift, ptc: premature termination codon, del: deletion, ins: insertion, ms: missense mutation. (b) Comparison of U12-type intron retention in MDS samples vs. normal marrow. (c) Differential splicing of U12-type introns. Each point corresponds to a single intron, illustrating percentage of mRNAs in which intron is spliced out. Blue/red dots: introns with significantly increased/decreased retention in ZRSR2-mutant vs. WT, with absolute change ≥10% or absolute log fold-change of ≥2 with p≤0.05 (two-sided Mann-Whitney U, without adjustments for multiple comparisons). (d) Distribution of intron retention in samples with ZRSR2 mutations. Blue/red dashed lines: thresholds of −10% and 10% for differential retention; gold line: median change in intron retention. (e) As (b), and (f) as (d), for U2-type introns. (g) As (a), and (h) As (b), for Madan et al. (i) As (h), for U2-type introns. (j) As (f), for Madan et al. (k) RNA-seq coverage plots of U12-type introns averaging samples with indicated genotypes. (l) Splicing efficiencies of introns in (k) relative to normal marrow (median over n=4 normal samples). P-values: two-sided Mann-Whitney U. Middle line, hinges, notches, and whiskers: median, 25th/75th percentiles, 95% confidence interval and most extreme points within 1.5x interquartile range from hinge. (m) Expression of genes with retained U12-type introns between ZRSR2-mutant vs. WT. (n) Immunoblot in K562 cells used for eCLIP-seq (repeated twice with similar results). (o) eCLIP of ZRSR2-binding sites. Input-normalized peak signals as log2 fold-change. Purple points: eCLIP-enriched ZRSR2 peaks in biological replicates. (p) Overlap of genes bound by ZRSR2 vs. differentially spliced in ZRSR2-mutant versus WT (“ZRSR2 responsive”). P-value: Fisher’s exact test. (q) U2 snRNA binding energy within ZRSR2 non-responsive and responsive minor introns.
Extended Data Fig. 6
Extended Data Fig. 6. Consequences of ZRSR2 and LZTR1 dysregulation.
(a) RNA-seq of LZTR1’s minor intron in normal and ZRSR2-mutant and WT MDS (n=10 each) marrow. (b) Ratio of intron retained (IR) to normal LZTR1 in MDS samples (n=10 each). Mean ± SD. (c) Data from (b) ± SD. P-value; two-sided t-test. (d) Qualitative RT-PCR using primers amplifying exons 18-19 (“e18-e19”) as well as specific to IR isoform. (e) Splicing efficiencies of LZTR1 in patient samples (median over n=4 normal samples; left) or mouse lineage-negative c-Kit+ cells (right). P-values: two-sided Mann-Whitney U. (f) LZTR1 expression by level of minor intron retention (“Low”: <10%; “Mid”: 10-20%; “High-retention”: >20%). P-values: one-sided Mann-Whitney U. In (e) and (f): middle line, hinges, notches, and whiskers indicate median, 25th/75th percentiles, 95% confidence interval, and most extreme points within 1.5x interquartile range from hinge. (g) UPF1 immunoblot in K562 cells with mutation disrupting LZTR1s U12 sequence +/− anti-UPF1 shRNA. (h) Expression of U12-retained LZTR1 following actinomycin D +/− anti-UPF1 shRNA. n=3 biological replicates. Mean +/− SD. (i) Immunoblot of K562 cells +/− ZRSR2-targeting sgRNA. (j) Expression of LZTR1 (left) or CHD4 (right) isoforms in ZRSR2-null K562 cells with DMSO or NMD inhibitor (PMID 24662918). Mean +/− SD; P values: two-sided t-test. n=3 biological replicates. (k) LZTR1 minigene with mutations generated. (l) RT-PCR of LZTR1 minigene and endogenous mRNA from WT or ZRSR2-KO K562 cells. (m) RT-PCR of LZTR1 minigene and endogenous using native (“N”) or mutant minigenes. (n) Lztr1 minor intron with location of sgRNA, PAM site, 3’ U12 consequence (blue text), and sequence in individual Ba/F3 cell clones (red dash: deleted nucleotides). (o) As (n) in K562 cells. (p) Immunoblot of Lztr1 in Ba/F3 single-cell clones +/− Lztr1 protein-coding or minor intron sgRNAs. (q) Median relative percentage of GFP-labeled K562 cells following Rebastinib. Experiments in (d), (g), (i), and (l) were repeated twice with similar results.
Extended Data Fig. 7
Extended Data Fig. 7. Impaired Lztr1 minor intron splicing augments clonogenic capacity of hematopoietic precursors.
(a) Schema of experiment whereby sgRNAs targeting the conserved U12 sequence in Lztr1’s minor intron are delivered to lineage-negative hematopoietic precursors from Scl-CreERT Rosa26-Lox-STOP-Lox Cas9-EGFP Zrsr2fl/y or Zrsr2 wild-type mice followed by serial replating in vitro. In this experiment, sgRNAs are encoded from an RFP657 expressing plasmid and GFP+/RFP657+ double-positive cells were purified for plating. (b) Mean number of colonies following Lztr1 minor intron mutagenesis versus control sgRNA treated bone marrow cells in Zrsr2 wild-type or knockout background from (a). Bars represent standard deviation. P-values calculated relative to the control group by a two-sided t-test. n=3 biologically independent experiments. Error bars, mean values +/− SD. (c) Representative FACS plots of GFP% in cells just before transplantation and in peripheral blood of recipient transplanted mice 4 weeks after transplantation from Figure 5g. (d) Number of colonies in methylcellulose CFU assays from LT-HSCs from mice in (c). n=3 biologically independent experiments. Error bars, mean values +/− SD. P-values by two-way ANOVA with Tukey’s multiple comparisons test. (e) Relative percentage of GFP-labeled K562 cells with knockout of RIT1 and/or mutagenesis of the minor intron in LZTR1 mixed with equal proportions of unlabeled cells to the BCR-ABL inhibitor imatinib. (f) Relative percentage of Ba/F3 cells treated with sgRNAs targeting Rit1 and/or the minor intron of Lztr1 following IL-3 withdrawal (median % relative to day 2 is plotted).
Extended Data Fig. 8
Extended Data Fig. 8. LZTR1 minor intron retention in cancer predisposition syndromes.
(a) Sanger sequence electropherogram of the LZTR1 intron 18 retained isoform (from a representative affected family member in Figure 6d; corresponds to the top band in the LZTR1 RT-PCR gel in Figure 5d) and LZTR1 normal spliced isoform from a control fibroblast sample (corresponds to the bottom band in the LZTR1 RT-PCR gel in Figure 6d). Red arrow indicates mutant nucleotide in the affected family members. (b) RNA-seq coverage plots of LZTR1 in fibroblasts from Noonan syndrome family and controls. Zoom in magnifies the minor intron of LZTR1. (c) As (b), but zoomed in on the region of mutation in the father. (d) As (b), but zoomed in on the region of mutation within LZTR1’s minor intron.
Extended Data Fig. 9
Extended Data Fig. 9. LZTR1 minor intron retention is pervasive in cancers.
(a) Degree of major (U2-type) intron retention across normal (N) and tumor (T) samples in cancers from TCGA. Each point corresponds to a single U2-type intron and indicates the percentage of all tumor samples in which retention of that intron exceeds the maximum corresponding retention of that intron observed in normal samples. Red dot indicates the U12-type intron of LZTR1 for comparison. (b) Each point illustrates the frequency of retention of a single intron of LZTR1 (see inset for key) across all TCGA cohorts with matched normal samples. Values along the x axes represents the mean difference in intron retention in tumor versus normal samples within a cancer type, while the y axes represent the fraction of tumor samples with intron retention that exceeds that of the normal sample with the most intron retention within a cancer type. Points represent the mean value computed across all cancer types, while whiskers represent the interquartile range across cancer types. (c) As (b), but whiskers represent the entire range.
Figure 1.
Figure 1.. Zrsr2 loss increases hematopoietic stem cell self-renewal.
(a) Anti-Zrsr2 Western blot in the spleens of 6-week-old Mx1-cre control and Mx1-cre Zrsr2fl/Y mice. The experiment was repeated three times with similar results. (b) Number of colonies in methylcellulose CFU assays from LT-HSCs from male and female Zrsr2 knockout (KO) mice and controls. Mean value ± SD shown. n=4 biologically independent experiments. P values were calculated by two-sided t-test, ****P<0.0001. (c) Representative photo of initial methylcellulose plating from (b). (d) Box-and-whisker plots of percentage of peripheral blood CD45.2+ cells in competitive transplantation assays post-pIpC administration using CD45.2+ Mx1-cre control, Mx1-cre Zrsr2fl/Y, and Mx1-cre Zrsr2fl/fl mice. For box and whiskers plots throughout, bar indicates median, box edges first and third quartile values, and whisker edges minimum and maximum values. (e) Box-and-whisker plots of absolute numbers of LSK and LT-HSCs in the bone marrow (BM) of recipient mice following 16 weeks of primary (top) and secondary transplantation (bottom) from (d). (f) Box-and-whisker plots of percentage of BrdU+ and Annexin-V+ LT-HSCs in BM of primary 6-week-old Zrsr2 KO and control mice. (g) Percentage of peripheral blood CD45.2+ cells in competitive transplantation assays pre- and post-pIpC administration using CD45.2+ Mx1-cre control (n=10), Sf3b1K700E/WT (n=9), Srsf2P95H/WT (n=8), Zrsr2fl/Y (n=10), and Tet2fl/fl (n=10) mice. Error bars, mean values +/− SEM. P values were calculated by two-sided t-test using the values at 4 months. (h) Absolute numbers of CD45.2+ LSK, LT-HSC, MPP, and ST-HSCs in the BM of recipient mice following 16 weeks of competitive transplantation from (g). P-values calculated relative to the control group by a two-sided t-test and indicated in the figures.
Figure 2.
Figure 2.. Widespread minor intron retention with ZRSR2 loss.
(a) Genome-wide quantification of differential splicing of U12-type introns from our patient cohort with key overlapping mis-spliced mRNAs in mouse hematopoietic precursors (green). Each point corresponds to a single intron and illustrates percentage of mRNAs in which the intron is spliced out. Blue/red dots: introns that exhibit significantly increased/decreased retention in ZRSR2-mutant versus WT cells, defined as an absolute change in retention of ≥10% or absolute log fold-change of ≥2 with associated p≤0.05. Green asterisks: minor introns differentially retained in both patient and mouse; light green asterisks: minor introns in genes of particular interest (Parp1, Lztr1, and Atg3). P-values, two-sided Mann-Whitney U test without adjustments for multiple comparisons. (b) Distribution of U12-type intron retention in ZRSR2-mutant samples (n=8 mutant and 10 wild-type). Blue/red dashed lines: thresholds of −10% and 10% for differential retention; gold line: median change in intron retention. (c) As (a), but for Madan at al cohort. (d) As (b), but for Madan et al cohort. (e) Overlap of U12-type intron retention events between the two patient cohorts (n=8 mutant and 4 wild-type). (f) As (e), but for U2-type introns. (g) RNA-seq coverage plots of U12-type, but not U2-type, intron retention in our patient cohort. Plots averaged over all samples with indicated genotypes. (h) Box plots quantifying splicing efficiencies of introns illustrated in (g) relative to normal marrow (median of 4 normal samples from Madan et al). P-values by two-sided Mann-Whitney U test. (i) Numbers of retained U12-type introns in samples bearing any of the four spliceosomal gene mutations from Beat AML cohort. Distribution of (j) U12-type or (k) U2-type intron retention in Zrsr2-knockout relative to wild-type mouse precursors. Blue/red dashed lines indicate thresholds of −10% and 10% used for differential retention; gold line: median change in intron retention. (l) Box plots illustrating intron splicing efficiencies in mouse lineage-negative c-Kit+ cells. For (h) and (l), the middle line, hinges, notches and whiskers indicate the median, 25th/75th percentiles, 95% confidence interval and most extreme data points within 1.5× interquartile range from hinge. P-values by two-sided Mann-Whitney U test.
Figure 3.
Figure 3.. ZRSR2 RNA binding targets and features of ZRSR2-responsive introns.
(a) Genomic distribution of ZRSR2 eCLIP-seq (enhanced UV crosslinking immunoprecipitation followed by next-generation sequencing) peaks. (b) Metaplot of ZRSR2 eCLIP sequencing reads at ZRSR2-regulated minor introns. (c) Fisher’s exact test analysis evaluating the enrichment of ZRSR2 within responsive introns and each flanking exon by eCLIP-seq in genes with ZRSR2-responsive introns or those with ZRSR2 binding. (d) Gene ontology analysis of ZRSR2-bound genes by eCLIP-seq. (e) Histogram of the locations of branchpoints relative to the 3’ splice site (3’ss) in U2- versus U12-type constitutive introns. (f) Histogram of the locations of branchpoints relative to the 3’ss for ZRSR2 non-responsive versus responsive minor introns (p-value estimated by a two-sided Kolmogorov-Smirnov test). (g) Branchpoint nucleotide preference for ZRSR2 non-responsive versus responsive minor introns (p-value estimated with a two-sided binomial proportion test for a difference in fraction of adenine branchpoints). (h) Mean number of branchpoints within ZRSR2 non-responsive versus responsive minor introns (p-value estimated by a two-sided t-test). Error bars represent ± 1 standard error of the mean (sd/sqrt(n)). (i) U12 snRNA binding energy for branchpoint motifs in ZRSR2 non-responsive versus responsive minor introns (p-value estimated by a two-sided Mann-Whitney U test). (j) Sequence logo plots of the 3’ss of ZRSR2-responsive versus non-responsive introns (upward arrow indicates site of 3’ss). As shown, ZRSR2-responsive introns have weaker/less-defined polypyrimidine tracts. (k) G:A ratio at the +1 position (relative to the 3’ss). Error bars represent ± 1 s.d. estimated by bootstrapping (10k iterations). P-value = 0 by two-sided Mann-Whitney U test.
Figure 4.
Figure 4.. Impaired LZTR1 minor intron excision confers competitive advantage.
(a) Schematic of positive enrichment custom CRISPR-Cas9 pooled lentiviral screen to identify functionally important ZRSR2 regulated minor intron splicing events. (b) Venn diagram of genes targeted by sgRNAs in the screen in (a) across Ba/F3, 32D, and TF1 cells. Numbers of genes identified in the screen in each segment of the Venn diagram is displayed. (c) Rank plot for the −log10(FDR) associated with each sgRNA in screen from (a). sgRNAs targeting the positive control (Pten) and Lztr1 are highlighted. For the probe-level (per-sgRNA) analysis, we fitted a negative binomial generalized log-linear model and performed a likelihood ratio test. FDR values were computed using the Benjamini–Hochberg method. (d) Top, eCLIP-seq for FLAG immunoprecipitation from FLAG empty vector or FLAG-ZRSR2 over the region of LZTR1’s minor intron. Biological duplicate immunoprecipitation data are overlaid. Bottom, RNA-seq coverage over the same locus in primary human MDS samples, with wild-type MDS colored gray (top) and ZRSR2-mutant MDS (bottom) colored blue. (e) RNA-seq coverage plots across the U12-type intron of LZTR1 for patients from Beat AML with the indicated genotypes. Each coverage plot represents an average across all samples with the indicated genotype following normalization to the total number of reads mapped to the coding genes for each sample. PSI, fraction of spliced mRNA. (f) Qualitative RT-PCR gel for LZTR1 minor intron excision (left) and LZTR1 protein levels (right) in representative MDS patient samples WT or mutant for ZRSR2 (n=4 distinct patient samples/genotype for RT-PCR and n=3 distinct patient samples/genotype for Western).
Figure 5.
Figure 5.. Impaired LZTR1 minor intron excision promotes clonal advantage and effects of LZTR1 re-expression on Zrsr2 null hematopoietic cells.
(a) Schematic of the minor intron branchpoint binding region in LZTR1 intron 18 with illustration of intronic sgRNA binding sequences (U12 conserved sequence in red). (b) Branchpoint within LZTR1’s minor intron based on intron lariat-derived RNA-seq reads. Bar represents number of supporting high-confidence reads, defined as those with a single identifying mismatch at the branchpoint characteristic of traversal of the 2’-5’ linkage. (c) Logo plot representation of minigene experiments summarizing mean increase in intron retention if indicated nucleotide is mutated (%). The height of each nucleotide indicates its requirement for normal excision of LZTR1’s minor intron. (d) RT-PCR for LZTR1 intron 18 excision in K562 AML single cell clones treated with intron 18-targeting sgRNAs. Experiment repeated three times with similar results. (e) Full-length WB of LZTR1 using N-terminal antibody as well as K-, N-, and H-RAS (“pan-RAS”) in K562 single cell clones treated with sgRNAs targeting protein-coding versus intronic sequence of LZTR1. Experiment repeated three times with similar results. (f-g) Relative percentage of (f) GFP-labeled K562 cells from (d) mixed with equal proportions of unlabeled cells to imatinib and (g) Ba/F3 cells treated with sgRNAs targeting the protein-coding region of LZTR1 following IL-3 withdrawal (median % relative to day 2 is plotted). (h) Schema of LZTR1 cDNA experiment. Lineage-negative cells from Mx1-cre Zrsr2 control and Zrsr2fl/y mice expressing empty vector, LZTR1 cDNA, or LZTR1 cDNA lacking BTB domains (“ΔBTB”). DAPI GFP+ LSK+ cells were then sorted and tested for replating capacity or transplanted into mice. (i) Western blot of FLAG and LZTR1 in N-terminal FLAG-tagged empty vector (EV), LZTR1, and ΔBTB LZTR1. The experiment was repeated twice with similar results. (j) Relative % GFP+ blood cells from mice receiving lineage-negative cells from Mx1-cre Zrsr2 control or Zrsr2fl/y expressing constructs from (h). Mean value ± SEM shown. Bar indicates median, box edges first and third quartile values, and whisker edges minimum and maximum values. P-values calculated relative to the control group by a two-sided t-test and indicated in the figures.
Figure 6.
Figure 6.. Aberrant LZTR1 minor intron retention in Noonan Syndrome, schwannomatosis, and diverse cancers.
(a) Pedigree of Noonan syndrome family where mother and all four offspring contain a mutation within the conserved U12 branchpoint sequence in LZTR1 intron 18. All four children were diagnosed with Noonan Syndrome and the proband (black circle) developed AML. (b) Schematic of location of the intronic c.220-17C>A mutation. Intronic nucleotides in blue represent conserved U12 sequence. (c) Sequence conservation of the LZTR1 minor intron 3’ conserved sequence and surrounding intronic and exonic sequence (as estimated by phyloP). The location of the LZTR1 intron 18 branchpoint as well as mutations in a K562 single cell clone, the Noonan family from (a), and a schwannoma patient bearing mutations in this region shown. Conservation and repetitive element annotation from the UCSC Genome Browser. (d) Qualitative RT-PCR gel for LZTR1 intron 18 excision (top) and LZTR1 and RIT1 protein levels (bottom) in immortalized skin fibroblasts from the subjects in (a) as well as two healthy control subjects. The experiment was repeated three times with similar results. (e) Splicing of LZTR1’s minor intron across peritumoral normal (N) and tumor (T) samples in cancers from the indicated TCGA cohorts with available matched normal samples. Normal samples for LAML comparison from ref. The horizontal dotted line in each normal column represents the maximum intron retention observed in normal control samples for each cancer type. Shaded box indicates cancer samples exceeding maximum intron retention in normal. The percentage next to each box indicates per cancer-type percentage of cancer samples with high intron retention. (f) Representative RNA-seq coverage plots for LZTR1’s minor intron in bladder and stomach carcinoma and peritumoral normal samples. (g) Degree of minor (U12-type) intron retention across normal (N) and tumor (T) samples in cancers from the TCGA. Each point corresponds to a single U12-type intron and indicates the percentage of all tumor samples in which retention of that intron exceeds the maximum corresponding retention of that intron observed in normal samples. Red dot indicates the U12-type intron of LZTR1; number indicates its percentile rank compared to all other U12-type introns.

References

    1. Tarn WY & Steitz JA A novel spliceosome containing U11, U12, and U5 snRNPs excises a minor class (AT-AC) intron in vitro. Cell 84, 801–11 (1996). - PubMed
    1. Hall SL & Padgett RA Conserved sequences in a class of rare eukaryotic nuclear introns with non-consensus splice sites. J Mol Biol 239, 357–65 (1994). - PubMed
    1. Tarn WY & Steitz JA Highly diverged U4 and U6 small nuclear RNAs required for splicing rare AT-AC introns. Science 273, 1824–32 (1996). - PubMed
    1. Hall SL & Padgett RA Requirement of U12 snRNA for in Vivo Splicing of a Minor Class of Eukaryotic Nuclear Pre-mRNA Introns. Science 271, 1716–1718 (1996). - PubMed
    1. Burge CB, Padgett RA & Sharp PA Evolutionary fates and origins of U12-type introns. Mol Cell 2, 773–85 (1998). - PubMed

Publication types

MeSH terms