. 2021 Jun;53(6):895-905.
doi: 10.1038/s41588-021-00838-7. Epub 2021 Apr 12.

Chromothripsis as an on-target consequence of CRISPR-Cas9 genome editing

Affiliations

Chromothripsis as an on-target consequence of CRISPR-Cas9 genome editing

Mitchell L Leibowitz et al. Nat Genet. 2021 Jun.

Abstract

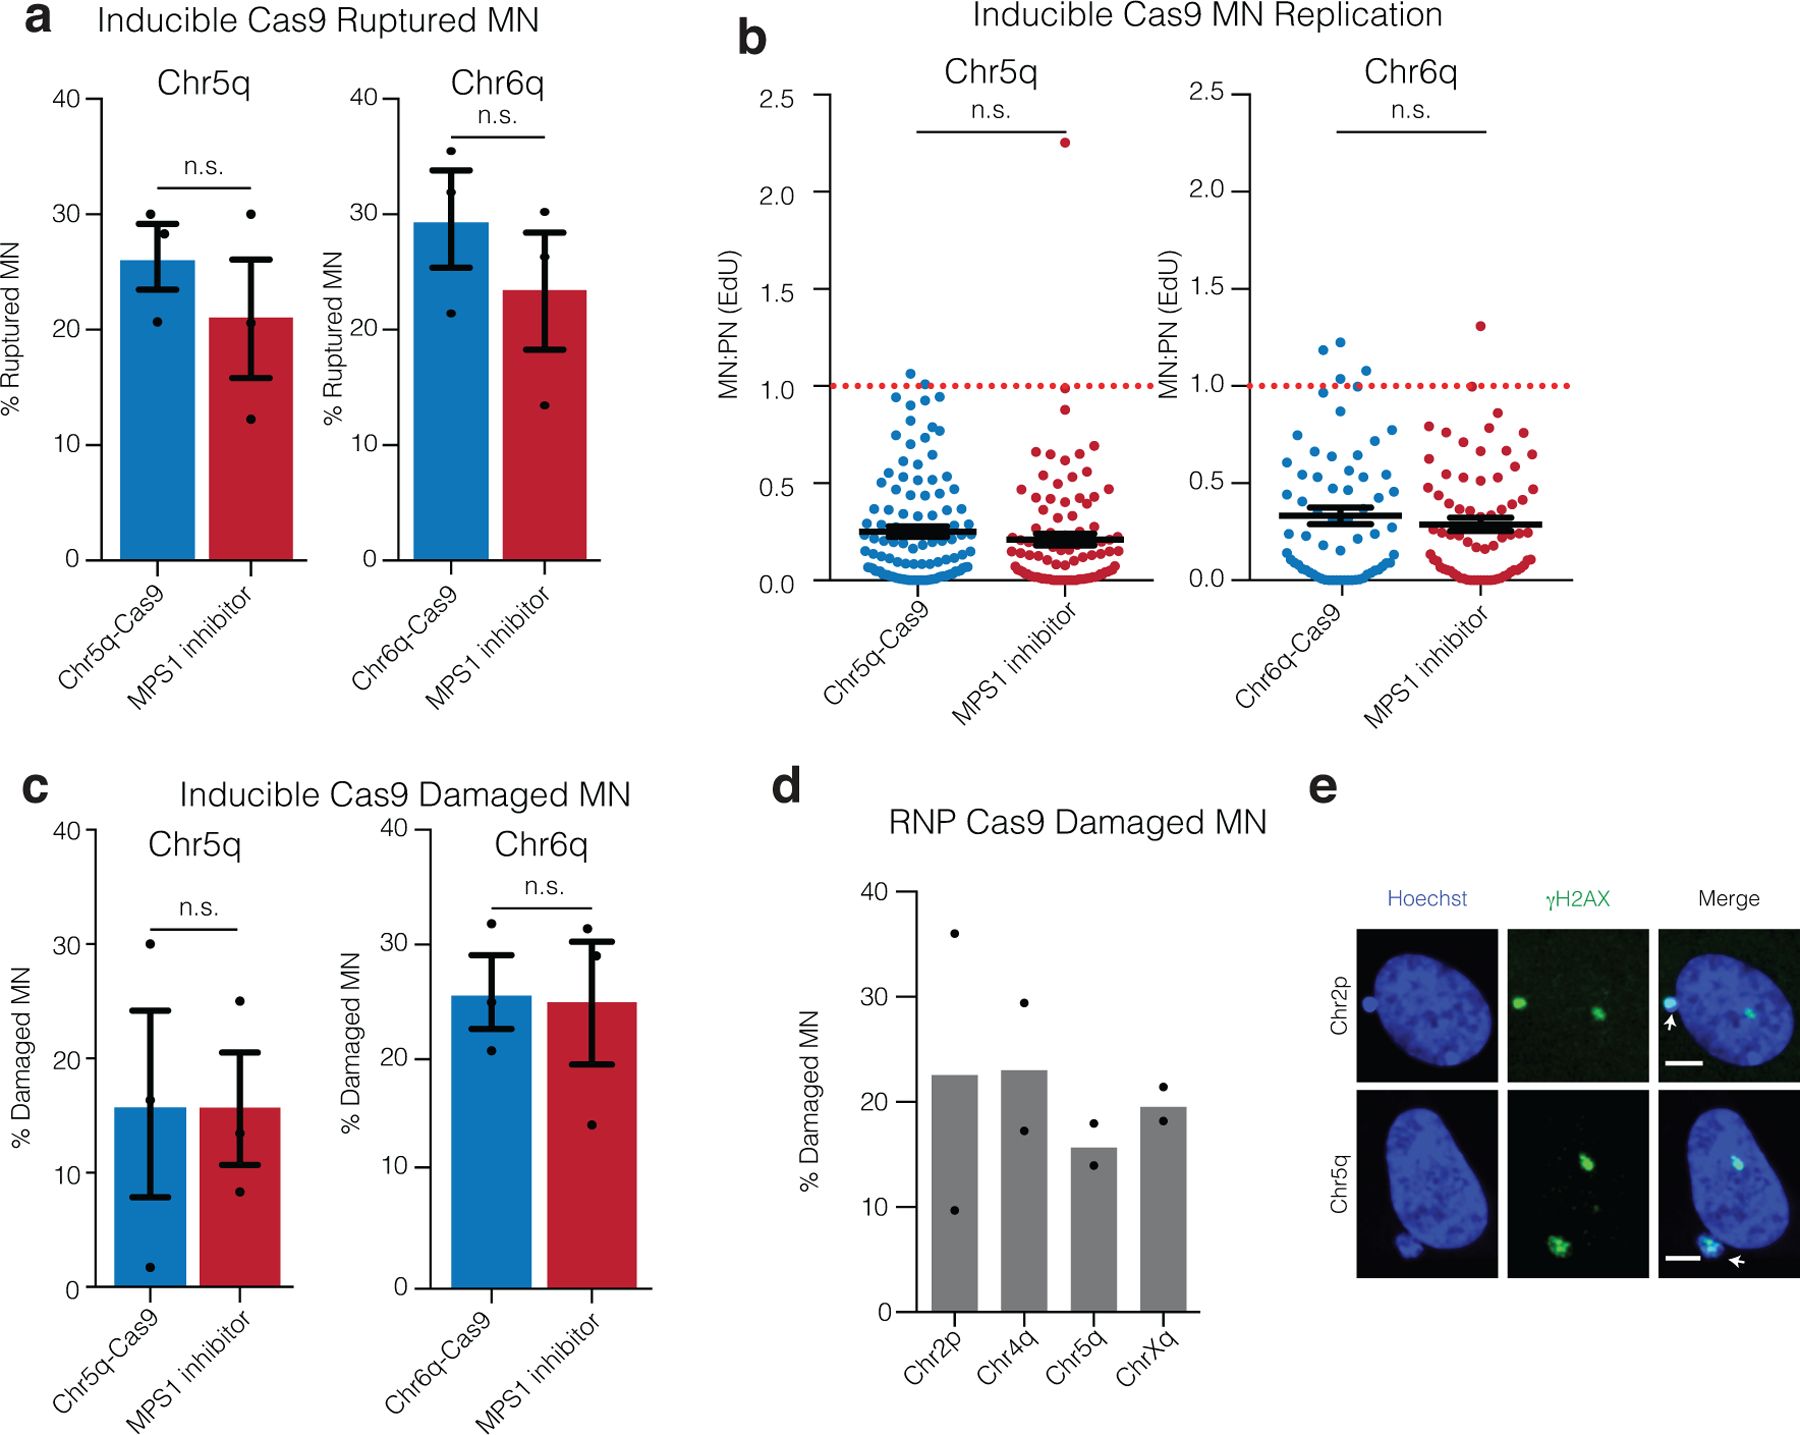
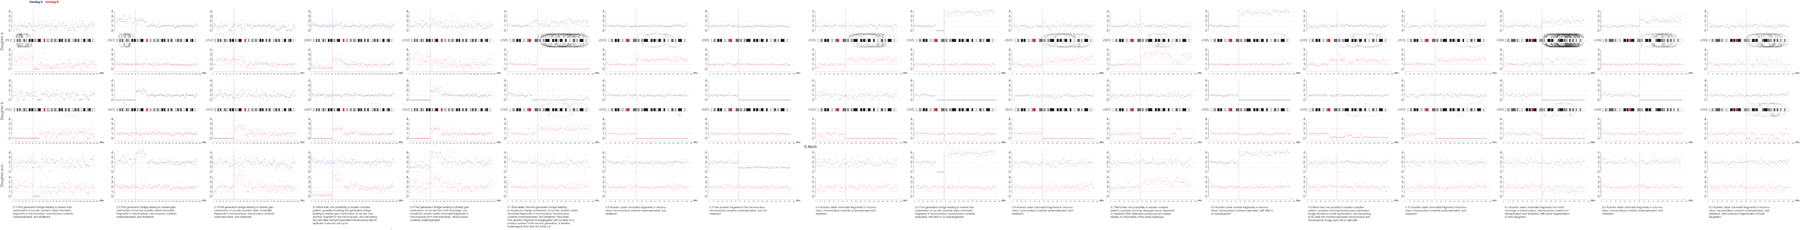
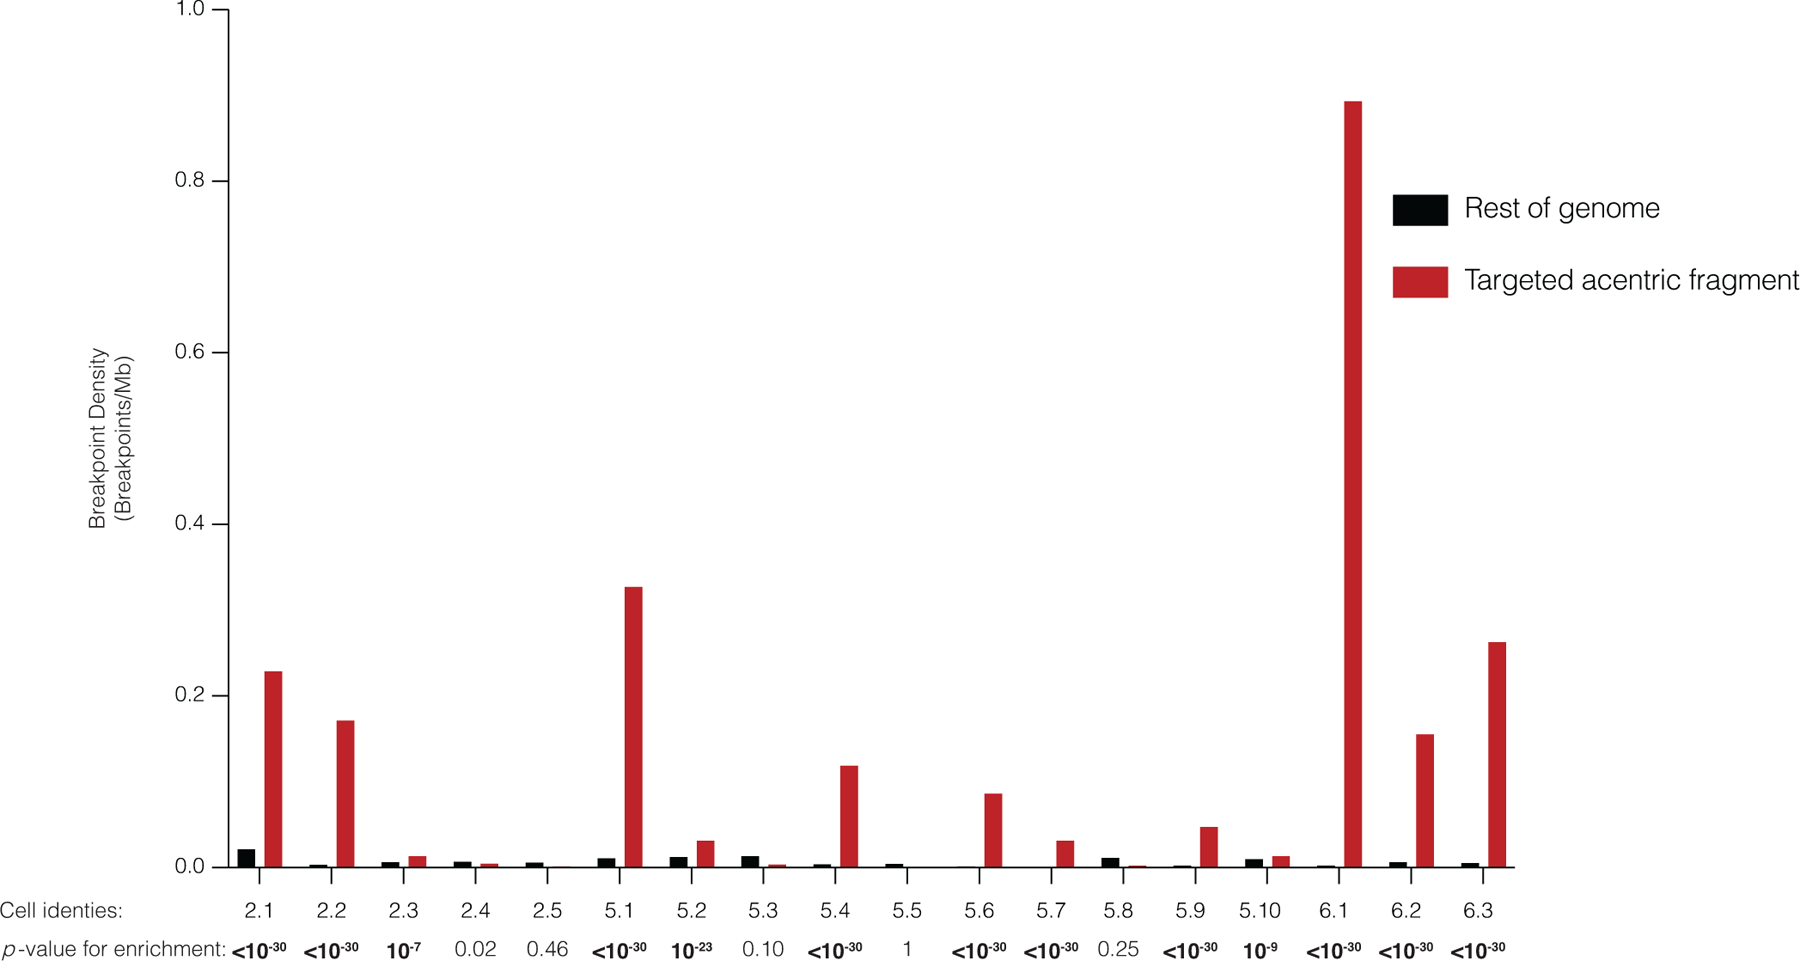
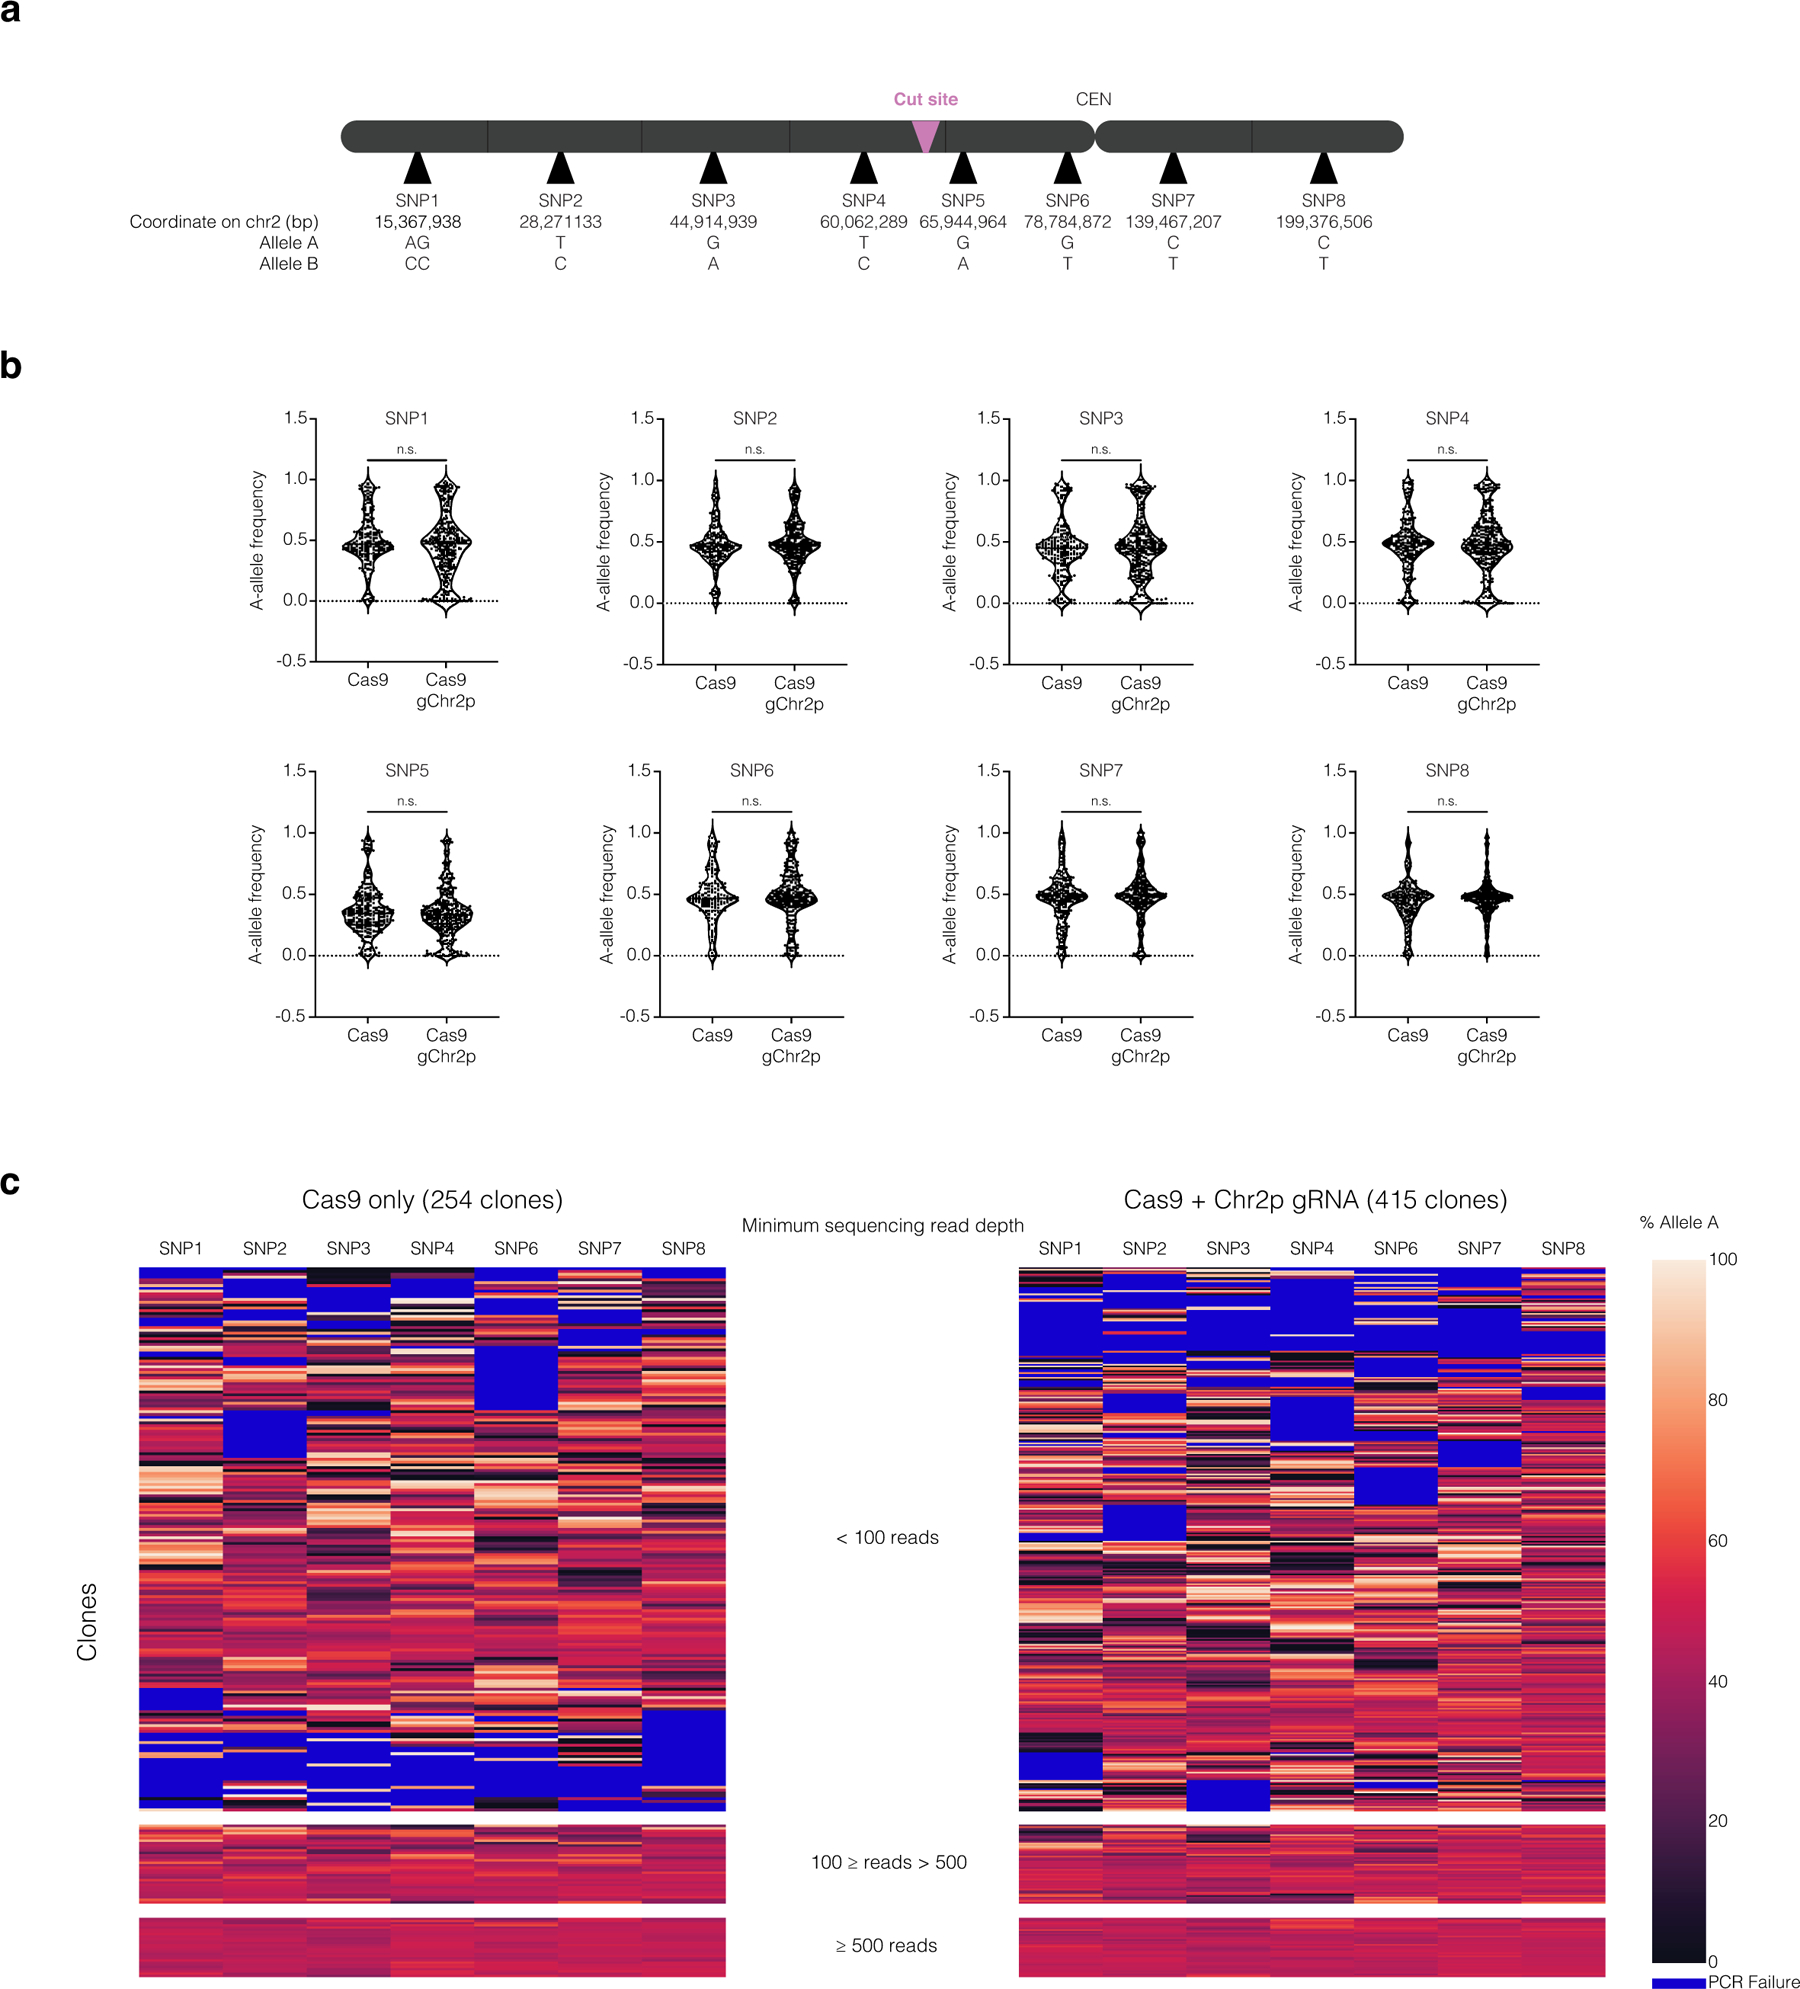
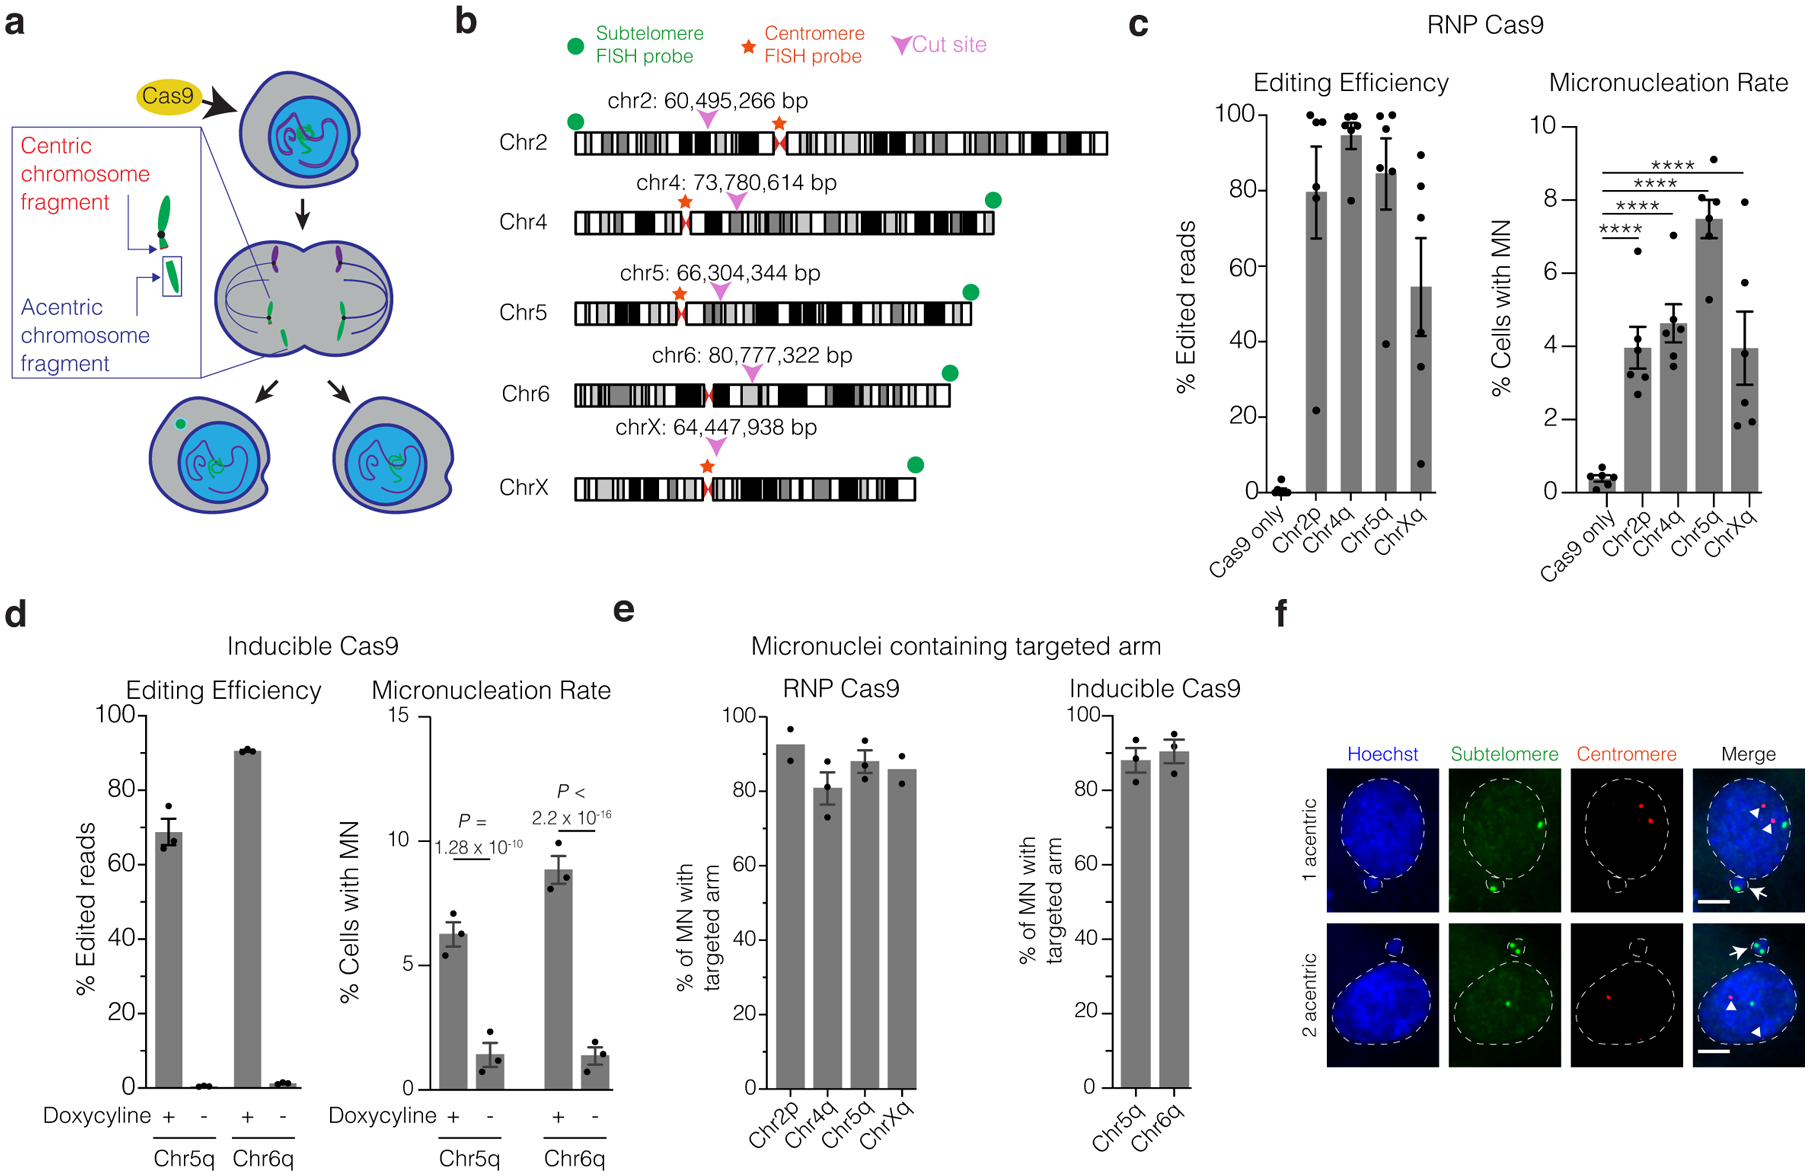
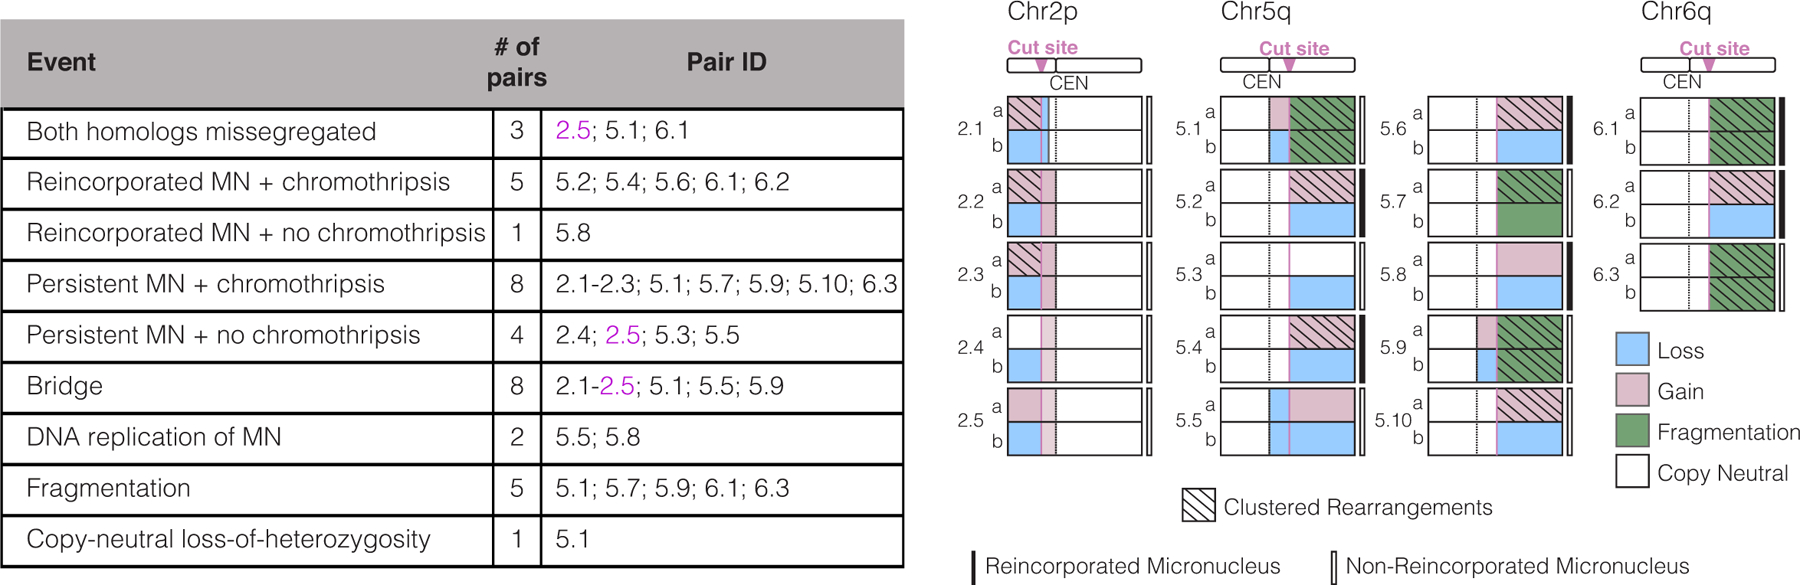
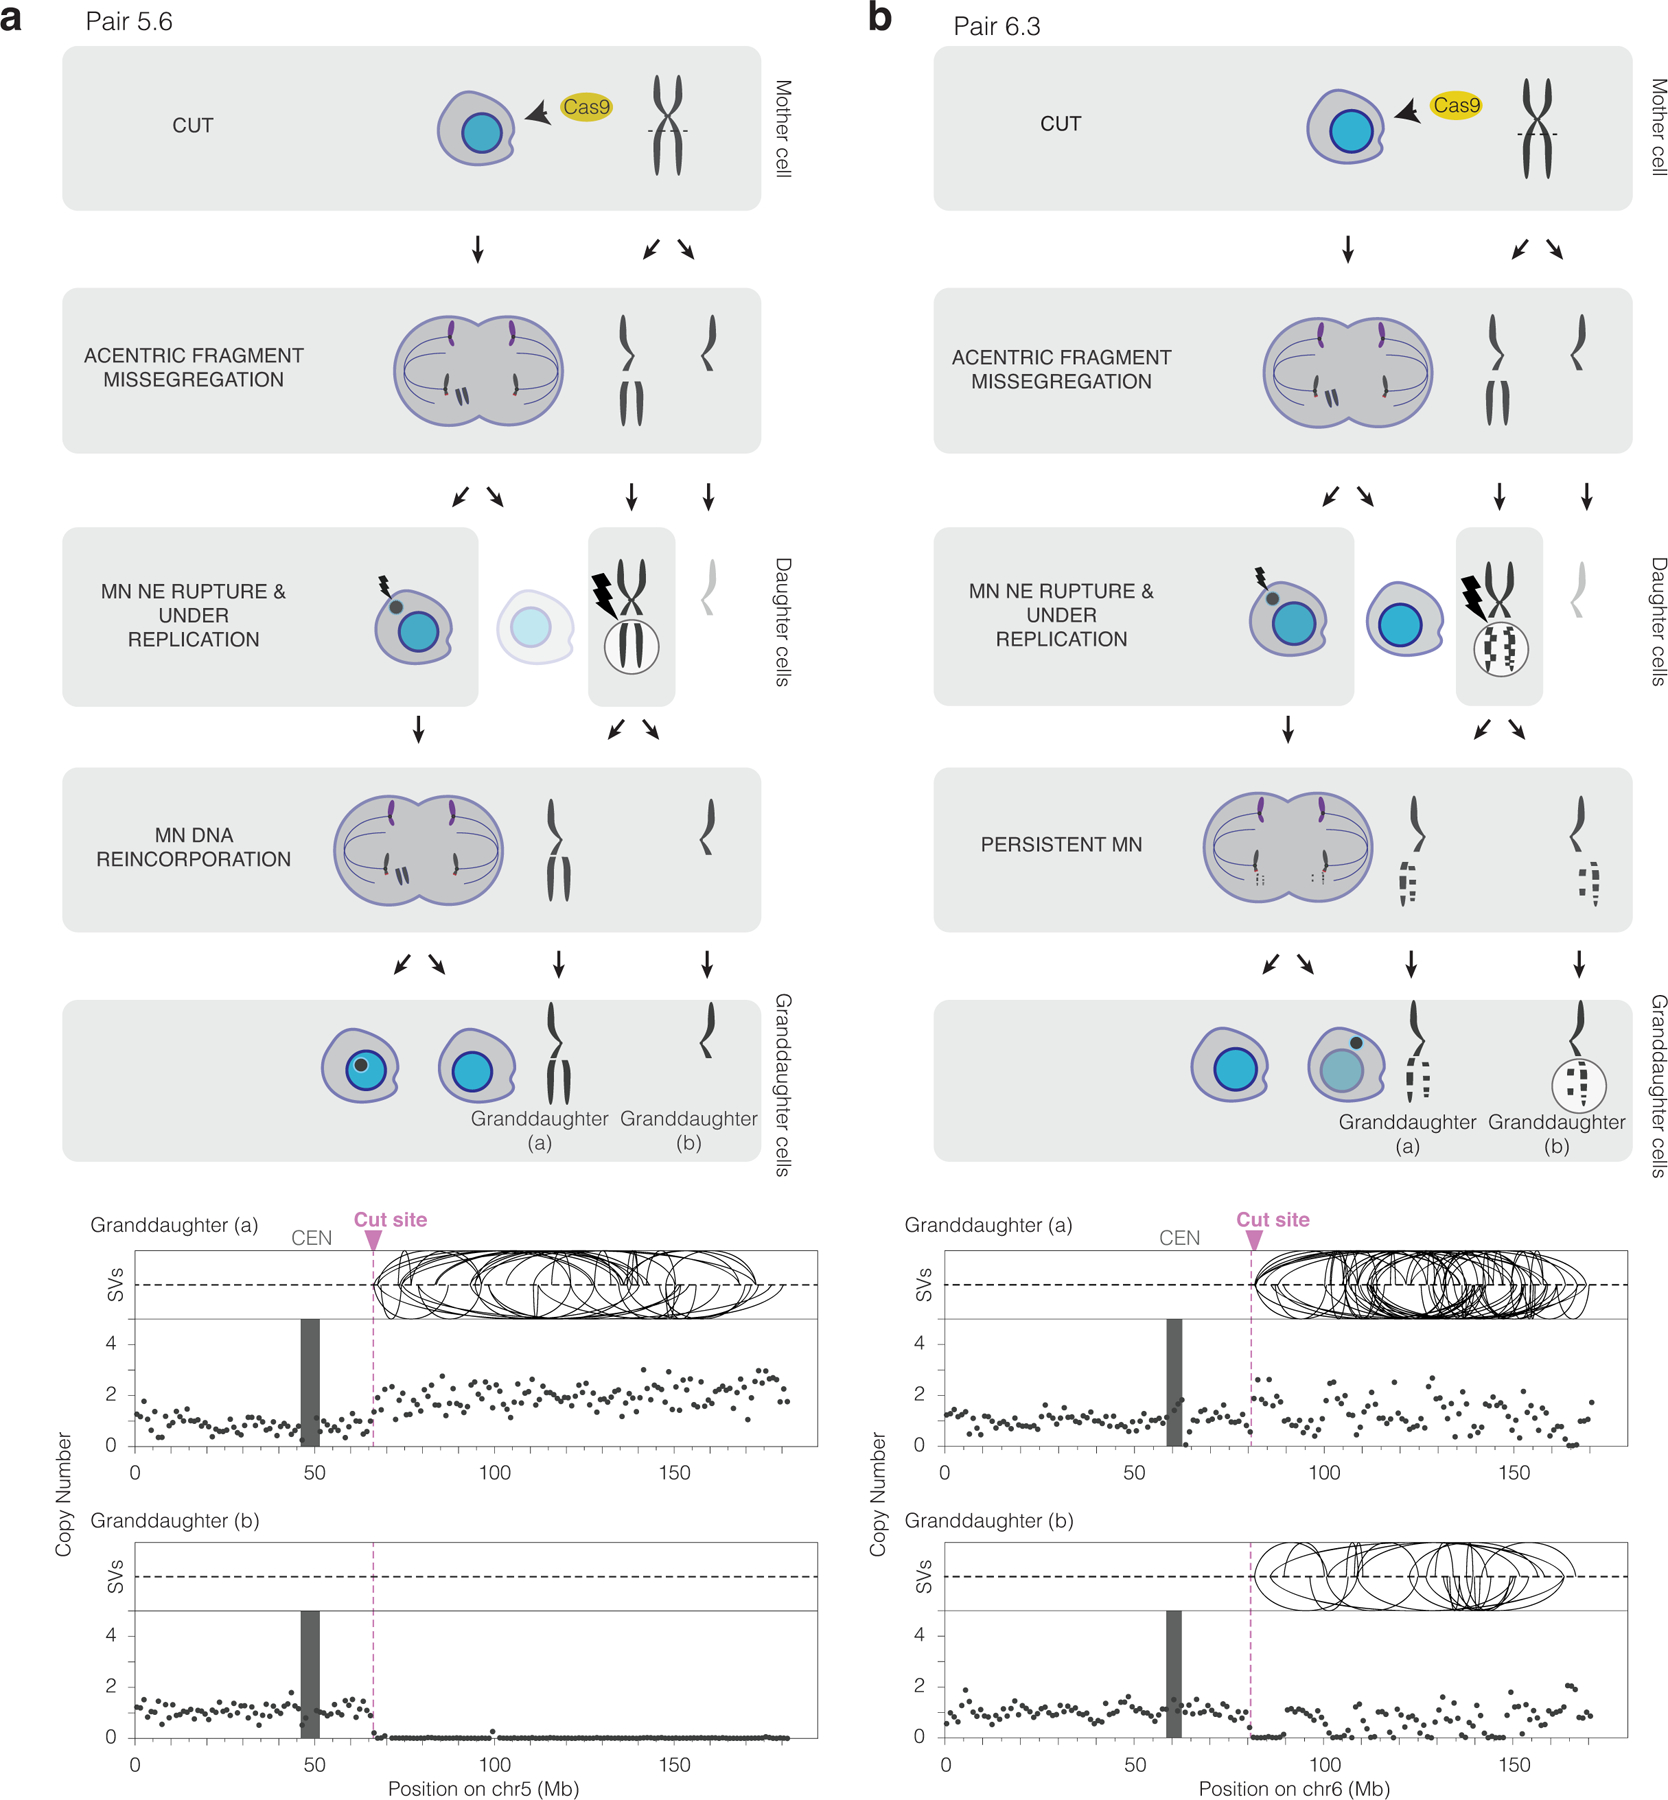
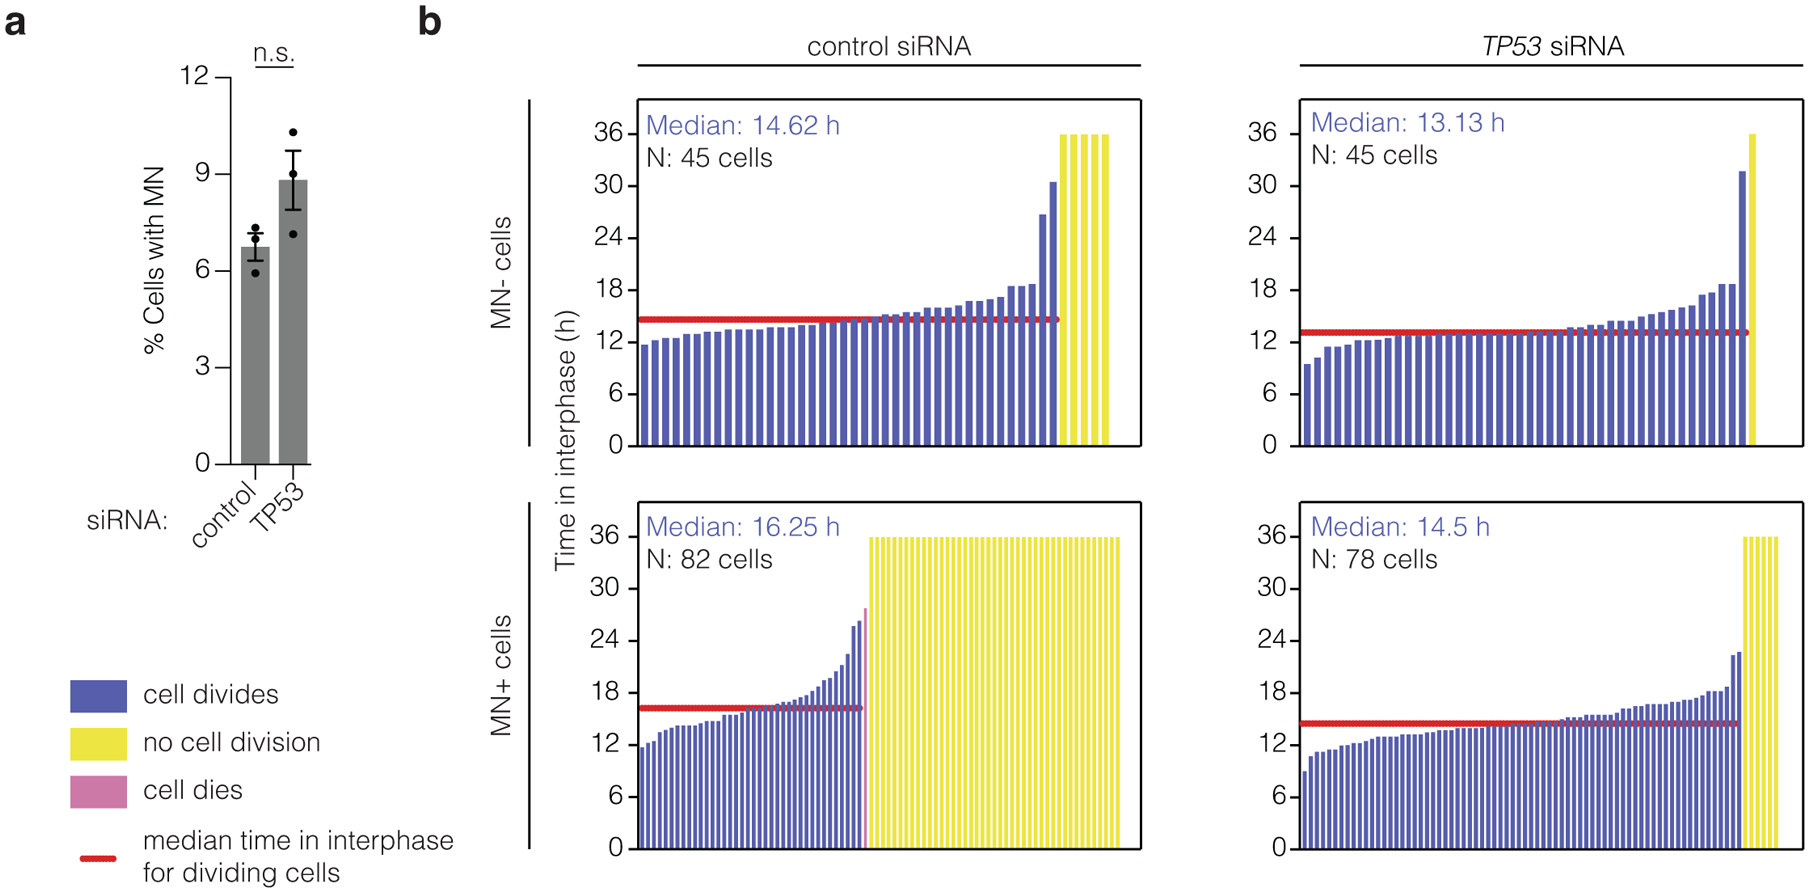
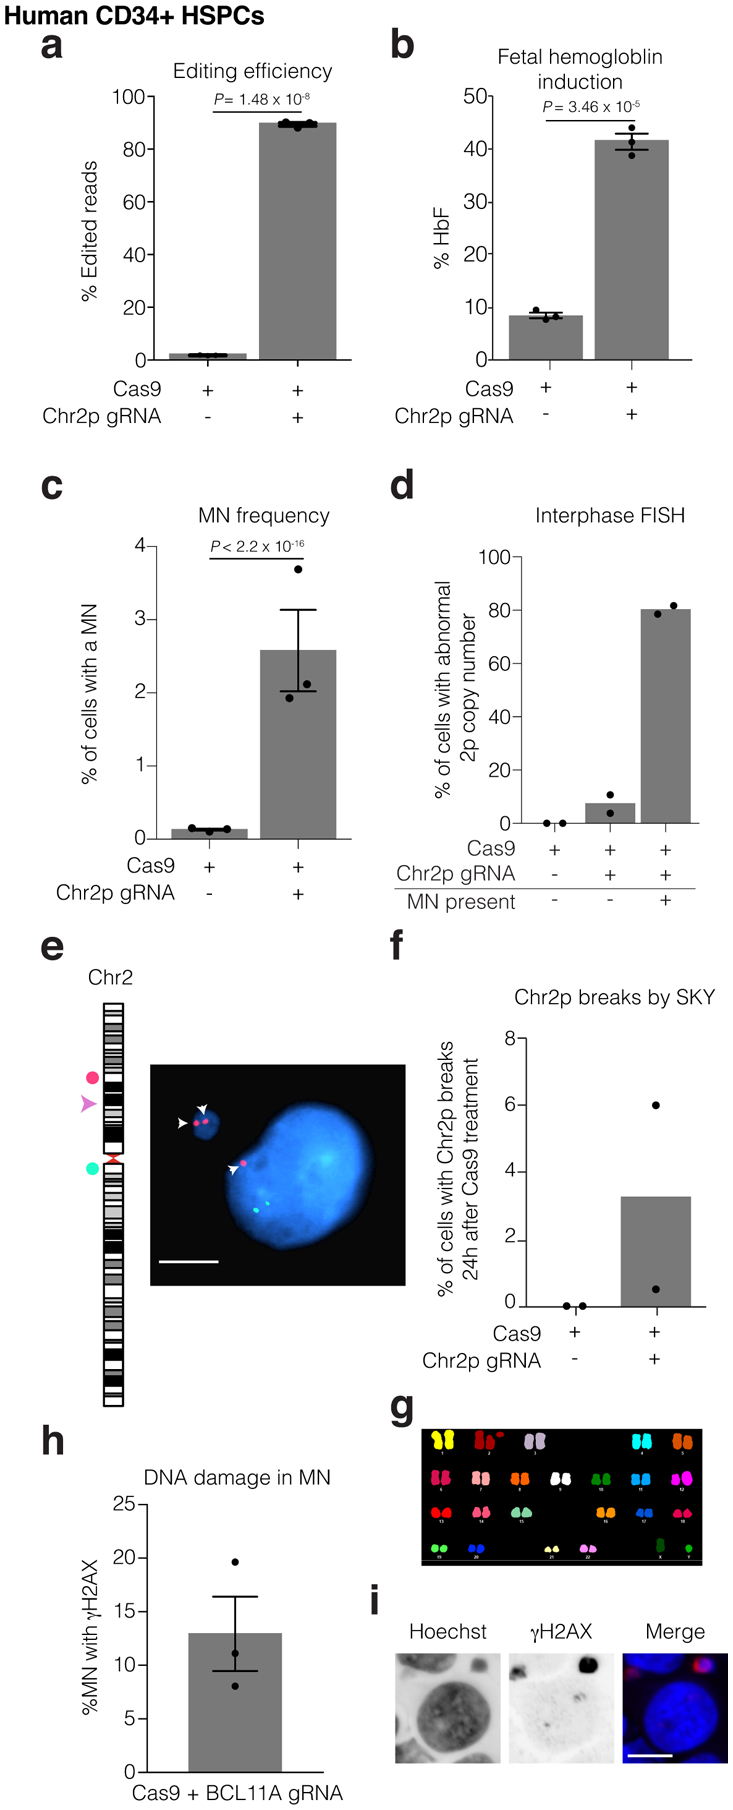
Genome editing has therapeutic potential for treating genetic diseases and cancer. However, the currently most practicable approaches rely on the generation of DNA double-strand breaks (DSBs), which can give rise to a poorly characterized spectrum of chromosome structural abnormalities. Here, using model cells and single-cell whole-genome sequencing, as well as by editing at a clinically relevant locus in clinically relevant cells, we show that CRISPR-Cas9 editing generates structural defects of the nucleus, micronuclei and chromosome bridges, which initiate a mutational process called chromothripsis. Chromothripsis is extensive chromosome rearrangement restricted to one or a few chromosomes that can cause human congenital disease and cancer. These results demonstrate that chromothripsis is a previously unappreciated on-target consequence of CRISPR-Cas9-generated DSBs. As genome editing is implemented in the clinic, the potential for extensive chromosomal rearrangements should be considered and monitored.


Conflict of interest statement

Competing interests

M.J.W. is a consultant for Rubius Inc., Cellarity Inc., Beam Therapeutics, and Esperion; none of the consulting work is relevant to the current project. C.-Z. Z. is a scientific adviser for Pillar BioSciences. D.P. is a member of the Volastra Therapeutics scientific advisory board. All other authors declare no competing interests.

Figures

Extended Data Fig. 1
Extended Data Fig. 1. Micronucleus formation after CRISPR-Cas9 genome editing in several cell lines.
(a) Experimental schemes. Top, RNP transfection. Bottom, inducible Cas9 expression with constitutive expression of gRNAs (RPE-1 cells). G0 cell cycle block was by serum starvation. Dividing cell cartoon represents approximate time of cell division. (b) Micronucleation frequency after CRISPR-Cas9 RNP transfection in asynchronous cells. Left, editing efficiency. Right, frequency of micronucleation for these RNP transfections. (n = 3 experiments with 1339, 1231, 1220, 1236, and 1237 cells scored, left to right). Error bars: mean +/− SEM, two-tailed Fisher’s exact test. (c) Representative Western blot of Cas9 levels at the indicated times after induction with doxycycline. 1st division is 24 hours after serum starve release, and 2nd division is 48 hours after release. Dox is doxycycline. n = 3 experiments. (d) Number of cleaved chromosome arms contained within micronuclei for the indicated gRNAs and Cas9 expression strategies (RPE-1 cells) determined by FISH to detect the centromere (RNP Cas9) and/or subtelomere of the targeted chromosome (RNP Cas9 and Dox-inducible Cas9). RNP Cas9: for 2p: n = 2 experiments with 64 micronuclei counted, 4q: n = 2 experiments with 58 micronuclei counted, 5q: n= 3 experiments with 116 micronuclei counted, Xq: n = 2 experiments with 96 micronuclei counted; (Dox) Doxycycline-inducible Cas9; n = 3 experiments; 168 micronuclei counted per condition. (e) Frequency of micronucleation in synchronized BJ fibroblasts after RNP transfection; (n = 3 experiments with 2378, 2487, 2423, 2714 cells, left to right). Error bars: mean +/− SEM, two-tailed Fisher’s exact test. (f) Left, percentage of MN containing the targeted chromosome arm for the chr5q-targeting gRNA in BJ cells, as counted using subtelomeric FISH probes. Right, the number of chr5q chromosome arms per micronucleus in BJ cells, determined from centromere-specific and subtelomere-specific FISH probes. (n = 2 experiments counting 109 micronuclei). (g) Cut site and FISH probe locations for allele-specific gRNA experiments. PAM sequence is in bold, with the polymorphic site in red. Orange star is the centromere FISH probe and green circle the subtelomere FISH probe. gRNAs target the reference allele. (h) Editing efficiency after Cas9/gRNA RNP transfection with allele-specific gRNAs. (n = 3 experiments). Error bars: mean +/− SEM. (i) Micronucleation frequency from samples in (h). (n = 3 experiments with 7066, 7041, 7253, cells scored for micronucleation, left to right). Error bars: mean +/− SEM, two-tailed Fisher’s exact test. (j) Left, percentage of MN containing the targeted chromosome arm for the allele-specific gRNAs, as scored using subtelomeric FISH probes. Right, pie chart of the number of targeted arms per micronucleus in RPE-1 cells, as determined from subtelomere-specific FISH probes. (n = 3 experiments counting 123 and 184 micronuclei, left to right) Error bars: mean +/− SEM.
Extended Data Fig. 2
Extended Data Fig. 2. DNA damage, nuclear envelope rupture and reduced DNA replication in CRISPR-MN.
(a) Nuclear envelope rupture frequency for CRISPR-MN as compared to spindle checkpoint inhibitor-induced micronuclei. Rupture was defined as an MN:PN ratio of lamin B receptor (LBR) intensity > 3 (n = 3 experiments with 201 and 167 micronuclei analyzed for chr5q, p = 0.2216 and 165 and 152 micronuclei counted for chr6q, p = 0.2034). Error bars: mean +/− SEM, two-tailed Fisher’s exact test. (b) DNA replication defect of CRISPR-MN. EdU fluorescence intensity was measured after a 5-hour pulse. Only cells that had entered S-phase were scored (>150 a.u. EdU signal in primary nucleus). Dotted red line is normal levels of DNA replication in the micronucleus relative to the primary nucleus (n = 3 experiments with 109 and 97 micronucleated cells analyzed for chr5q, p = 0.1698 and 65 and 73 micronucleated cells analyzed for chr6q, p = 0.6948). Error bars: mean +/− SEM; two-tailed Mann-Whitney U-test. (c) CRISPR-MN acquire DNA damage. Shown is the frequency of γH2AX positive micronuclei (> 3 standard deviations above mean signal in primary nuclei) for the indicated gRNAs using the inducible Cas9 system (n = 3 experiments with 203 and 184 micronucleated cells analyzed for chr5q, p = 0.6870 and 175 and 169 cells analyzed for chr6q, p = 0.8053). Error bars: mean +/− SEM, two-tailed Fisher’s exact test. (d) CRISPR-MN acquire DNA damage (RNP Cas9 system). Shown is the frequency of γH2AX positive micronuclei for the indicated gRNAs (n = 2 experiments with 56, 46, 82, and 50 micronucleated cells analyzed, left to right). (e) Example images of data from panel (d) showing γH2AX labeling. White arrows: micronuclei. Scale bars, 5 μm. The γH2AX focus in the primary nucleus likely decorates the centric portion of the broken chromosome. Alternatively, or additionally, it may label a DNA break on the homolog.
Extended Data Fig. 3
Extended Data Fig. 3. Haplotype copy number and SVs for the targeted chromosome for each sample in the paper.
Haplotype-resolved copy number and structural variant analysis for the targeted chromosome for each granddaughter pair. Red and blue dots represent 1 Mb copy number bins for each homolog, and curved lines represent structural variants of ≥ 1 Mb that could be on either homolog. Top, ‘granddaughter a’; middle, ‘granddaughter b’; bottom, sum copy number for each homolog for the pair of cells. Note that in most cases there should be a total of two red and two blue copies per granddaughter pair, and deviation from this represents certain missegregation or events, such as first-generation bridge formation. Copy number alterations occurring only in one daughter without a corresponding or reciprocal change in the other daughter were attributed to random noise due to variability in genome amplification quality. Text: inferred most likely explanation for each copy number and rearrangement profile. Note that alternative explanations exist for many samples, such as a G1 cut followed by replication of the cut chromosome.
Extended Data Fig. 4
Extended Data Fig. 4. Clustering of DNA breakpoints, indicative of chromothripsis, on the telomeric side of the CRISPR-Cas9-targeted cut site.
Breakpoint density for each daughter pair telomeric of the cut-site (red), relative to the rest of the genome (gray), normalized by read depth. Data include both inter- and intra-chromosomal rearrangements. Significance is derived from a one-sided Poisson test (Zhang et al., 2015). p – values are rounded to the nearest exponent, except for those <10−30. Bolded p - values denote significance after Bonferroni correction. Bonferroni-corrected a = 0.0028.
Extended Data Fig. 5
Extended Data Fig. 5. Chromosome bridge formation after CRISPR-Cas9 genome editing.
a) A bridge formed during the first cell division after Cas9 addition yields shared losses (left granddaughter pair) or gains (right granddaughter pair) depending upon how the bridge breaks. This copy number alteration will be on the centromeric side of the CRISPR-Cas9 break. Cells and chromosomes are depicted as in Fig. 3. The non-micronucleated daughter cell is faded and not followed. In this example, the micronuclear chromosome from the first division is not reincorporated and becomes a micronucleus in one granddaughter. b) A bridge formed in the second cell division yields reciprocal copy number gains and losses centromeric of the break (comparing the granddaughters). The non-micronucleated daughter cell is faded and not followed. c) The frequency of detectable chromosome bridges by live-cell imaging after CRISPR-Cas9 genome editing in RPE-1 cells expressing a fluorescence reporter that marks chromosome bridges efficiently (GFP-BAF). DNA breaks were induced with the Chr5q-targeting inducible Cas9 system after treatment with siRNA against TP53 or non-targeting siRNA. Chromosome bridges frequently arise when a micronucleus forms in at least one daughter cell in the first division (MN+), whereas when a micronucleus is not formed, bridge formation is uncommon (MN-). In the second division, micronucleated cells are more prone to bridge formation (MN+) as compared to non-micronucleated cells (MN-). Bridge formation is more frequent in the second division, which may be explained by isolation of the acentric arm from the centric fragment of the chromosome (p53 siRNA: n = 6 experiments with 175 and 172 cell divisions imaged [division 1] and 136 and 132 divisions imaged [division 2]; non-targeting siRNA: n = 3 experiments with 89 and 90 cell divisions imaged [division 1] and 43 and 58 divisions imaged [division 2]). Error bars: mean +/− SEM, two-tailed Fisher’s exact test.
Extended Data Fig. 6
Extended Data Fig. 6. Allele ratios of heterozygous SNPs from CD34+ HSPC colonies after editing.
(a) Map of SNP locations, cut site, and the centromere (CEN) on chromosome 2 (not to scale). (b) The distribution of A-allele frequencies for samples where A-allele and B-allele frequencies comprise greater than 90 % of the sequence reads. The p-values for SNPS 1–8 are p = 0.1089, 0.3140, 0.9967, 0.7792. 0.2751, 0.4659, 0.3178, and 0.2239 respectively (two-tailed Mann-Whitney U test). SNP5 exhibited a strong deviation from a 50:50 allelic ratio even in unedited controls, which may reflect a PCR amplification artifact. Because of this, SNP5 was excluded from subsequent analysis. (c) Heatmap of allele frequency data for all samples (Cas9, left; Cas9 + Chr2p gRNA, right). The heatmap is divided into sections based on the minimum sequencing read depth. Minimum sequencing read depth was defined by the SNP with the lowest number of reads in the sample. Samples with low read depth exhibited high variability in allelic ratios, likely reflecting low input DNA from small colonies. Because we lack phasing information, any deviation from a 50:50 allele ratio for multiple adjacent SNPs suggests segmental copy number alterations. See Supplementary Note for methods and additional discussion. For this experiment, only several hundred clones could feasibly be grown and analyzed, whereas patients will receive tens to hundreds of millions of edited cells. From the several hundred clones in our experiment, we only expect ~20 cells containing micronuclei based on micronucleation rates measured in Fig. 6. Extrapolating from these data, patients will receive millions of micronucleated cells, each one with the potential to undergo chromothripsis and grow into a clone. We note that this assay will not detect copy-number neutral chromothripsis nor chromothripsis that maintains copy number and heterozygosity at the assayed SNPs, with rearrangements located on other segments of the edited chromosome. Moreover, this approach has a limited ability to detect copy number gains or subclonal events that result from ongoing genomic instability triggered by micronucleation or bridging derived from the initial editing.
Figure 1.
Figure 1.. Micronucleation is an on-target consequence of CRISPR-Cas9 genome editing
(a) Schematic of how Cas9 DNA cleavage of a chromosome arm can generate micronuclei. In the shown example cleavage of one sister chromatid occurs in during G2. The centric fragment segregates properly into a daughter nucleus whereas the acentric fragment that cannot be segregated by the spindle is partitioned into a micronucleus. Variations on this outcome include cleavage in G1, cleavage of both sisters in a G2 cell, and cleavage of both homologous chromosomes. (b) Chromosome locations of gRNAs and FISH probes. Magenta arrowheads and numerical coordinates indicate the cut site for specific gRNAs. Green dot: acentric fragment FISH probe locations; red star: centric fragment FISH probe locations. (c) The frequency of micronucleation after CRISPR-Cas9 RNP transfection in p53-proficient RPE-1 cells. Left, editing efficiency after Cas9/gRNA RNP transfection. Right, frequency of micronucleation for these transfections, 46 h after release of RPE-1 cells from a G1 block. (n = 3 experiments with 5311, 5451, 5144, 4555, 5272 cells scored, left to right). Error bars: mean +/− SEM, **** p < 2.2 × 10⁻¹⁶, two-tailed Fisher’s exact test. (d) As in panel C, but for doxycycline-inducible CRISPR-Cas9 with constitutively expressed gRNA. p53 siRNA treatment was performed prior to doxycycline treatment. (n = 3 experiments with 1265, 1261, 1244, 1239 cells scored for micronucleation, left to right). Error bars: mean +/− SEM, two-tailed Fisher’s exact test. (e) Percentage of MN containing the targeted chromosome arm. Left, RNP transfection (n = 2 experiments with 64 and 96 micronuclei scored for chr2p, chrXq, respectively, n = 3 experiments with 83 and 116 micronuclei scored for chr4q, chr5q, respectively). Right, RPE-1 cells with inducible-Cas9 and constitutively expressed gRNA (n = 3 experiments with 168 micronuclei scored for each). Error bars: mean +/− SEM. (f) Example images of FISH analysis after Cas9/gRNA RNP transfection from data in panel (e) (single plane from a confocal imaging stack). Red: centric fragment probe; green: acentric fragment probe; blue: Hoechst stain (DNA); white arrows: micronuclei; white arrowheads: centromeres; dashed white line: outline of Hoechst (DNA) label. Scale bar 5 μm.
Figure 2.
Figure 2.. Summary of genomic outcomes after the division of 18 micronucleated cells
(a) Left, summary table. Reincorporation of the MN DNA was inferred from the absence of detectable extranuclear GFP-H2B signal in either granddaughter. Bridges were inferred from the DNA sequence analysis. Replication of the MN or copy-number neutral LOH was inferred from haplotype-resolved DNA copy number. Fragmentation is evident from reciprocal changes in the DNA copy number along the chromosome arm when comparing the two granddaughters. Multiple classes of genomic events can occur in a single sample, highlighted by sample 2.5 in magenta text. Right, schematic summary of each of the 18 granddaughter cell pairs. Number to the left of the schematics is an ID: first number is the targeted chromosome; second number is a sample identifier for that chromosome. These experiments were performed using inducible Cas9 (chr5q and chr6q gRNAs) and RNP (chr2p gRNA).
Figure 3.
Figure 3.. CRISPR-Cas9 genome editing can cause chromothripsis
(a) Chromothripsis after a micronucleus is reincorporated into a granddaughter cell. Left, cartoon depicting the cellular events leading to the genomic outcomes for CRISPR-Cas9 pair 5.6 (Extended Data Fig. 3). Cells are on the left and chromosomes are depicted on the right. In the first generation, both sisters from one homolog were cleaved in a G2 cell (horizontal dashed line) that divides to generate a micronucleated daughter (left) and a non-micronucleated daughter (right, faded cell not subsequently followed). DNA in the micronucleus is poorly replicated. In the second cell division, the micronuclear chromosome is reincorporated into a granddaughter cell’s primary nucleus. Lightning bolt: DNA damage. Right, plots showing structural variants (SVs) and DNA copy number for haplotype of the cleaved chromosome. Top, intrachromosomal SVs (> 1 Mb) are show by the curved lines. Bottom: copy number plot (1 Mb bins). CEN: centromere. (b) Chromothripsis after the bulk of a micronuclear chromosome fails to be reincorporated into a granddaughter cell primary nucleus for pair 6.3 (Extended Data Fig. 3). Cartoon (left) and SV and copy number plots (right) as in (b). In this example, the two arms from cleaved sister chromatids are fragmented, generating chromothripsis in both daughters.
Figure 4.
Figure 4.. The impact of p53-status on the ability of micronucleated cells to undergo division
(a) p53 loss does not affect the frequency of micronucleation after CRISPR-Cas9 genome editing. Cells, with or without p53 RNAi, were synchronized, released from a G1 block, and chr5q CRISPR-MN were generated by doxycycline-induced Cas9 expression as in Extended Data Fig. 1a bottom scheme. RFP-H2B labeled micronucleated cells were identified ~40 h after release [n = 3 experiments with 1186 and 1234 cells scored, left to right, knockdown of 22.2 – 87.2 % (mean 44.7 %; standard deviation 36.8) of total p53 at 48 h after release from G1 block]. Error bars: mean +/− SEM, p = 0.0801, two-tailed Fisher’s exact test. (b) The results of long-term live-cell imaging is shown as lifetime plots of control and micronucleated cells, with or without p53 knockdown. (n = 3 experiments). Profiles only include cells whose complete cell cycle starting from mitosis was viewed.
Figure 5.
Figure 5.. CRISPR Cas9-genome editing induces chromosome bridge formation, adding to the genome complexity from micronuclei
(a) Evidence for genome editing-induced chromosome bridge in pair 5.5 (Extended Data Fig. 3). Scheme as in Fig. 3. CRISPR-Cas9 cut site is indicated by the dashed line and relevant segments of chr5 are indicated by letters A-C. In the first division, the DNA break on sister chromatids results in the formation of a micronucleus with the acentric portions of chr5 (segment C). At the same time, the sister centric fragments (AB) fuse, generating a dicentric bridge concomitantly with the formation of the micronucleus. Asymmetric breakage of the bridge leads to the loss of the “B” segment from the bridge chromosome in the micronucleated daughter. Faded cell inferred to contain two copies of the B segment was not followed further. DNA copy number analysis indicated that in this example the chromosome fragments in the micronucleus underwent DNA replication. This region showed no detectable rearrangements. Note that the acentric fragments of chr5 were not reincorporated into a daughter primary nucleus in the second division. A (purple): p-arm; B (black): centromere to cut site, inferred to reside in the bridge; C (teal): cut site to the telomere. Bottom: Copy number and rearrangement plots of cells from above, as in Fig. 3. (b) Bridge formation, micronucleation, chromosome fragmentation and chromothripsis from CRISPR-Cas9 genome editing in pair 5.1 (Extended Data Fig. 3). In this sample both homologs were cleaved. The acentric arm of homolog 1 (blue allele) missegregates into a micronucleus in the first generation. The centric fragments of homolog 1 fuse, resulting in a dicentric bridge in the second cell division. After the second cell division, the cell that inherited the acentric fragment of homolog 2 (red) was found to have few SVs or copy number alterations, suggesting it was partitioned into the primary nucleus as indicated in the scheme. By contrast, the acentric segments of homolog 1 were fragmented. Bottom: copy number and rearrangement plots of cells shown above, as in Fig. 3.
Figure 6.
Figure 6.. Hallmark cytological features of chromothripsis after a genome editing approach for the treatment of sickle cell disease
Human CD34+ HSPCs were electroporated with Cas9/gRNA RNP targeting the erythroid-specific enhancer of BCL11A. Microscopic analysis of micronucleation was performed 24 h post electroporation. (a) Editing efficiency of BCL11A determined from amplicon sequencing. n = 3 experiments, Error bars: mean +/− SEM, two-tailed unpaired t-test). (b) Fetal hemoglobin (HbF) levels were measured by HPLC in erythroid-differentiated CD34+ HSPCs as a functional readout of successful editing of BCL11A 10 days after RNP electroporation. n = 3 experiments, Error bars: mean +/− SEM, two-tailed unpaired t-test). (c) Percent of cells with a micronucleus (n = 3 experiments with 7827 and 6480 cells counted, left to right). Error bars: mean +/− SEM, two-tailed Fisher’s exact test. (d) Percent of cells with aberrant 2p copy number assayed by FISH (n = 2 experiments with 1957, 1926, 74, cells counted, left to right). (e) Representative FISH image of data in (d). Cut site is represented by a pink arrowhead; DNA is blue; telomere proximal probe is red, and marked by arrows; centromere proximal probe is green. Shown is a micronucleated cell with 3 copies of the cut arm, two of which are in the micronucleus. Scale bar 5 μm. (f) Chr2p breaks present 24 hours after electroporation in metaphase visualized by SKY (n = 2 experiments, 400 spreads per condition). (g) Sample SKY image from (f). (h) Percent of CD34+ CRISPR-MN with extensive DNA damage covering the DNA present in the micronucleus by γH2AX-labeling (n = 3 experiments, 135 micronuclei scored). Error bars: mean +/− SEM. (i) Representative image of data in (h). Scale bar 5 μm.

Comment in

References

    1. Hsu PD, Lander ES & Zhang F Development and applications of CRISPR-Cas9 for genome engineering. Cell 157, 1262–78 (2014). - PMC - PubMed
    1. Doudna JA The promise and challenge of therapeutic genome editing. Nature 578, 229–236 (2020). - PMC - PubMed
    1. Xu J et al. Correction of sickle cell disease in adult mice by interference with fetal hemoglobin silencing. Science 334, 993–6 (2011). - PMC - PubMed
    1. Orkin SH & Bauer DE Emerging Genetic Therapy for Sickle Cell Disease. Annu Rev Med 70, 257–271 (2019). - PubMed
    1. Wu Y et al. Highly efficient therapeutic gene editing of human hematopoietic stem cells. Nat Med 25, 776–783 (2019). - PMC - PubMed

Publication types

Substances