. 2021 Apr;3(4):485-495.
doi: 10.1038/s42255-021-00373-z. Epub 2021 Apr 12.

Vascular smooth muscle-derived Trpv1+ progenitors are a source of cold-induced thermogenic adipocytes

Affiliations

Vascular smooth muscle-derived Trpv1+ progenitors are a source of cold-induced thermogenic adipocytes

Farnaz Shamsi et al. Nat Metab. 2021 Apr.

Abstract

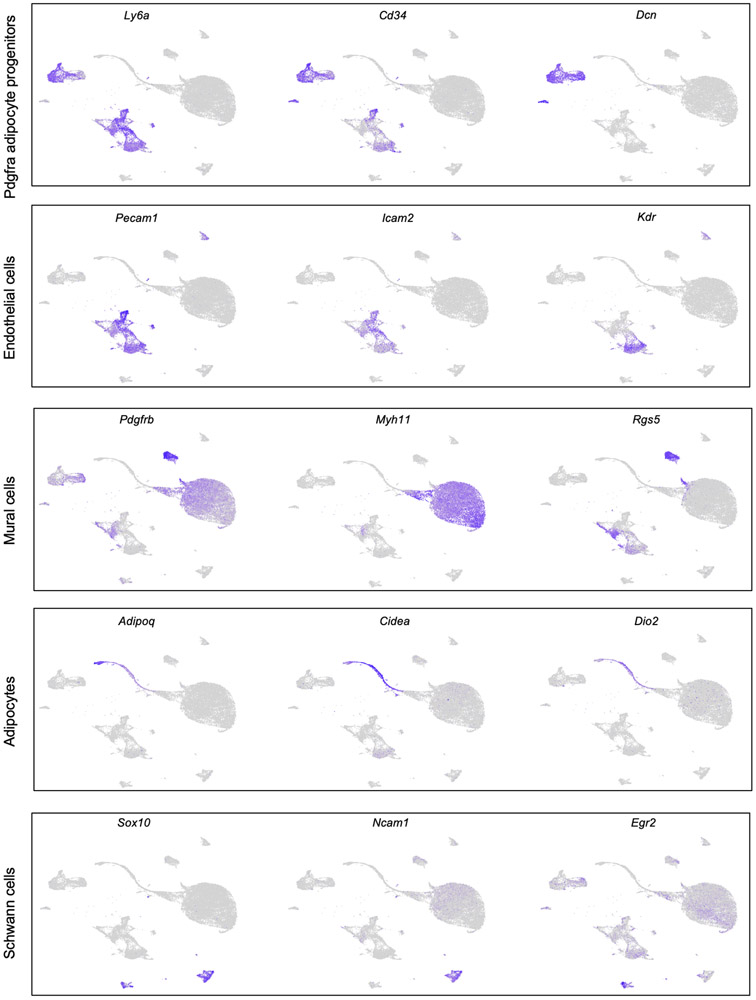
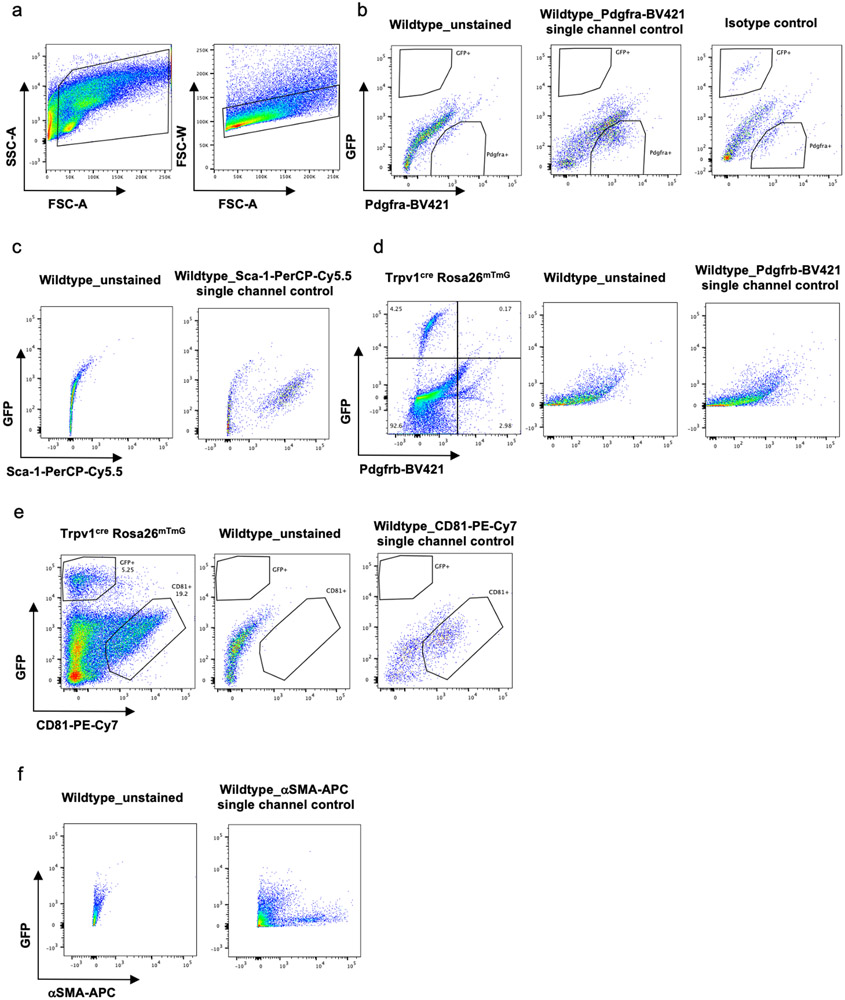
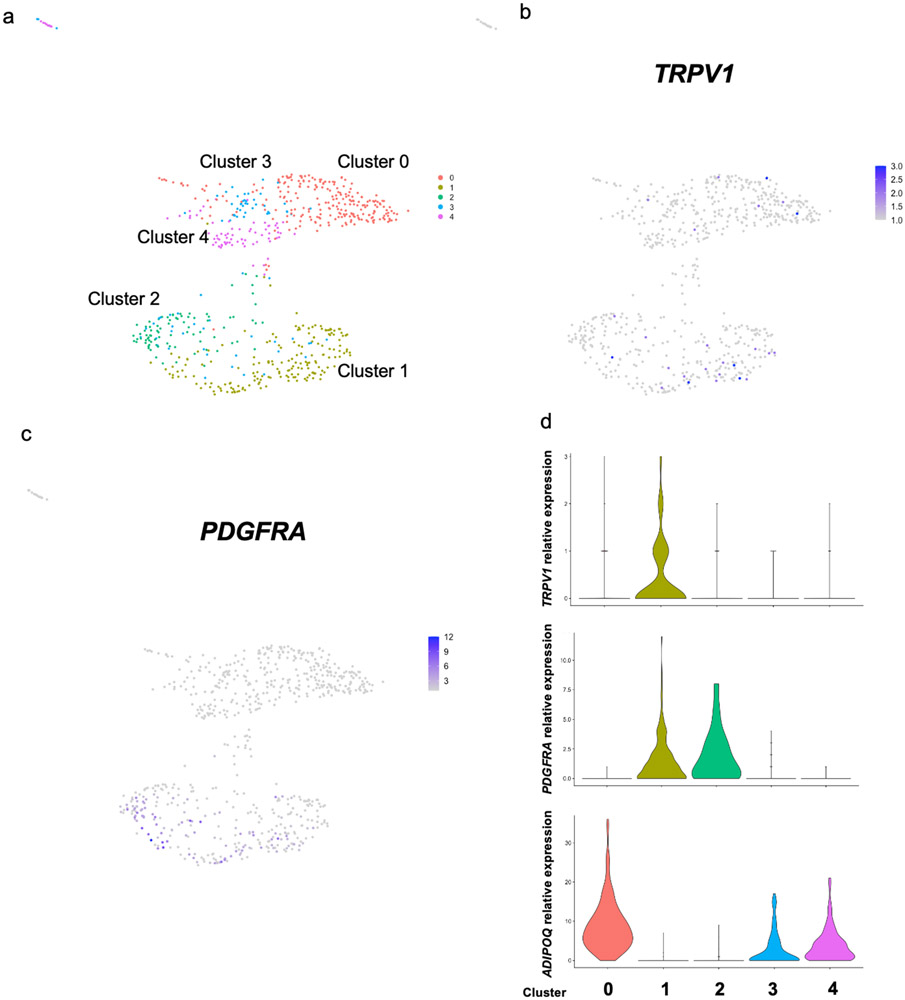
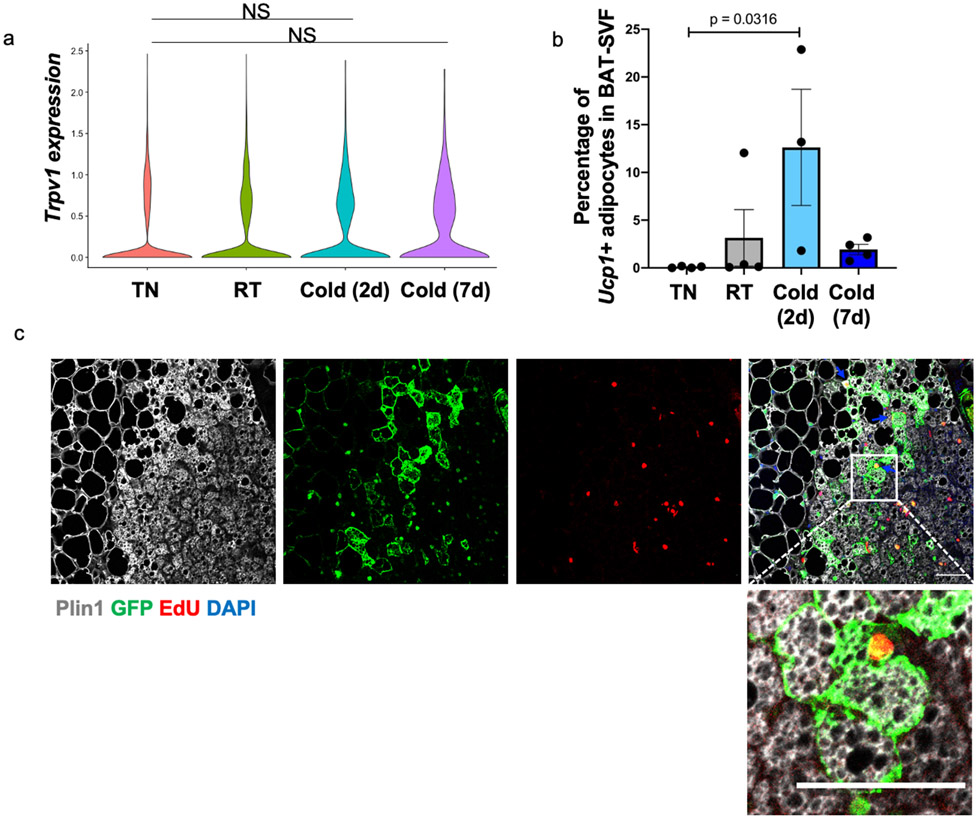
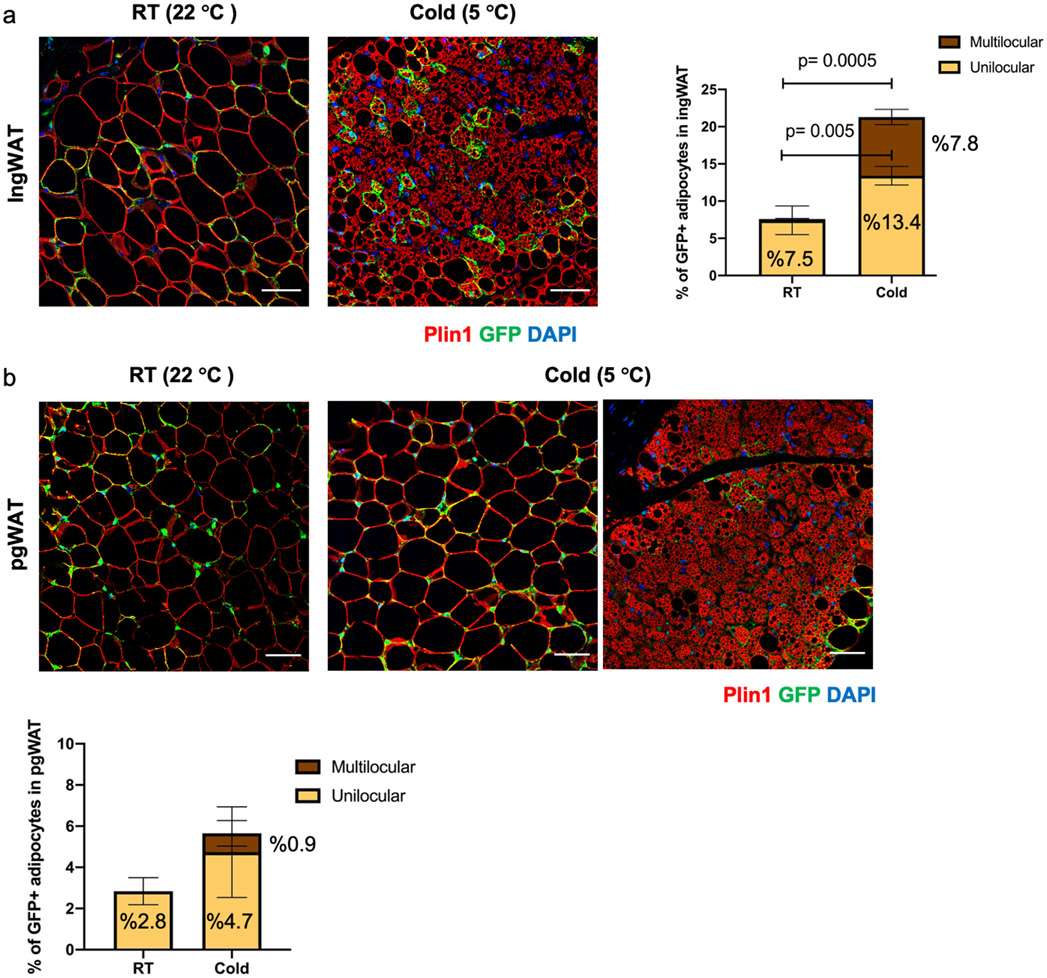
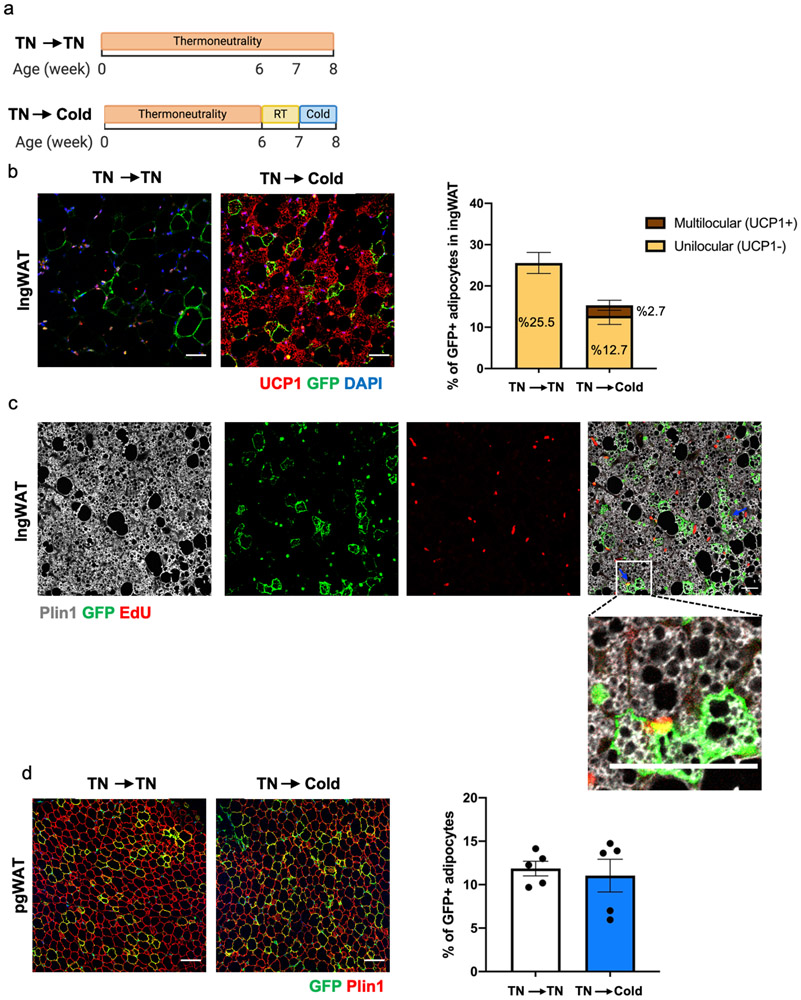
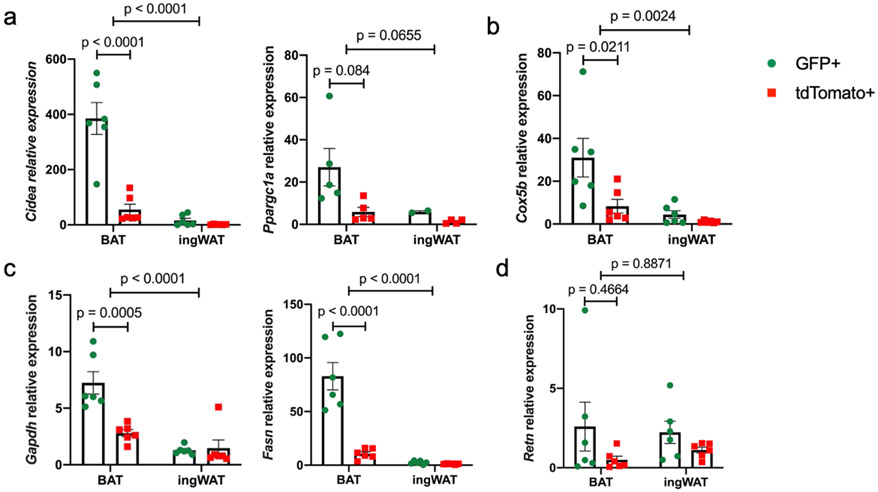
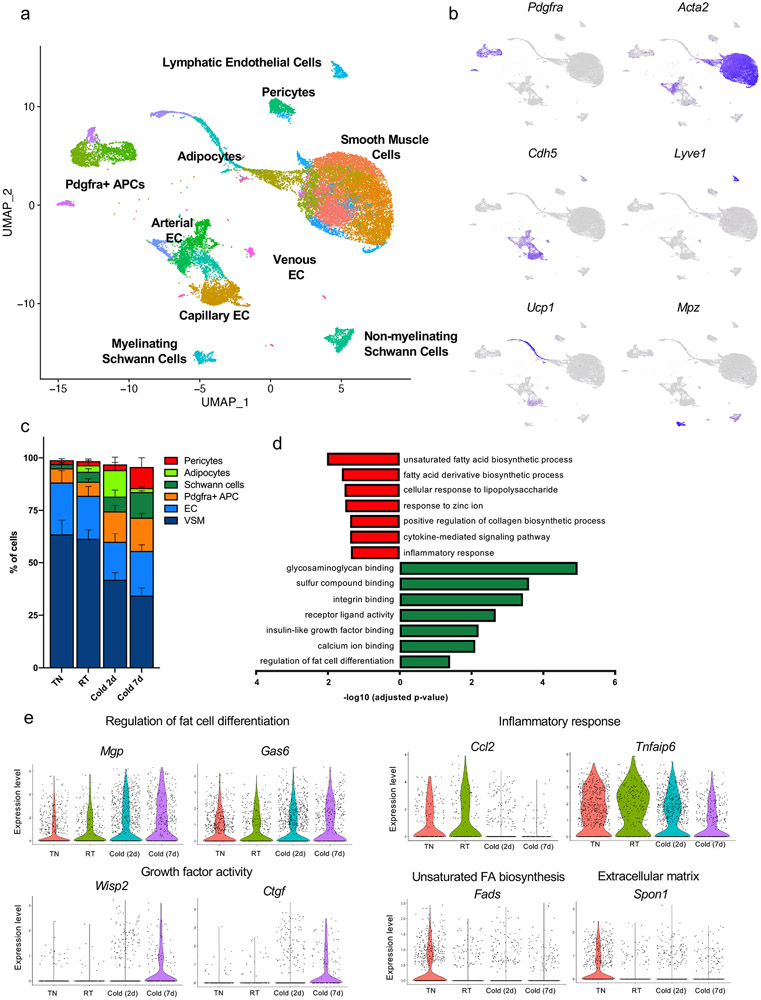
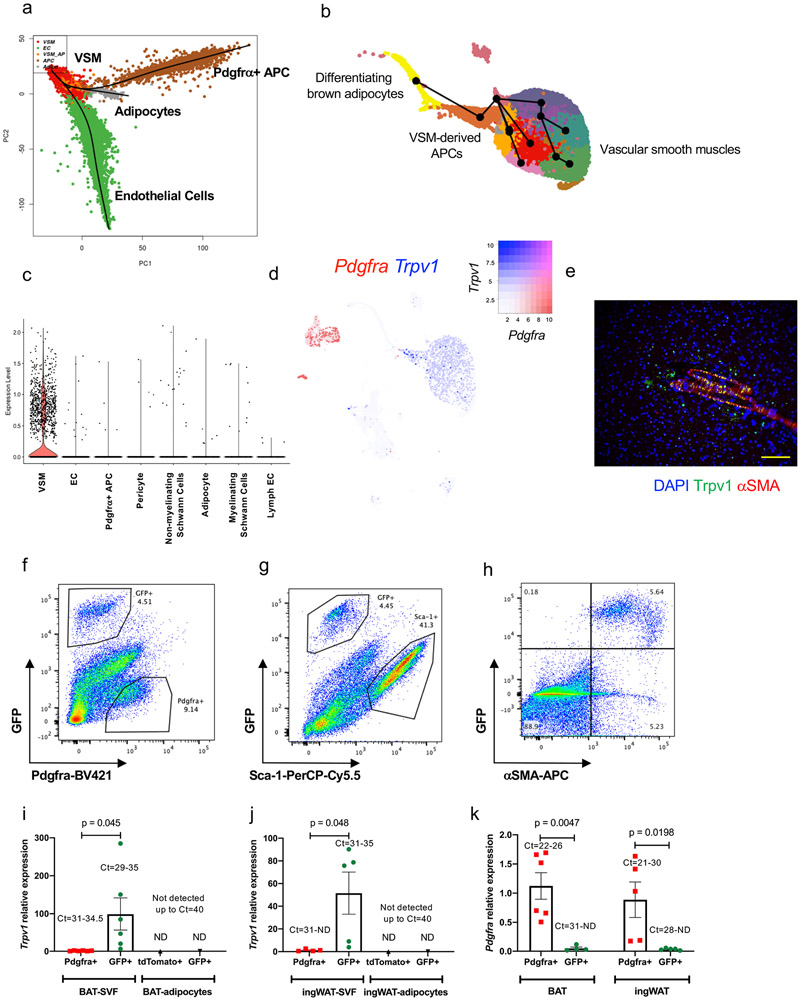
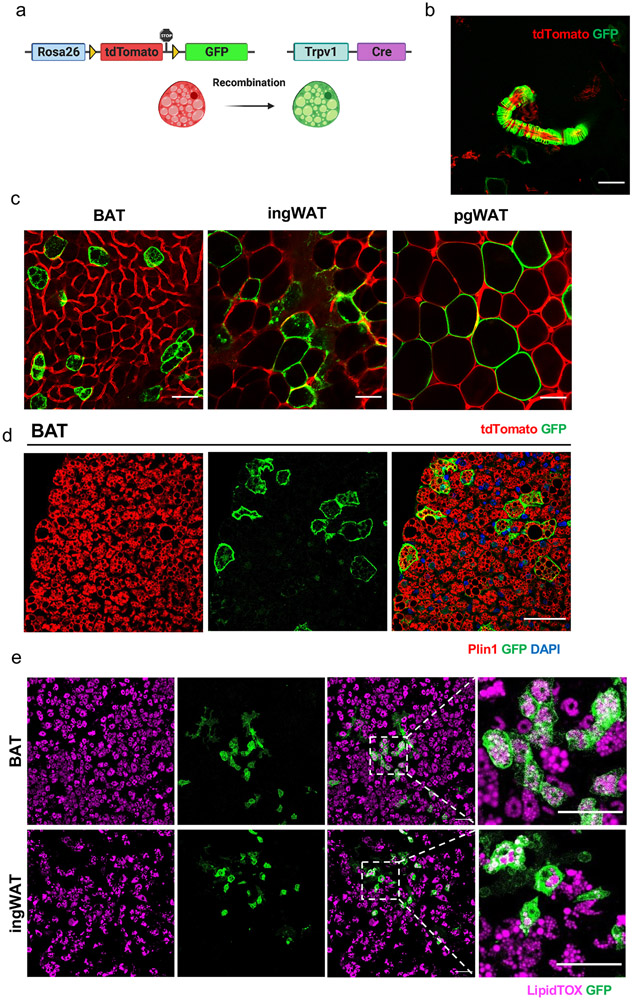
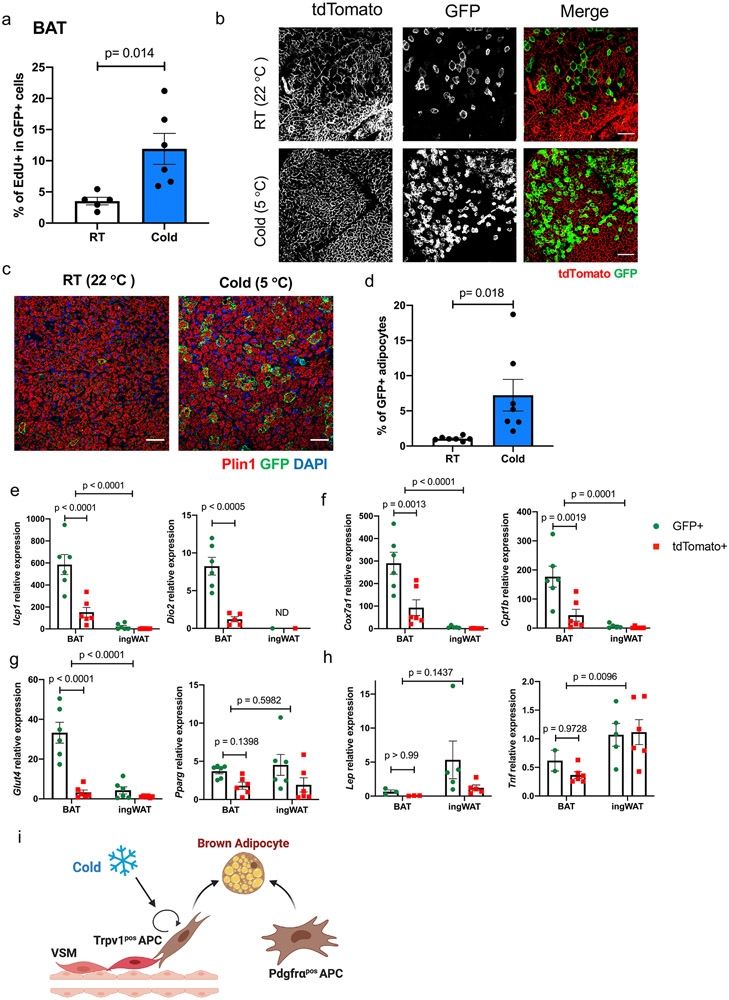
Brown adipose tissue (BAT) and beige fat function in energy expenditure in part due to their role in thermoregulation, making these tissues attractive targets for treating obesity and metabolic disorders. While prolonged cold exposure promotes de novo recruitment of brown adipocytes, the exact sources of cold-induced thermogenic adipocytes are not completely understood. Here, we identify transient receptor potential cation channel subfamily V member 1 (Trpv1)+ vascular smooth muscle (VSM) cells as previously unidentified thermogenic adipocyte progenitors. Single-cell RNA sequencing analysis of interscapular brown adipose depots reveals, in addition to the previously known platelet-derived growth factor receptor (Pdgfr)α-expressing mesenchymal progenitors, a population of VSM-derived adipocyte progenitor cells (VSM-APC) expressing the temperature-sensitive cation channel Trpv1. We demonstrate that cold exposure induces the proliferation of Trpv1+ VSM-APCs and enahnces their differentiation to highly thermogenic adipocytes. Together, these findings illustrate the landscape of the thermogenic adipose niche at single-cell resolution and identify a new cellular origin for the development of brown and beige adipocytes.


Figures

Extended Data Fig. 1
Extended Data Fig. 1. Characterization of cell types present in the BAT-SVF, related to Figure 1.
Individual gene UMAP plots showing the expression levels and distribution of representative marker genes for each cell type.
Extended Data Fig. 2
Extended Data Fig. 2. Cold-induced transcriptional changes in BAT endothelial and Schwann cells, related to Figure 1.
(a) Gene ontology (GO) enrichment analysis of the transcripts significantly upregulated in capillary endothelial cells by cold. (b) Violin plots showing the expression levels and distribution of representative upregulated transcripts for the selected GO terms. (c) Gene ontology (GO) enrichment analysis of the transcripts significantly downregulated in capillary endothelial cells by cold. (d) Violin plots showing the expression levels and distribution of representative downregulated transcripts for the selected GO terms. (e) Gene ontology (GO) enrichment analysis of the transcripts significantly upregulated in Schwann cells by cold. (f) Violin plots showing the expression levels and distribution of representative upregulated transcripts for the selected GO terms. (g) Gene ontology (GO) enrichment analysis of the transcripts significantly downregulated in Schwann cells by cold. (h) Violin plots showing the expression levels and distribution of representative downregulated transcripts for the selected GO terms.
Extended Data Fig. 3
Extended Data Fig. 3. Cold-induced transcriptional changes in vascular smooth muscles of BAT, related to Figure 1.
(a) Gene ontology (GO) enrichment analysis of the transcripts significantly upregulated in vascular smooth muscles by cold. (b) Violin plots showing the expression levels and distribution of representative upregulated transcripts for the selected GO terms. (c) Gene ontology (GO) enrichment analysis of the transcripts significantly downregulated in vascular smooth muscles by cold. (d) Violin plots showing the expression levels and distribution of representative downregulated transcripts for the selected GO terms. (e) Adipogenesis and Fatty acid metabolism gene signatures visualized on UMAP plots using VISION. (f) Pathway enrichment analysis of the top 100 genes driving the trajectory.
Extended Data Fig. 4
Extended Data Fig. 4. Trpv1 expression is restricted to adipose tissue vasculature, related to Figure 2.
Immunohistochemistry for Trpv1 in adipose tissue from mice housed at RT or cold for 7 days. Scale bars=10 μm. N=4 biologically independent animals examined in 1 experiment.
Extended Data Fig. 5
Extended Data Fig. 5. Flow cytometry analysis of adipose tissue SVF, related to Figure 2.
Representative flow cytometry analysis of BAT-SVF derived from Trpv1cre Rosa26mTmG mice. (a) Gating strategy for isolating single SVF cells from BAT-SVF based on side scatter (SSC) and forward scatter (FSC). (b) Unstained, single channel and isotype control gates for GFP and Pdgfrα. (c-f) Unstained and single channel control gates for GFP and Sca-1 (c), Pdgfrβ (d), CD81 (e) and αSMA (f) antibodies.
Extended Data Fig. 6
Extended Data Fig. 6. TRPV1 and PDGFRA expression in human adipose progenitor cells, related to Figure 2.
(a) Unsupervised clustering of adipocytes and adipocyte progenitors in the single nuclei RNA-sequencing of human deep neck adipose tissue with 5 separate clusters indicated in each color. (b) TRPV1 and (c) PDGFRA expression visualized on UMAP plots. (d) Violin plots showing the expression levels and distribution of TRPV1, PDGFRA, and adiponectin (ADIPOQ) expression in each cluster identified in panel a.
Extended Data Fig. 7
Extended Data Fig. 7. Cold recruits adipocytes from the Trpv1pos lineage in BAT, related to Figure 4.
(a) Violin plot showing the Trpv1 expression in BAT-SVF at different housing conditions. (b) Percentage of cells in brown adipocyte cluster at different housing conditions in the scRNA-seq experiment. N=4 per group. Data are presented as Means ± SEM. One-Way ANOVA with Dunnett's multiple comparisons test. (c) EdU detection followed by immunohistochemistry staining for Plin1 and GFP in BAT from mice raised from birth to 6 weeks of age in thermoneutrality and transferred to room temperature (1 week) and cold (1 week). EdU was administered for 1 week at cold. Scale bar=50 μm. N=6 biologically independent animals examined in one experiment.
Extended Data Fig. 8
Extended Data Fig. 8. Cold increases the number of GFPpos adipocytes in ingWAT, related to Figure 4.
(a) Left: Immunohistochemistry staining for GFP and Plin1 in ingWAT from mice housed at room temperature or cold for 7 days. Right: Percentage of GFPpos adipocytes (Plinpos) in ingWAT of Trpv1cre Rosa26mTmG mice housed at RT or cold (5 °C) for 7 days. N=5 mice per group, 4-11 images/mouse. Data are presented as Means ± SEM. Two-Way ANOVA with Sidak's multiple comparisons test. (b) Top: Immunohistochemistry staining for GFP and Plin1 in pgWAT from mice housed at room temperature or cold for 7 days. Bottom: Percentage of GFPpos adipocytes (Plinpos) in pgWAT of Trpv1cre Rosa26mTmG mice housed at RT or cold (5 °C) for 7 days. N=5 mice per group, 4-6 images/mouse. Data are presented as Means ± SEM. Scale bar=50 μm.
Extended Data Fig. 9
Extended Data Fig. 9. Cold recruits GFPpos beige adipocytes in WAT, related to Figure 4.
(a) Schematic presentation of housing conditions utilized in this study. To measure the contribution of the Trpv1 lineage to newly recruited beige adipocytes, Trpv1cre Rosa26mTmG mice were raised from birth in thermoneutrality to minimize beige adipogenesis, after which a cohort of animals was first moved to room temperature for one week followed by one week of cold exposure (TN → Cold). The control group was kept at TN the whole time (TN → TN). (b) Left: Immunohistochemistry staining for UCP1 and GFP in ingWAT. Right: Percentage of UCP1neg (unilocular) and UCP1pos (multilocular) GFPpos adipocytes in each group. N=5 mice per group, 6-11 images/mouse. Data are presented as Means ± SEM. Scale bar=50 μm. (c) EdU detection followed by immunohistochemistry staining for Plin1 and GFP in ingWAT from mice housed in the TN → Cold condition. EdU was administered for 1 week at cold. Scale bar=100 μm. N=2 biologically independent animals examined in one experiment. (d) Left: Immunohistochemistry staining for Plin1 and GFP in pgWAT. Right: Percentage of GFPpos adipocytes in each group. N=5 mice per group, 4-5 images/mouse. Data are presented as Means ± SEM. Scale bar=100 μm.
Extended Data Fig. 10
Extended Data Fig. 10. Brown adipocytes derived from the Trpv1pos progenitors are highly thermogenic, related to Figure 4.
(a-d) Expression of the indicated transcripts in tdTomatopos and GFPpos adipocytes isolated from BAT and ingWAT of Trpv1cre Rosa26mTmG mice housed at cold for 7 days. N=6 mice per group. Data are presented as Means ± SEM. Two-Way ANOVA with Sidak's multiple comparisons test.
Figure 1.
Figure 1.. Single cell RNA-sequencing reveals the remodeling of brown adipocyte niche by cold.
(a) Unsupervised clustering of 24,498 non-immune cells from the BAT-SVF of 9-week old male C57BL/6J mice housed at TN (30 °C, 7 days), RT (22 °C), Cold (5 °C, 2 and 7 days) represented on a UMAP. (b) Individual gene UMAP plots showing the expression levels and distribution of representative marker genes. (c) The percentage of cells present in each cluster at different housing conditions. N=4 biologically independent animals examined in one experiment. Data are presented as Means ± SEM. (d) Gene ontology (GO) enrichment analysis of the transcripts significantly upregulated (green) and downregulated (red) by cold in Pdgfrαpos adipocyte progenitors. (e) Violin plots showing the expression levels and distribution of representative transcripts for the selected GO terms.
Figure 2.
Figure 2.. Lineage trajectory analysis predicts the contribution of Trpv1pos VSMs to brown adipogenesis.
(a) Lineage trajectory analysis using Slingshot. Trajectories were calculated for the merged Seurat cell clusters, specifying the adipocyte cluster as the end state. (b) Pseudotime curves calculated by the Slingshot method using the UMAP coordinates and cell clusters for the vascular smooth muscle cells and adipocytes. (c) Violin plots showing the Trpv1 expression in different cell types present in BAT. (d) UMAP plot showing the expression of Trpv1 and Pdgfrα in BAT-SVF. (e) Immunohistochemistry for Trpv1 and αSMA in BAT. Scale bar=10 μm. N=4 biologically independent animals examined in 3 independent experiments. (f-h) Representative flow cytometry analysis of BAT-SVF derived from Trpv1cre Rosa26mTmG mice stained with (f) Pdgfrα, (g) Sca-1, and (h) αSMA. (i,j) Gene expression of Trpv1 in Pdgfrαpos and GFPpos cells in SVF and tdTomatopos and GFPpos mature adipocyte isolated from (i) BAT and (j) ingWAT of Trpv1cre Rosa26mTmG mice. N=6 per group. Data are presented as Means ± SEM and analyzed by unpaired two-sided t-test. (k) Gene expression of Pdgfrα in tdtomatopos and GFPpos cells in SVF isolated from BAT and ingWAT of Trpv1cre Rosa26mTmG mice. N=6 per group. Two-way ANOVA with Sidak's multiple comparisons test.
Figure 3.
Figure 3.. Genetic lineage tracing confirms that Trpv1pos cells give rise to brown and white adipocytes.
(a) Scheme of Trpv1cre Rosa26mTmG lineage tracing model. (b) Representative whole-mount microscopy image of BAT showing the GFP labeling of VSMs. Scale bar=50 μm (c) Whole-mount microscopy for GFP and tdTomato fluorescence in BAT, ingWAT, and pgWAT in Trpv1cre Rosa26mTmG mice. Scale bar=50 μm. (d) Immunohistochemistry staining for GFP and Plin1 in BAT. Scale bar=50 μm. Experiments in b-d were repeated in at least eight independent expeiments. (e) LipidTOX and GFP staining in the in vitro differentiated primary SVF cells isolated from the BAT and inWAT of Trpv1cre Rosa26mTmG mice. Scale bar=100 μm. N=3 biologically independent animals examined in one experiment.
Figure 4.
Figure 4.. Cold exposure induces the proliferation and differentiation of Trpv1pos adipocyte progenitors to highly thermogenic adipocytes.
(a) Percentage of EdU labeling in the GFPpos cells in BAT of Trpv1cre Rosa26mTmG mice housed at RT or cold (5 °C) for 7 days. N=11 (RT) and N=12 (Cold) biologically independent animals examined over 2 independent experiments. Data are presented as Means ± SEM and analyzed by unpaired two-sided t-test. Results from one representative experiment are shown. (b) Whole-mount microscopy for GFP and tdTomato fluorescence in BAT of Trpv1cre Rosa26mTmG mice housed at RT or Cold for 7 days. Scale bar=50 μm. N=13 per group biologically independent animals examined over 3 independent experiments (c) Immunohistochemistry staining for GFP and Plin1 in BAT from mice housed at room temperature or cold for 7 days. Scale bar=50 μm. (d) Percentage of GFPpos adipocytes (Plinpos) in BAT of Trpv1cre Rosa26mTmG mice housed at RT or cold (5 °C) for 7 days . N=7 per group biologically independent animals examined in one experiment, 3-9 images/animal. Data are presented as Means ± SEM and analyzed by unpaired two-sided t-test. (e-h) Expression of the indicated transcripts in tdTomatopos and GFPpos adipocytes isolated from BAT and ingWAT of Trpv1cre Rosa26mTmG housed at cold (5 °C) for 7 days. N=6 mice per group. Data are presented as Means ± SEM. Two-Way ANOVA with Sidak's multiple comparisons test. (i) Model depicting the two types of adipocyte progenitors contributing to thermogenic adipocyte pool in adult mice.

Comment in

References

    1. Kajimura S & Saito M A new era in brown adipose tissue biology: molecular control of brown fat development and energy homeostasis. Annu Rev Physiol 76, 225–249, doi:10.1146/annurev-physiol-021113-170252 (2014). - DOI - PMC - PubMed
    1. Nedergaard J, Wang Y & Cannon B Cell proliferation and apoptosis inhibition: essential processes for recruitment of the full thermogenic capacity of brown adipose tissue. Biochim Biophys Acta Mol Cell Biol Lipids 1864, 51–58, doi:10.1016/j.bbalip.2018.06.013 (2019). - DOI - PubMed
    1. Hepler C, Vishvanath L & Gupta RK Sorting out adipocyte precursors and their role in physiology and disease. Genes Dev 31, 127–140, doi:10.1101/gad.293704.116 (2017). - DOI - PMC - PubMed
    1. Berry DC, Stenesen D, Zeve D & Graff JM The developmental origins of adipose tissue. Development 140, 3939–3949, doi:10.1242/dev.080549 (2013). - DOI - PMC - PubMed
    1. Seale P et al. PRDM16 controls a brown fat/skeletal muscle switch. Nature 454, 961–967, doi:10.1038/nature07182 (2008). - DOI - PMC - PubMed

Publication types

MeSH terms

Substances