. 2021 Apr;3(4):469-484.
doi: 10.1038/s42255-021-00380-0. Epub 2021 Apr 12.

Defining the lineage of thermogenic perivascular adipose tissue

Affiliations

Defining the lineage of thermogenic perivascular adipose tissue

Anthony R Angueira et al. Nat Metab. 2021 Apr.

Abstract

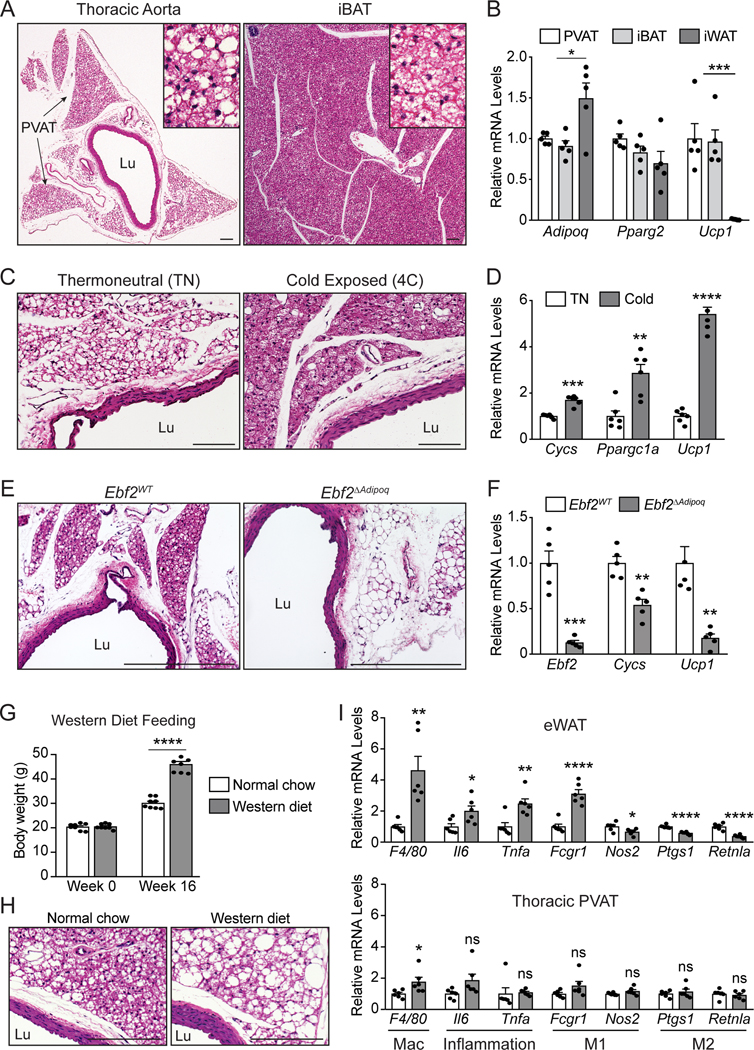
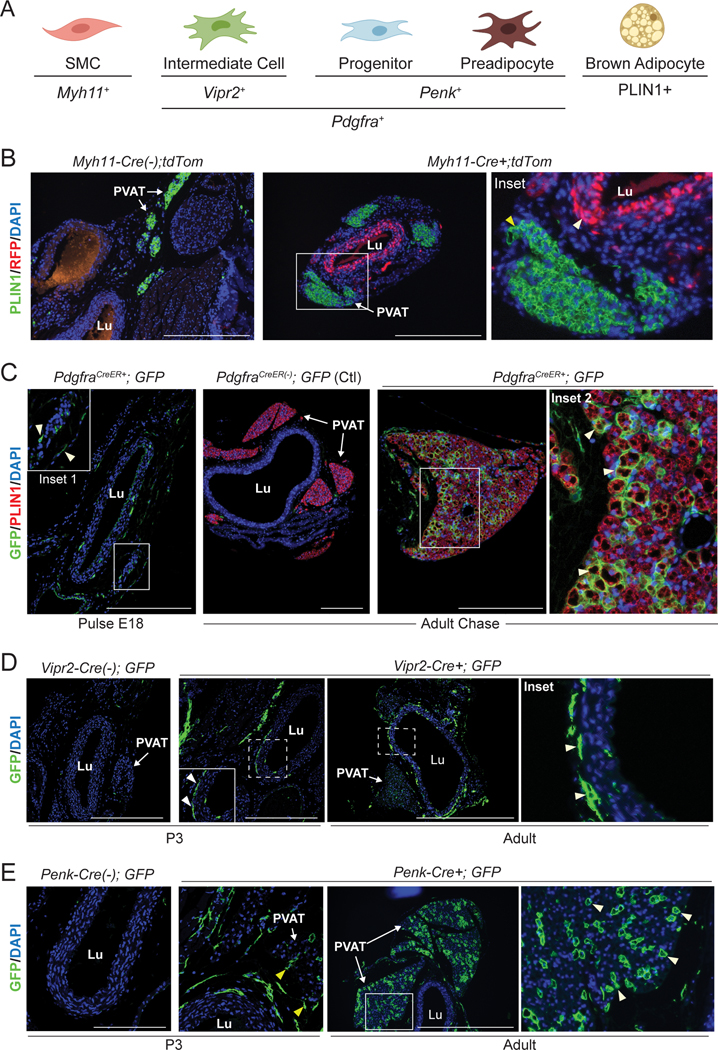
Brown adipose tissue can expend large amounts of energy, and therefore increasing its size or activity is a promising therapeutic approach to combat metabolic disease. In humans, major deposits of brown fat cells are found intimately associated with large blood vessels, corresponding to perivascular adipose tissue (PVAT). However, the cellular origins of PVAT are poorly understood. Here, we determine the identity of perivascular adipocyte progenitors in mice and humans. In mice, thoracic PVAT develops from a fibroblastic lineage, consisting of progenitor cells (Pdgfra+, Ly6a+ and Pparg-) and preadipocytes (Pdgfra+, Ly6a+ and Pparg+), which share transcriptional similarity with analogous cell types in white adipose tissue. Interestingly, the aortic adventitia of adult animals contains a population of adipogenic smooth muscle cells (Myh11+, Pdgfra- and Pparg+) that contribute to perivascular adipocyte formation. Similarly, human PVAT contains presumptive fibroblastic and smooth muscle-like adipocyte progenitor cells, as revealed by single-nucleus RNA sequencing. Together, these studies define distinct populations of progenitor cells for thermogenic PVAT, providing a foundation for developing strategies to augment brown fat activity.


Figures

Extended Data Fig. 1
Extended Data Fig. 1. Single cell transcriptional profiling of aortas from E18 and P3 mice
(A) UMAPs of gene expression in cells from E18 and P3 thoracic aorta of pooled CD1 mice. (B-F) UMAPs showing expression of indicated genes for: smooth muscle cells (SMC) (B); Intermediate cells (C); Progenitors (D); Preadipocytes (E); and Adipocytes (F). (G) Expression dotplot of indicated genes for cell clusters from P3 aorta.
Extended Data Fig. 2
Extended Data Fig. 2. Purification of smooth muscle and fibroblast cells from aorta (Related to Fig. 3)
(A) FACS isolation of fibroblastic and smooth muscle cell (SMC) populations. Dissociated cells were gated on: (1) SSC-A and FSC-A to exclude debris; (2) FSC-H vs. FSC-W then SSC-H vs. SSC-W to isolate single cells; and (3) live (FVS510-) Lin- (CD45-,CD31-,Ter119-) cells. Depicted sort gates were used to isolate the following populations: Progenitors [LY6A high], Preadipocytes (PreAd) [LY6A(−), CD142 mid; CD200(−)]; SMCs [LY6A(−); CD142(−); CD200+], Intermediate Cells (Int) [LY6A(−); CD142+; CD200+, CD317(−)], Meso (Mesothelium) [LY6A(−); CD142+; CD200+, CD317+] (Representative images from n=10 expts). Related to experiments shown in Figs. 3A and Fig 5. (B) Violin plots showing expression of genes used in the sorting strategy. (C) Staining of CD200 (red), MYH11 (green), and DAPI (blue) in P3 thoracic aorta. White arrowhead shows an Intermediate cell. Yellow arrowhead shows an SMC (scale bar, 65 μm; Lu: lumen). Representative of n=1 experiment. (D) Expression of Seurat cluster-defining genes in the sorted cell bulk RNAseq datasets. Gene levels in sorted cell populations were compared to the row mean and annotated as “enriched” or “de-enriched” (Log2 FC>0.25).
Extended Data Fig. 3
Extended Data Fig. 3. Expression profiles for Cre-driver mouse lines (Related to Fig. 4)
(A) UMAPs showing expression of genes used for Cre and CreER driver mouse strains. (B) Vipr2 expression levels in indicated cell types from sorted cell bulk RNAseq analysis. (One way ANOVA followed by two sided pairwise comparisons with Holm Sidak correction. n=3 biologically independent samples per group; mean +/− SEM). Statistical Testing: ****p≤0.0001.
Extended Data Fig. 4
Extended Data Fig. 4. Gene profiling analyses of iWAT vs. PVAT progenitors and preadipocytes (Related to Fig. 5)
(A) mRNA levels of indicated genes in differentiated primary adipocytes from: iWAT preadipocytes, aortic PVAT progenitors, aortic PVAT preadipocyte cells (all from P3 CD1 mice). Second experimental replicate performed on different day (n=2 PVAT Pread; n=3 PVAT Progenitor; n=4 iWAT Pread independent wells per group from pooled FACS samples; mean+/− SEM). (B) Z-Score split heatmap of genes from overlaps depicted in Fig. 5C,D. Gene expression levels are calculated between cell types (i.e. PVAT Progenitors vs PVAT PreAd) within a tissue of origin (n=3 biological replicates). (C) Expression heatmap of all cell cycle genes (used by Seurat) in sorted progenitor and preadipocyte cells from iWAT and thoracic aortic PVAT. Data comes from DESeq2 normalized count data (bulk RNAseq). (D) Pathway analysis of genes enriched in preadipocytes from PVAT vs. iWAT (significantly differentially expressed and LFC>0). Graph plots -log10 unadjusted p values. P values were calculated using clusterProlifer with WikiPathways2019 annotations using the hypergeometric distribution. Padjusted for multiple comparisons was calculated with FDR. Padjusted in order (2.48E-34, 1.07E-20, 1.31E-15, 2.97E-13, 1.37E-12, 2.01E-10, 1.71E-07, 2.66E-07, 1.84E-05).
Extended Data Fig. 5
Extended Data Fig. 5. Purification and analysis of aorta-associated cells from adult animals (Related to Fig. 6)
(A) Expression dot plot of indicated genes in cell clusters from adult aorta. (B) mRNA in situ hybridization of Ly6a (green) in adult aorta. Arrowhead in inset shows progenitor cell. DAPI (blue) stains nuclei. (scale bar, 362.3 μm). Lu: lumen. Representative of n=2 experiments. (C) mRNA in situ hybridization of Pi16 (green) and Bace2 (red). White arrowhead shows progenitor cell. Yellow arrowhead shows intermediate cell (scale bar, 145 μm). Representative of n=2 experiments. (D) UMAPs showing Cd81 and Prdm16 expression. (E) Violin plots showing expression of indicated genes used for sorting. (F) FACS isolation of fibroblasts and smooth muscle cells (SMCs). To exclude debris and isolate single live cells, we gated on: (1) SSC-A and FSC-A; (2) FSC-H vs FSC-W; and (3) SSC-H vs SSC-W. We then gated on Live (DAPI-); Lin- (CD45-,CD31-,TER119-) cells. Further selection was used to isolate: Intermediate Cells [PDGFRa+, MCAM(−), CD200+], Progenitors [PDGFRa+, MCAM(−), CD200(−)], SMC1 [PDGFRa(−), MCAM+, CD200+], SMC2 [PDGFRa(−), MCAM+, CD200(−)]. (Representative image of 6 separate experiments). Related to experiments shown in Fig. 6D and Fig. 7A, C. (G) Expression of Seurat cluster-defining genes in the sorted cell bulk RNAseq datasets. Gene levels in sorted cell populations were compared to the row mean and annotated as “enriched” or “de-enriched” (Log2 FC>0.25). (H, I) Expression heatmap of Seurat cluster-defining genes mapped on to sorted-cell RNASeq results for fibroblast (H) and SMC populations (I) (n=3).
Extended Data Fig. 6
Extended Data Fig. 6. Analysis of aortic PVAT in adult mice (Related to Fig. 7)
(A) Staining for MYH11 (red) and PLIN (green) in aortas of Rosiglitazone (Rosi)-treated mice, scale bar 200 μm. Representative of n=1 experiment. Scale bar, 200 μm. (B) mRNA levels of Trpv1 and Gli1 in sorted cell populations. (C) Staining of GFP (green) and either PLIN1 or UCP1 (red) in aortas of male Trpv1-Cre; mTmG mice housed at thermoneutrality or following 1 week of 4C cold exposure. Scale bar, 100 μm. (D) Staining of TAGLN (red) in adult aorta. White arrowheads show adventitial SMCs. Yellow arrowhead indicates parenchymal SMCs of the aorta. Representative of n=2 experiments. Scale bar, 271.8 μm. (E) H&E staining of adult aorta. Arrowheads show adventitial blood vessel. (F) Staining of GFP (green) in aortas of Pdgfra-CreER+; mTmG+ mice following a 5-day pulse of Tamoxifen and a 2.5 week treatment with DMSO or Rosi. Arrowheads=GFP+ adipocytes (n=1 Cre-; n=4 DMSO; n=5 Rosi; scale bar, 543.5 μm). (G) Staining of GFP (green) in aortas of Pdgfra-CreER+; mTmG+ mice following a 5-day pulse of Tamoxifen and 2-week chase at room temperature or 4C (cold). Representative of n=1 experiment. Scale bar, 100 μm (H) Staining of GFP (green) in aortas of CreER- Ctl and Gli1-CreER+; mTmG+ mice following a 5-day pulse with Tamoxifen and 2.5-week treatment with DMSO or Rosi. (n=1 Cre-; n=3 Cre+; DMSO; n=3 Cre+; Rosi scale bar, 543.5 m). DAPI (blue) was used to stain nuclei.
Extended Data Fig. 7
Extended Data Fig. 7. Single nucleus transcriptomic analyses of human PVAT (Related to Fig. 7)
(A) UMAP of gene expression in 18,758 nuclei from adult human peri-aortic PVAT (Full dataset, n=3 humans, integrated analysis). (B) Expression dotplot of indicated genes in dataset from (A). (C, D) Violin plots (C) and UMAPs (D) showing expression of select genes, corresponding to the subclustered dataset in Fig. 7D. (E) Pathway analysis of cluster defining genes (average logFC>0.5) in SMC and PPARg+ SMC-like cells compared to all other clusters in the dataset from Fig. 7D. Graph plots -log10 unadjusted p values. P values were calculated using clusterProlifer with WikiPathways2019 annotations using the hypergeometric distribution. Padjusted for multiple comparisons was calculated with FDR. Padjusted in order SMC (1.59E-07, 2.50E-06, 2.75E-06, 0.000106107, 0.000968522, 0.000968522, 0.001899498); PPARg+ SMC Like Cells (5.75E-05, 0.000135397, 0.003396457, 0.00971142, 0.00971142, 0.010636022, 0.010636022). (F) Violin plots showing expression of select marker genes in the fibroblastic populations from Fig. 7D. (G) UMAP of gene expression in 7285 nuclei from adult human deep neck BAT (subclustered to remove immune and endothelial cells, n=16 humans, integrated analysis, re-analyzed data from: Sun et al 2020). (H-J) UMAPs (H), expression dotplot (I) and violin plots (J) showing expression of select genes in cells from the dataset above (G).
Fig.1
Fig.1. Aortic PVAT expresses an EBF2-regulated classical brown fat program.
(A) H&E staining of thoracic aorta and iBAT from C57/Bl6 mice (scale bar, 100 μm) Representative images of n=5 experiments. (B) mRNA levels of indicated genes in thoracic PVAT, iBAT, and iWAT from C57/Bl6 mice. (n=5 mice per group; mean+/−SEM). One way ANOVA with Holm Sidak multiple corrections (Adipoq: p= 0.0228; Ucp1: p= 0.0005). (C, D) H&E staining (C) and mRNA levels of indicated genes (D) in thoracic aorta from C57/Bl6 mice housed at thermoneutrality or 4°C for one week (n=6 mice per group; mean+/−SEM; scale bar, 100 μm). Two sample, two-sided t-test (Cycs: p= 0.0000188; Ppargc1a: p= 0.00171; Ucp1: p= 0.0000000747). (E, F) H&E staining of thoracic aorta (E) and mRNA levels of indicated genes in aortic PVAT (F) from Ebf2WT and Ebf2ΔAdipoq mice (n=5 mice per group; mean+/−SEM; scale bar, 362.3 μm). Two sample, two-sided t-test (Ebf2: p=0.000194; Cycs: p=0.00144; Ucp1: p=0.00233). (G) Body weights of C57/Bl6 mice fed normal chow or western diet for 16 weeks (n=8 mice per group; mean+/−SEM). Two way-repeated measures ANOVA with Holm Sidak multiple correction (p<0.0001). (H, I) H&E staining of thoracic aorta (H) and mRNA levels of indicated genes in eWAT and thoracic PVAT (I) from above mice. (n=6 mice per group; mean+/− SEM). Two sample, two-sided t-test (PVAT [F4/80: p=0.0347]; eWAT [F4/80: p=0.00271; Il6: p=0.0246; Tnfa: p=0.00420; Fcgr1: p=0.000052; Nos2: p=0.0334; Ptgs1: p=0.000027; Retnla: p=0.000052). Statistical Testing: NS p>0.05, **p≤0.01, ***p≤0.001, ****p≤0.0001. Lu: vessel lumen.
Fig. 2
Fig. 2. Identification of multiple fibroblast populations in developing aortic PVAT
(A) H&E staining of retroperitoneum en bloc from E18 and P3 CD1 mice (scale bar, 517.6 μm). Representative of n=3 experiments. (B) mRNA levels of indicated genes in thoracic aorta from E18 and P3 CD1 mice (n=3 biological replicates of pooled aortas; mean+/−SEM). Two sample, two-sided t-test (Adipoq: p= 0.000011; Lep: p= 0.000618; Pparg2: p= 0.000016; Ucp1: p= 0.0002). (C) UMAP of gene expression in 17,957 cells from P3 thoracic aorta of P3 CD1 mice. (D) UMAP showing expression of smooth muscle marker genes (left) and immunostaining of PDGFRa (red) and MYH11 (green) in sections of E18 thoracic aorta (right) (scale bar, 271.8 μm). Representative of n=2 experiments. (E) UMAP showing expression of adipocyte marker genes (left) and immunostaining of PLIN1 (red) in P3 thoracic aorta. (scale bar, 543.5 μm). Representative of n=3 experiments. (F) UMAP showing expression of preadipocyte marker genes and immunostaining of PPARg (red) and PDGFRa (green) in P3 thoracic aorta. Arrowheads show preadipocytes (scale bar, 135.9 μm). Representative of n=2 experiments. (G) UMAP showing expression of intermediate cell genes and mRNA in-situ hybridization of Bace2 (red) in P3 thoracic aorta. Arrowheads indicate intermediate cells. (scale bar, 145 μm). Representative of n=2 experiments. (H) UMAP showing expression of the progenitor marker gene Pi16 (left) and mRNA in-situ of hybridization of: (1) Pi16 (green) (middle); and (2) Clec11a (red) and Pi16 (green), (right) in P3 thoracic aorta. Arrowheads in [L] inset indicate progenitors. White arrowhead in [R] inset points to an intermediate cell. Yellow arrowhead shows progenitor cell (scale bar, 291 μm [L] and 145 μm [R]). Representative of n=2 experiments. (I) Model for thoracic aorta tissue organization at P3. Lu: vessel lumen; DAPI (blue) was used to stain nuclei. Statistical Testing: NS p>0.05, **p≤0.01, ***p≤0.001, ****p≤0.0001.
Fig. 3
Fig. 3. Isolation of adipogenic fibroblasts from perinatal thoracic aorta
(A) FACS isolation of fibroblast and SMC populations. Live (FVS510-); Lin- (CD45-,CD31-,Ter119-) cells were gated as shown to isolate the following cell populations: Progenitors [LY6A high], Preadipocytes (PreAd) [LY6A-; CD142 intermediate; CD200-], SMC [LY6A-; CD142-; CD200+], Intermediate Cells (Int) [LY6A-; CD142+; CD200+, CD317-]. Meso (Mesothelium) [LY6A-; CD142+; CD200+, CD317+]. (Representative plots from 10 separate experiments). Full strategy in Extended Data Fig. 2A. (B) Expression heatmaps of Seurat-generated cluster-defining genes mapped on to sorted-cell RNA-Seq results (n=3 biological replicates per group). (C) Pathway analysis of cluster-defining genes for each cell population. Cluster-defining genes are defined as significantly differentially expressed genes with log2FC>1.5 in every pairwise comparison from sorted-cell bulk RNA-seq (n=3 biological replicates). Graphs plot -log10 unadjusted p values. P values were calculated using EnrichR with WikiPathways2019 annotations and the hypergeometric test; Padjusted for multiple comparisons were calculated with Benjamini-Hochberg. Padjusted values in the order they appear on graphs: SMC (8.70E-06, 1.73E-04, 0.012645474, 0.078202676, 0.093946235, 0.093946235); Intermediate (0.03706, 0.093893, 0.129175 (all others)); Progenitor (5.81E-06, 8.70E-05, 7.50E-04, 0.019056, 0.025219, 0.060584); PreAd (1.97E-49, 6.31E-27, 2.74E-20, 9.95E-15, 5.46E-13, 1.37E-12) (D) Bodipy (lipid; green) and Hoechst (DNA; blue) staining of cell cultures following differentiation with adipogenic cocktail (Representative image of 5 separate experiments). Scale Bars: Whole Well 500 μM, Zoom 100 μM. (E) Quantification of adipocyte differentiation (Bodipy+ area above threshold/nuclei) (Data pooled from n=5 separate experiments, n=5 biologically independent replicates per group; mean+/−SEM). Two way-ANOVA followed by two-sided pairwise comparisons with Holm Sidak correction. Statistical Testing: ****p≤0.0001.
Fig. 4
Fig. 4. Adipogenic fibroblasts are the major source of aortic adipocytes in neonates.
(A) Schematic of cell types in perinatal aorta and corresponding marker genes. Created with BioRender.com. (B) Staining of PLIN1 (green) and RFP (red) in sections of P3 thoracic aorta from Myh11-Cre(−); tdTom (control) and Myh11-Cre+; tdTom reporter mice. (Inset) White arrowhead indicates labeled SMCs. Yellow arrowhead shows unlabeled adipocytes. (n=2 Cre-; n=3 Cre+; scale bar, 271.8 μm). (C) Staining of GFP (green) and PLIN1 (red) in sections of thoracic aorta from Pdgfra-CreER(−); mTmG (control) and Pdgfra-CreER+; mTmG mice harvested 24 hours (E18 Pulse) and 8 weeks (Adult Chase) after tamoxifen treatment. Arrowheads in inset 1 show labeled fibroblasts. Arrowheads in inset 2 show GFP+ adipocytes. (Pulse: n=1 Cre-; n=3 Cre+; Chase: n=1 Cre-; n=2 Cre+; scale bar, 271.8 μm). (D) Staining of GFP (green) in sections of P3 and adult thoracic aorta from Vipr2-Cre(−); mTmG and Vipr2-Cre+; mTmG mice. Arrowheads indicate GFP expressing intermediate cells. (P3: n=3 mTmG-; n=4 mTmG+; Adult: n=1 mTmG-; n=4 mTmG+; scale bar, 290 μm (P3), 724.7 μm (adult)). (E) Staining of GFP (green) in sections of P3 and adult thoracic aorta from Penk-Cre(−); mTmG and Penk-Cre+; mTmG+ mice. Yellow arrowheads show GFP+ fibroblasts. White arrowheads show GFP+ adipocytes. (P3: n=1 Cre-; n=3 Cre+; Adult: n=1 Cre-; n=3 Cre+; scale bar, 145 μm (P3), 724.7 μm (adult)). PVAT: Perivascular Adipose Tissue; Lu: vessel lumen; DAPI (blue) was used to stain nuclei.
Fig. 5
Fig. 5. Comparative gene expression profiling of white and brown adipogenic cells
(A) mRNA levels of indicated genes in differentiated adipocytes derived from the following cell types of P3 CD1 mice: iWAT preadipocytes, thoracic perivascular progenitors and thoracic perivascular preadipocytes. (n=4 independent wells from pooled FACS populations per group; mean+/− SEM). One way-ANOVA followed by two-sided pairwise comparisons with Holm Sidak correction. P values in order: iWAT PreAd vs. Prog, iWAT PreAd vs. PreAd, Prog vs PreAd. Adipoq (0.4198, 0.3825, 0.7582); Pparg2 (0.0019, 0.3125, 0.0059); Dio2 (0.0002, 0.0021, 0.0705); Ucp1 (0.0583, 0.0003,0.0034). (B) Principal component analysis (PCA) of the top 500 differentially expressed genes in sorted cell RNA Seq. (n=3 biological replicates per cell type). One PVAT PreAd datapoint includes two overlapping replicates. (C) Venn diagram of genes enriched in progenitor populations relative to preadipocyte populations from iWAT and PVAT. Pathway analysis of genes commonly enriched in both depots (significantly differentially expressed and LFC>0). Graph plots -log10 unadjusted p values. P values were calculated using clusterProlifer with WikiPathways2019 annotations using the hypergeometric distribution. Padjusted for multiple comparisons was calculated with FDR. Padjusted in order: 0.002835, 0.01171, 0.01171, 0.01171, 0.028843, 0.070511, 0.077592. (D) Venn diagram of genes enriched in preadipocyte populations relative to progenitor populations. Pathway analysis of genes commonly enriched in both depots (significantly differentially expressed and LFC>0) (left) and genes unique to PVAT (right). Graphs and p values calculated as in (C). P adjusted in order: Left (1.61E-16, 1.26E-13, 0.006022, 0.017277, 0.017277, 0.040287, 0.058059); Right (3.76E-43, 5.75E-36, 6.95E-26, 2.91E-21, 7.14E-13, 1.80E-09, 4.29E-07, 1.31E-06). (E) Z-Score split heatmap of representative genes from GO analysis. Gene expression levels are calculated between cell types (i.e. PVAT Progenitors vs. PVAT PreAd) within a depot of origin (n=3 biological replicates per cell type). (F) Model for conserved ontogeny of adipocyte development. Created with Biorender.com. Statistical Testing: NS p>0.05, **p≤0.01, ***p≤0.001, ****p≤0.0001.
Fig. 6
Fig. 6. Identification of adipogenic smooth muscle cells (SMCs) in adult PVAT
(A) UMAP of gene expression in 6,753 cells from adult thoracic aorta of pooled 13-week-old male CD1 mice. (B) UMAPs showing expression of fibroblast marker genes. (C) UMAPs showing expression of SMC marker genes. (D) FACS isolation of fibroblast and SMC populations. Live Lin(−) cells were gated to isolate the following cell populations: Intermediate Cells [PDGFRa+,MCAM(−),CD200+], Progenitors [PDGFRa+,MCAM(−),CD200(−)], SMC-1 [PDGFRa(−),MCAM+,CD200+], SMC-2 [PDGFRa(−),MCAM+,CD200(−)]. (Representative image of 6 separate experiments). Full strategy in Fig Extended Data Fig. 5F. (E) Expression heatmap of Seurat-generated cluster defining genes mapped on to sorted-cell RNA-Seq results (n=3 biological replicates per group). (F) Pathway analysis of cluster-defining genes for each cell population. Cluster-defining genes were defined as significantly differentially expressed genes with log2FC>1.5 in every pairwise comparison (n=3 biological replicates). Graphs plot -log10 unadjusted p values. P values were calculated using clusterProlifer with WikiPathways2019 annotations and the hypergeometric distribution. Padjusted for multiple comparisons was calculated with FDR. Padjusted in order: Int cells (0.027783, 0.029414, 0.034167, 0.093761, 0.105357, 0.105357); Prog (0.026565, 0.026565, 0.029454, 0.078199, 0.078199, 0.181118); SMC1 (6.64E-05, 6.64E-05, 0.040965, 0.040965, 0.269701); SMC2 (0.000933, 0.001561, 0.004055, 0.008551, 0.047207, 0.047207).
Fig. 7
Fig. 7. Adipogenic activity of smooth muscle cells (SMCs) in adult PVAT
(A) Cell populations were FACS purified from adult aortas and induced to differentiate into adipocytes, followed by staining with Bodipy (lipid, green) and Hoechst (nuclei, blue) Quantification of adipocyte differentiation in cultures (right) (n=3 separate experiments; mean+/−SEM). Two way-ANOVA followed by all pairwise comparisons with Holm Sidak multiple correction. All comparisons p<0.0001, except SMC1 vs Int Cell p=0.44). Scale Bars 100 μm. (B) Staining of RFP (red), PLIN1 (green), and DAPI (blue) in thoracic aorta from adult Myh11-Cre-; tdTom/+ and Myh11-Cre+; tdTom/+ mice treated with vehicle (DMSO) or rosiglitazone (Rosi). Arrowheads = mTomato-labeled adipocytes. (n=1 Cre-; n=2 DMSO, n=2 Rosi; scale bar, 271.8 μm). (C) Flow cytometry analysis of cell populations in stripped aorta or PVAT alone from adult mice (n=2 biological replicates of pooled aortas; mean+/−SEM). Flow strategy in Extended Data Fig. 5F. (D) UMAP of gene expression in 12,969 nuclei from adult human peri aortic PVAT (Subclustered to remove immune, endothelial, and mesothelial cells, n=3 humans, integrated analysis). (E-G) UMAPs showing expression of adipocyte (E), Fibroblast (F) and SMC-related (G) marker genes in the dataset shown in (D). (H) WikiPathways 2019 GO analysis of all genes differentially expressed (average logFC>0) in SMC-like cells vs. SMCs. Graph plots -log10 unadjusted p values. P values were calculated using clusterProlifer with WikiPathways2019 annotations and the hypergeometric distribution. Padjusted for multiple comparisons was calculated with FDR. Padjusted in order (0.000260333, 0.000781193, 0.001156153, 0.001880657, 0.002417556, 0.003143424, 0.004915838, 0.005278098, 0.005661329, 0.008085485, 0.013244988, 0.015799396). (I) Model of thoracic aorta and associated tissue organization. Created with Biorender.com. Statistical Testing: NS p>0.05, **p≤0.01, ***p≤0.001, ****p≤0.0001.

Comment in

References

    1. Cypess AM et al. Activation of human brown adipose tissue by a beta3-adrenergic receptor agonist. Cell Metab. 21, 33–38 (2015). - PMC - PubMed
    1. Harms M. & Seale P. Brown and beige fat: development, function and therapeutic potential. Nat. Med 19, 1252–1263 (2013). - PubMed
    1. O’Mara AE et al. Chronic mirabegron treatment increases human brown fat, HDL cholesterol, and insulin sensitivity. J. Clin. Invest 130, 2209–2219 (2020). - PMC - PubMed
    1. Yoneshiro T. et al. Recruited brown adipose tissue as an antiobesity agent in humans. J. Clin. Invest 123, 3404–8 (2013). - PMC - PubMed
    1. Cannon B. & Nedergaard J. Brown adipose tissue: function and physiological significance. Physiol. Rev 84, 277–359 (2004). - PubMed

Publication types

MeSH terms