. 2021 Sep;39(9):1115-1128.
doi: 10.1038/s41587-021-00857-z. Epub 2021 Apr 12.

Evaluating the analytical validity of circulating tumor DNA sequencing assays for precision oncology

Ira W Deveson  1   2 Binsheng Gong  3 Kevin Lai  4 Jennifer S LoCoco  5 Todd A Richmond  6 Jeoffrey Schageman  7 Zhihong Zhang  8 Natalia Novoradovskaya  9 James C Willey  10 Wendell Jones  11 Rebecca Kusko  12 Guangchun Chen  13 Bindu Swapna Madala  14 James Blackburn  15   16 Igor Stevanovski  1 Ambica Bhandari  17 Devin Close  18 Jeffrey Conroy  19 Michael Hubank  20 Narasimha Marella  21 Piotr A Mieczkowski  22 Fujun Qiu  8 Robert Sebra  23 Daniel Stetson  24 Lihyun Sun  25 Philippe Szankasi  18 Haowen Tan  26 Lin-Ya Tang  27 Hanane Arib  23 Hunter Best  18   28 Blake Burgher  19 Pierre R Bushel  29 Fergal Casey  6 Simon Cawley  30 Chia-Jung Chang  31 Jonathan Choi  32 Jorge Dinis  32 Daniel Duncan  21 Agda Karina Eterovic  27 Liang Feng  6 Abhisek Ghosal  17 Kristina Giorda  33 Sean Glenn  19 Scott Happe  34 Nathan Haseley  5 Kyle Horvath  17 Li-Yuan Hung  35 Mirna Jarosz  36 Garima Kushwaha  6 Dan Li  3 Quan-Zhen Li  13 Zhiguang Li  37 Liang-Chun Liu  38 Zhichao Liu  3 Charles Ma  21 Christopher E Mason  39 Dalila B Megherbi  40 Tom Morrison  41 Carlos Pabón-Peña  42 Mehdi Pirooznia  43 Paula Z Proszek  20 Amelia Raymond  24 Paul Rindler  18 Rebecca Ringler  17 Andreas Scherer  44   45 Rita Shaknovich  21 Tieliu Shi  46 Melissa Smith  23 Ping Song  27 Maya Strahl  23 Venkat J Thodima  21 Nikola Tom  45   47 Suman Verma  17 Jiashi Wang  48 Leihong Wu  3 Wenzhong Xiao  31   35 Chang Xu  49 Mary Yang  50 Guangliang Zhang  51 Sa Zhang  51 Yilin Zhang  25 Leming Shi  52   53   54 Weida Tong  3 Donald J Johann Jr  55 Timothy R Mercer  56   57   58 Joshua Xu  59 SEQC2 Oncopanel Sequencing Working Group
Affiliations

Evaluating the analytical validity of circulating tumor DNA sequencing assays for precision oncology

Ira W Deveson et al. Nat Biotechnol. 2021 Sep.

Abstract

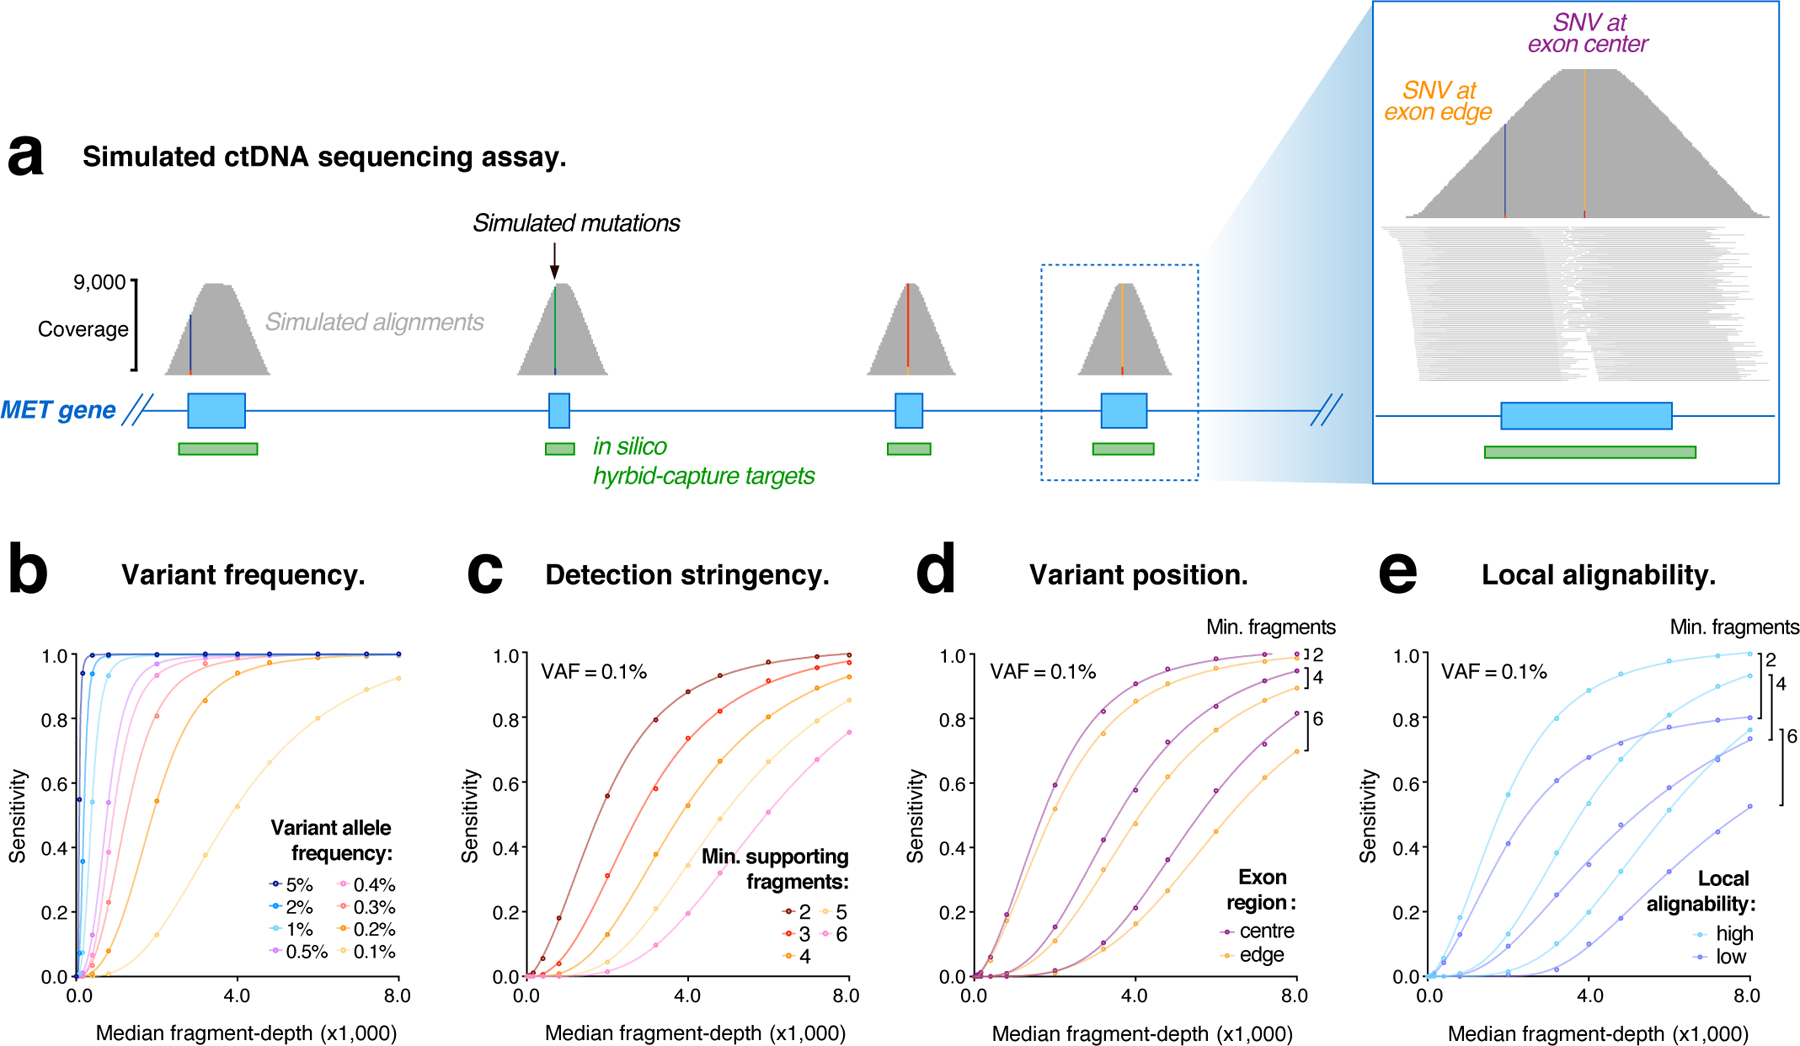
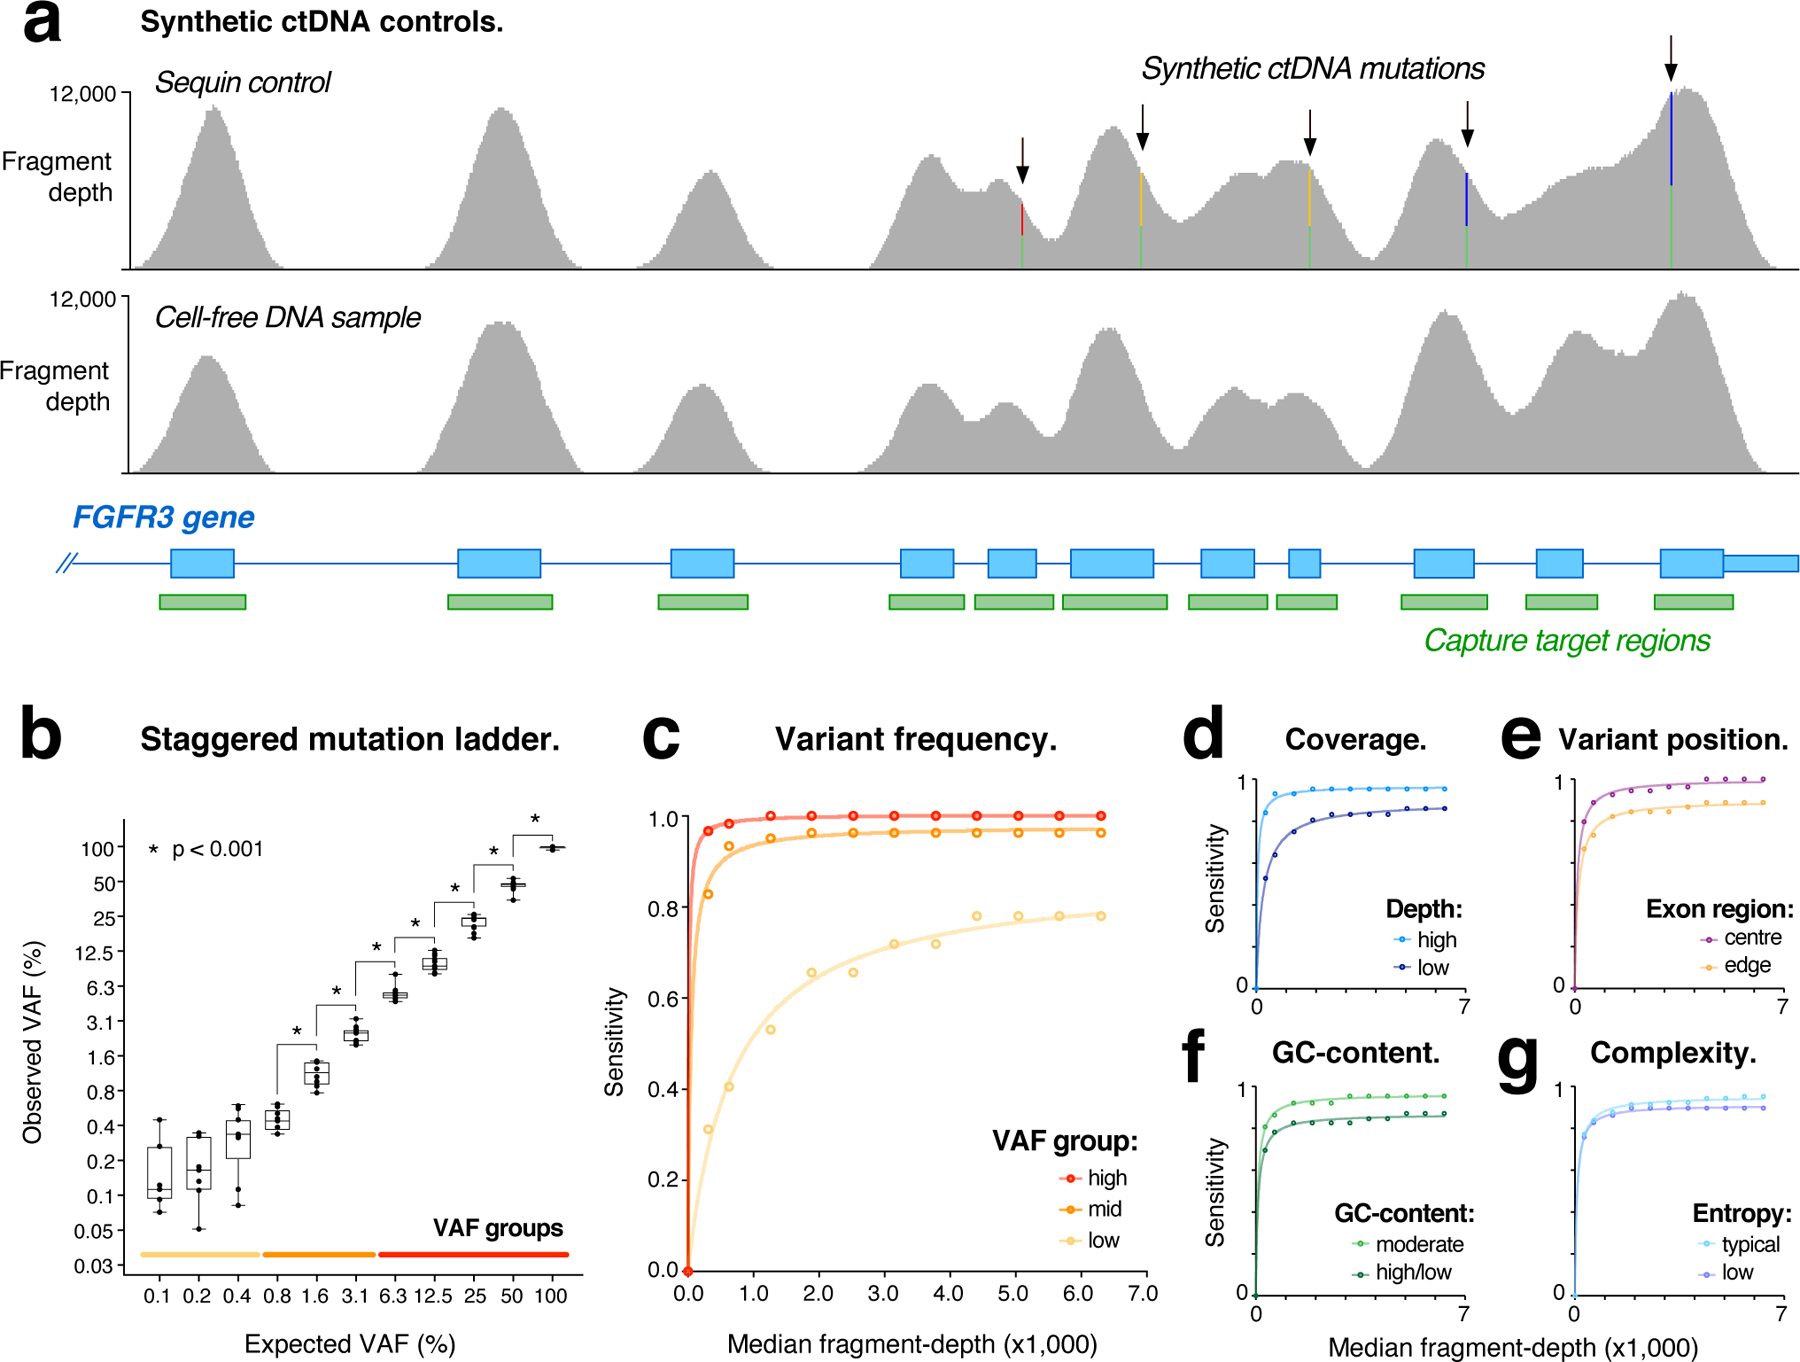
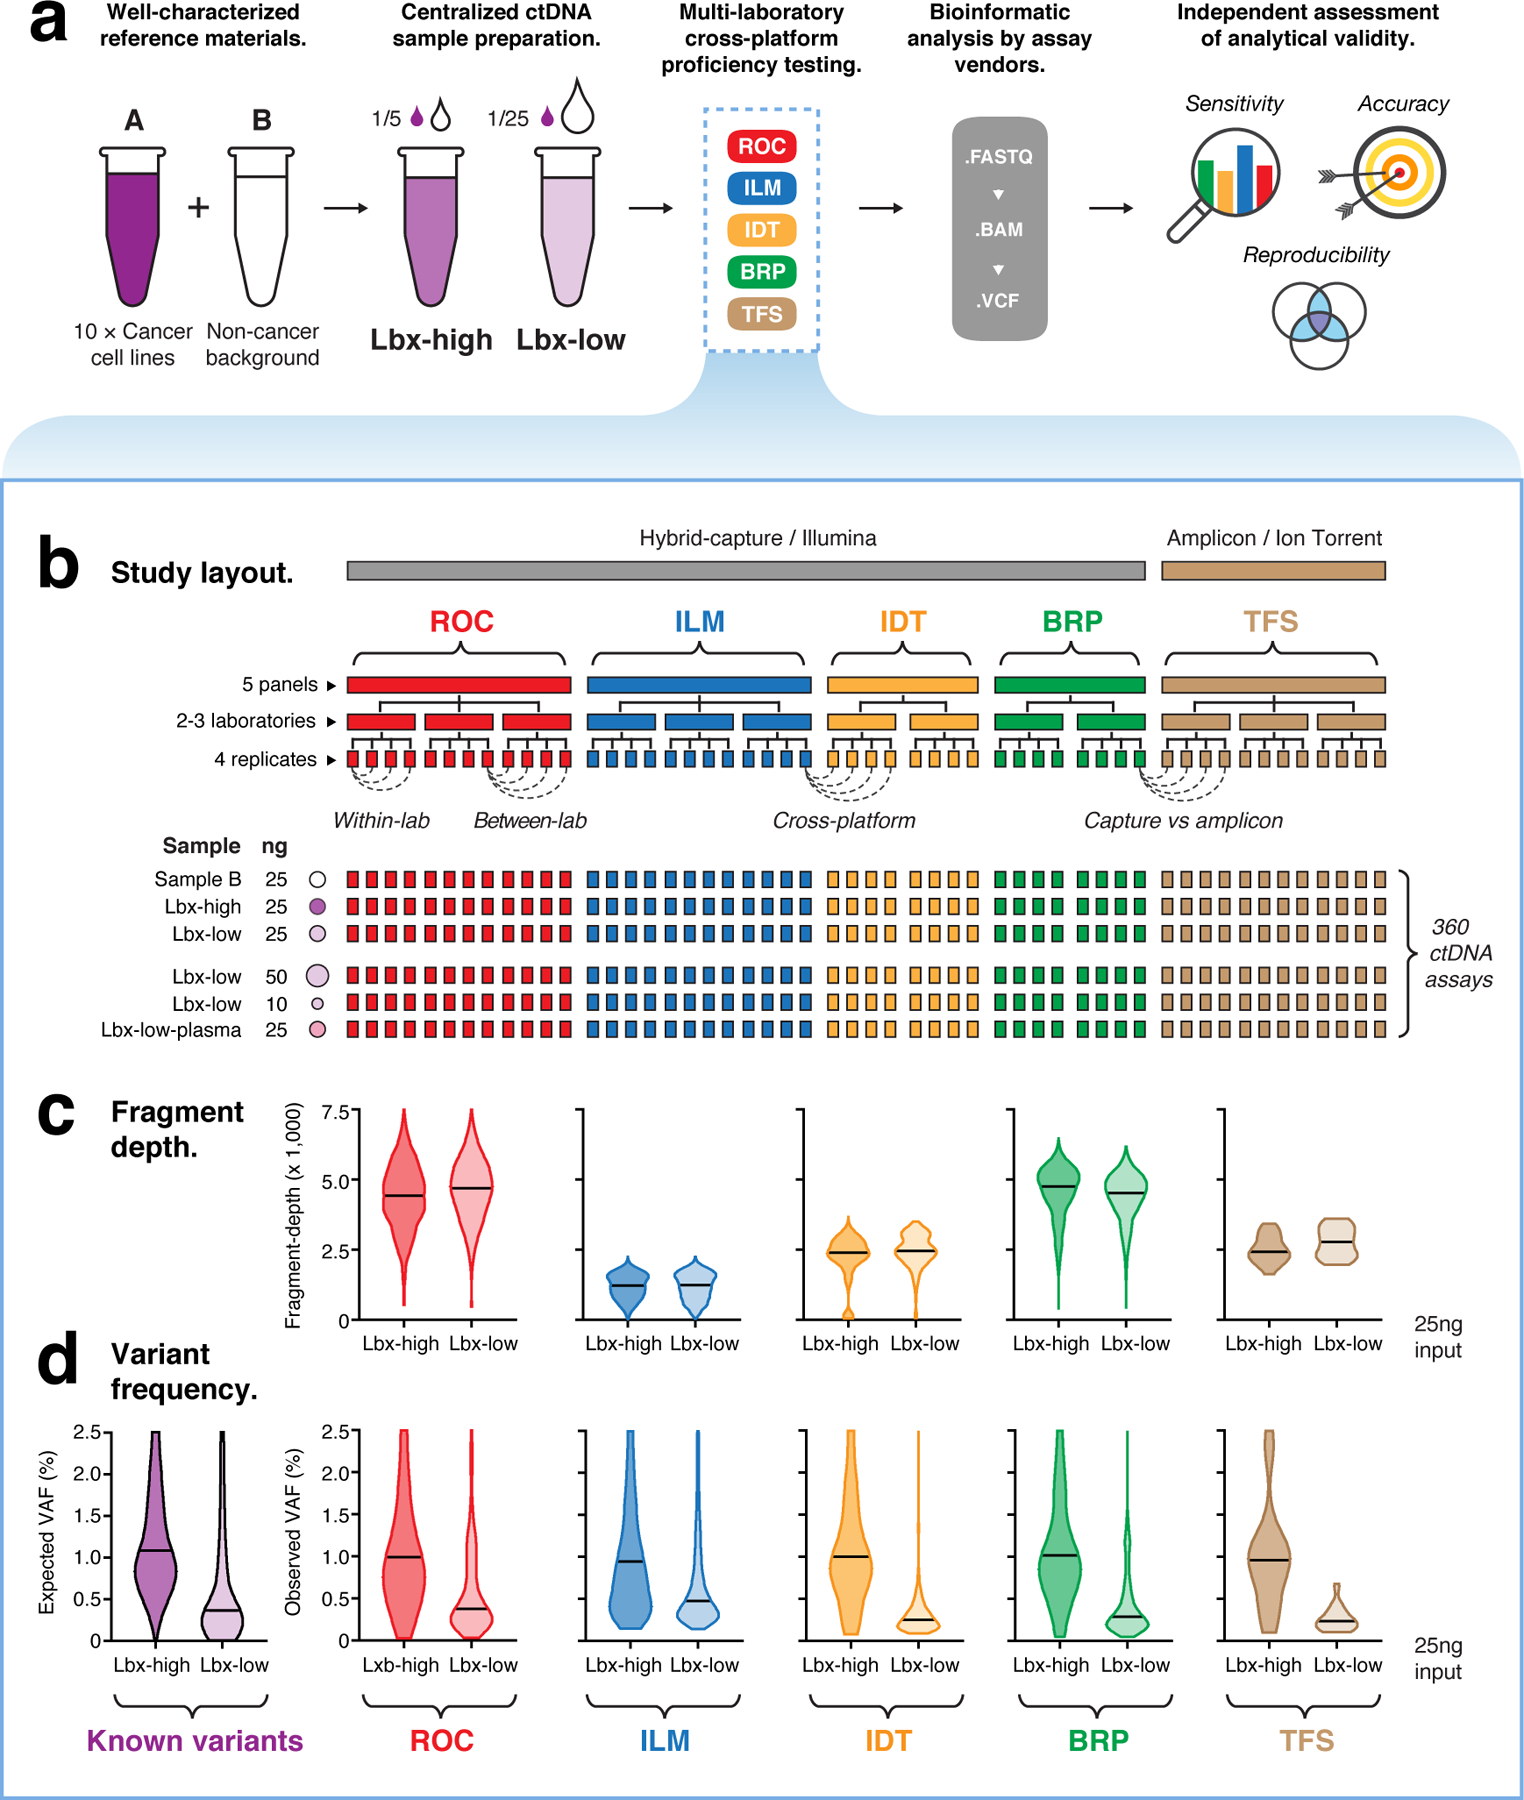
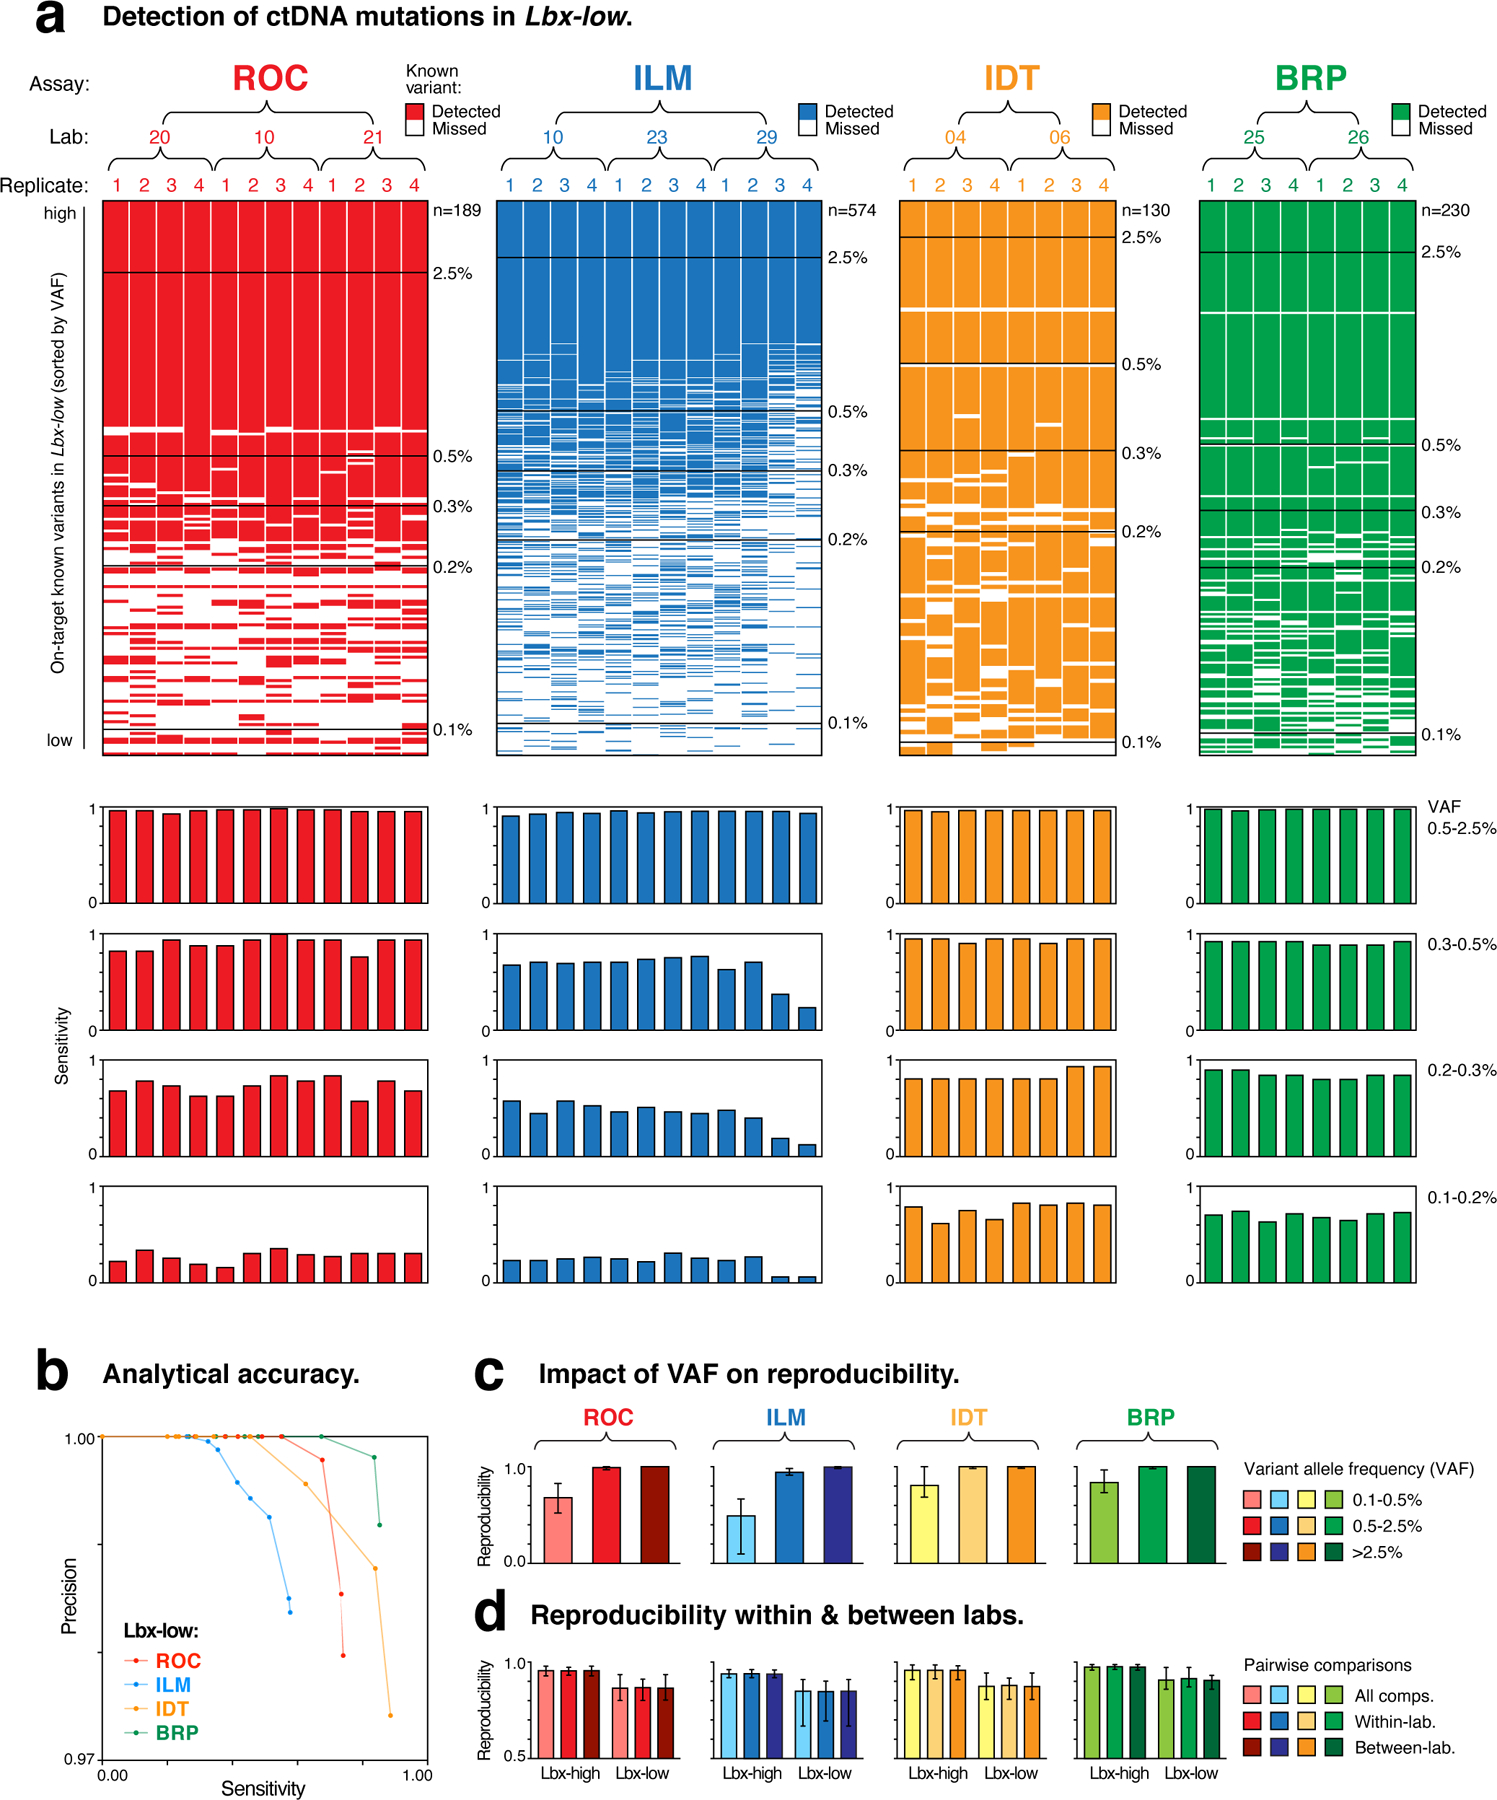
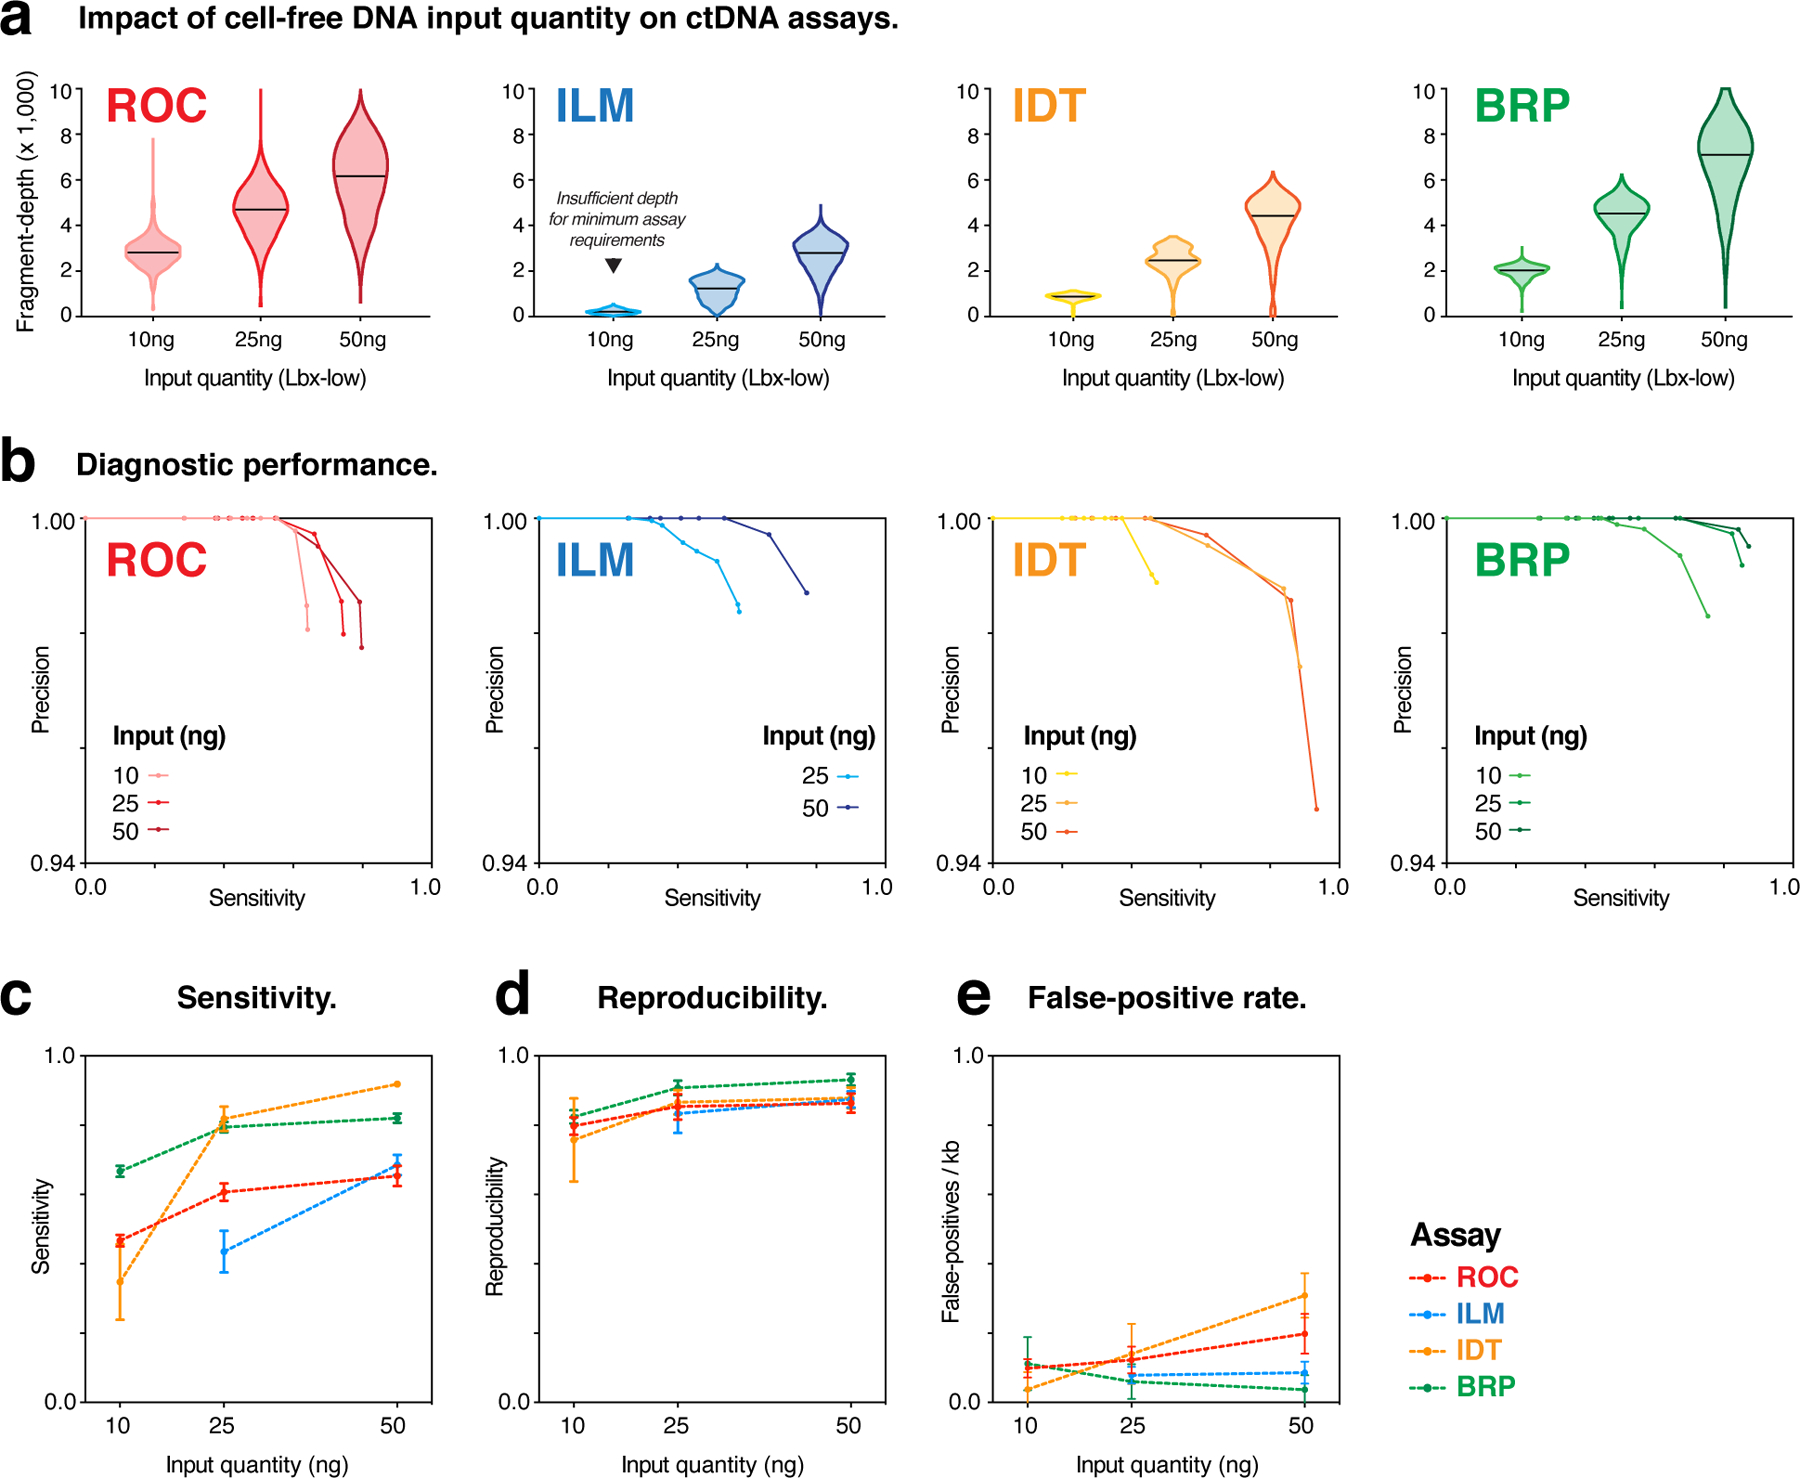
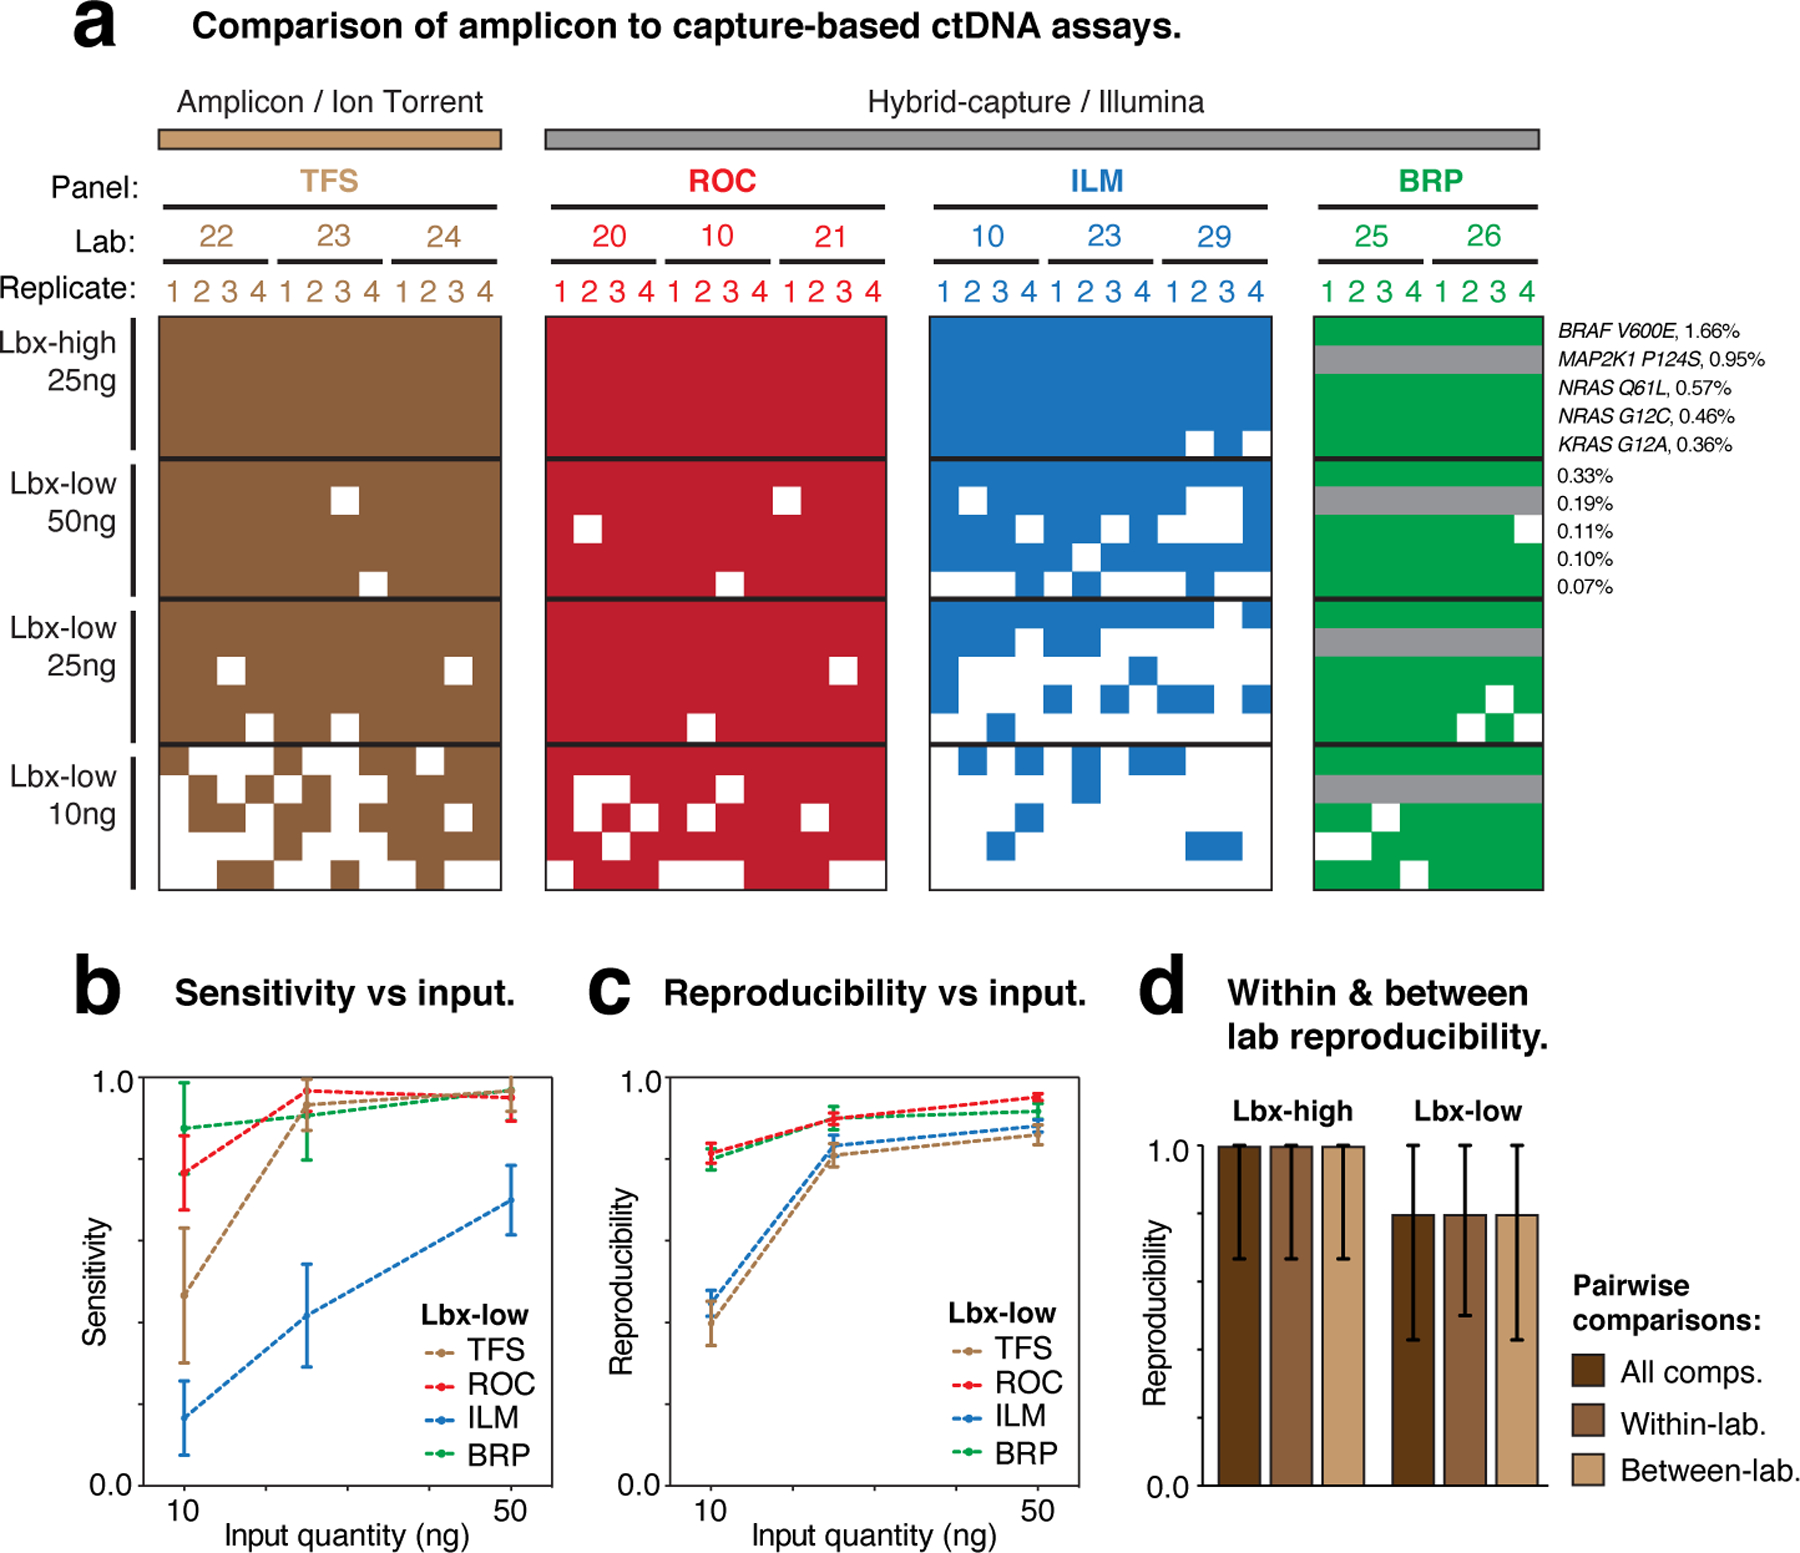
Circulating tumor DNA (ctDNA) sequencing is being rapidly adopted in precision oncology, but the accuracy, sensitivity and reproducibility of ctDNA assays is poorly understood. Here we report the findings of a multi-site, cross-platform evaluation of the analytical performance of five industry-leading ctDNA assays. We evaluated each stage of the ctDNA sequencing workflow with simulations, synthetic DNA spike-in experiments and proficiency testing on standardized, cell-line-derived reference samples. Above 0.5% variant allele frequency, ctDNA mutations were detected with high sensitivity, precision and reproducibility by all five assays, whereas, below this limit, detection became unreliable and varied widely between assays, especially when input material was limited. Missed mutations (false negatives) were more common than erroneous candidates (false positives), indicating that the reliable sampling of rare ctDNA fragments is the key challenge for ctDNA assays. This comprehensive evaluation of the analytical performance of ctDNA assays serves to inform best practice guidelines and provides a resource for precision oncology.


Conflict of interest statement

DISCLAIMERS & COMPETING INTERESTS

This research includes contributions from, and was reviewed by, the FDA and the NIH. This work has been approved for publication by these agencies, but it does not necessarily reflect official agency policy. Certain commercial materials and equipment are identified in order to adequately specify experimental procedures. In no case does such identification imply recommendation or endorsement by the FDA or the NIH, nor does it imply that the items identified are necessarily the best available for purpose. The Garvan Institute of Medical Research has filed patent applications on synthetic controls for genomics. The authors declare no other competing financial interests.

Figures

Figure 1.
Figure 1.. Evaluating ctDNA assays with simulated sequencing data.
(a) Genome browser view showing coverage of simulated sequencing fragments within the MET oncogene, with single nucleotide variants (SNVs) represented in each exon. Inset (right) shows the distribution of fragment coverage within a single coding exon, illustrating the convex coverage profile that results from in silico capture enrichment and causes lower fragment-depth among mutations in edge regions. (b–e) Curves modelling the relationship between simulated library depth (median fragment-depth) and detection sensitivity for simulated mutations under various conditions: (b) shows mutations represented at different frequencies (0.1–5% VAF), with ≥ 4 supporting fragments required for detection; (c) mutations at VAF = 0.1%, with different levels of detection stringency applied (≥ 2–6 supporting fragments); (d) mutations within exon edge regions (< 20bp from exon boundary), compared to central regions (> 50bp from exon boundary); (e) mutations in regions of sub-optimal alignability (low), compared to optimal regions (high).
Figure 2.
Figure 2.. Evaluating ctDNA assays with sequins.
(a) Genome browser view showing fragment coverage within a synthetic sequin control (upper) representing the oncogene FGFR3, harboring multiple synthetic mutations at VAF = 50%. For comparison, coverage is also shown within the natural FGFR3 gene (lower) obtained from the accompanying human sample. (b) Scatter-box plots show observed vs expected variant allele frequencies (VAFs) for synthetic sequin mutations (n = 134), which are represented in two-fold VAF increments from 0.1%−100%. Asterisks indicate significant differences in measured VAFs between increments (two-sided t-test; p < 0.001; n > 8 data points per bin). Boxes show median ± range (whisker) and interquartile range (box). Colored lines indicate high, mid and low VAF groups used in c. (c–g) Curves modelling the relationship between library depth (median-fragment depth) and detection sensitivity for synthetic sequin mutations under various conditions: (c) shows mutations within different VAF groups, indicated on lower axis of b; (d) mutations with high fragment-depth (> 5000-fold), compared to low fragment-depth (< 3000-fold); (e) mutations within exon edge regions (< 20bp from exon boundary), compared to central regions (> 50 bp from exon boundary); (f) mutations in regions of high or low GC-content (< 40% / > 60%), compared to moderate regions; (g) mutations in regions of low sequence entropy (< 1.9), compared to typical regions.
Figure 3.
Figure 3.. Structure of cross-platform ctDNA sequencing proficiency study.
(a) Schematic overview of the proficiency study. Briefly, contrived mock cell-free DNA samples (Lbx-high, Lbx-low) were administered to 12 test labs, where they were analyzed by one or more participating ctDNA sequencing assays (ROC, ILM, IDT, BRP, TFS; see Supplementary Table 3). Bioinformatic analysis was performed by the relevant assay vendor, using their custom pipelines. Results were then submitted for analytical evaluation by an independent team. (b) Schematic overview of the proficiency testing scheme. Each participating ctDNA assay was performed at two or three independent test labs, with four technical replicates per lab generated for each test sample. Each of Lbx-high, Lbx-low and Sample B were analyzed at a fixed 25 ng input amount, and Lbx-low was additionally analyzed at 10 ng and 50 ng input amounts, and at 25ng input following extraction from a synthetic plasma solution (Lbx-low-plasma). In total, 360 ctDNA assays were evaluated. (c; upper) Violin plots show coverage distributions (unique fragment-depth) for Lbx-high and Lbx-low (25 ng input) replicates in each participating assay. (c; lower) Distribution of variants allele frequency (VAF) for on-target variant candidates in Lbx-high and Lbx-low (25 ng input). For comparison, expected VAF distributions for known variants in Lbx-high and Lbx-low are also shown (lower left).
Figure 4.
Figure 4.. Comparison of performance between hybrid-capture ctDNA assays at 25ng input.
(a; upper) Ordered heatmaps show the detection of known variants (rows) in ctDNA assay replicates (columns). All on-target variants for a given assay are shown. Variants are sorted by expected variant allele frequency (VAF) in descending order, and replicates are arranged hierarchically by assay type, test lab and replicate number. Heatmaps show results for Lbx-low at 25ng input and equivalent heatmaps for Lbx-high are shown in Fig. S4a. (a; lower) Aligned below each heatmap column, bar charts indicate the sensitivity of variant detection in each replicate. Sensitivity is reported separately for known variants in the following VAF ranges: 2.5–0.5%, 0.5–0.3%, 0.3–0.2%, 0.2–0.1%, with measurements taken from both Lbx-high (high- and mid-VAF) and Lbx-low (low-VAF). (b) Precision-recall curves compare diagnostic performance of participating ctDNA assays for Lbx-low (25ng input; VAF range 2.5–0.1%). Equivalent curves for Lbx-high are shown in Fig. S4c. (c,d) Bar charts show pairwise reproducibility scores for participating assays (n = 132 for ROC, ILM; n = 56 for IDT, BRP; median ± range): (c) reproducibility is reported separately for variant candidates at high, mid and low frequency (as above); (d) reproducibility is reported separately for all within-lab and between-lab pairwise comparisons. Note that due to its smaller panel size and VAF distribution of on-target variants the TFS amplicon sequencing assay is not included in these analyses.
Figure 5.
Figure 5.. Impact of cell-free DNA input quantity (Lbx-low) on hybrid-capture ctDNA assay performance.
(a) Violin plots show coverage distributions (unique fragment-depth) for Lbx-low replicates at 10ng, 25ng and 50ng input amounts for hybrid-capture ctDNA assays. Note that 10ng ILM assays did not reach minimum coverage requirements, so were excluded from subsequent analysis (b) Precision-recall curves compare diagnostic performance of participating ctDNA assays for Lbx-low at each input amount above (VAF range 2.5–0.1%). (c-e) Curves showing the relationship between cell-free DNA input quantity (Lbx-low) and variant detection sensitivity (c), pairwise reproducibility (d) and false-positive rates (FPs/kb; e) for each participating ctDNA assay profiling low frequency variants (VAF range 0.5–0.1%). Error bars are mean ± 95% CI . Note that, due to its smaller panel size and VAF distribution of on-target variants, the TFS amplicon sequencing assay is not included in these analyses.
Figure 6.
Figure 6.. Evaluation of TFS amplicon sequencing assay.
(a) Heatmaps show the detection of known variants (rows) in ctDNA assay replicates (columns). Variants are sorted by expected variant allele frequency (VAF) in descending order for each sample/input quantity (Lbx-high 25ng, Lbx-low 10–50ng), and replicates are arranged hierarchically by assay type, test lab and replicate number. Grey rows indicate where known variant was not within the target regions for a given assay. (b,c) Curves showing the relationship between cell-free DNA input quantity (Lbx-low) and variant detection sensitivity (b) and pairwise reproducibility (c). (d) Bar charts show pairwise reproducibility scores for participating assays (n = 132 for ROC, ILM TFS; n = 56 for BRP; median ± range). Reproducibility is reported separately for all pairwise comparisons in Lbx-high and Lbx-low and separately for all within-lab and between-lab comparisons. Note that the IDT hybrid-capture assay is not included in these comparisons because this panel had limited overlap with TFS amplicon target regions.

References

    1. Leon SA, Shapiro B, Sklaroff DM & Yaros MJ Free DNA in the serum of cancer patients and the effect of therapy. Cancer Res 37, 646–650 (1977). - PubMed
    1. Stroun M, Anker P, Lyautey J, Lederrey C & Maurice PA Isolation and characterization of DNA from the plasma of cancer patients. Eur J Cancer Clin Oncol 23, 707–712 (1987). - PubMed
    1. Abbosh C et al.Phylogenetic ctDNA analysis depicts early-stage lung cancer evolution. Nature 545, 446–451 (2017). - PMC - PubMed
    1. Bettegowda C et al.Detection of circulating tumor DNA in early- and late-stage human malignancies. Sci Transl Med 6, 224ra24 (2014). - PMC - PubMed
    1. Abbosh C, Birkbak NJ & Swanton C Early stage NSCLC - challenges to implementing ctDNA-based screening and MRD detection. Nat Rev Clin Oncol 15, 577–586 (2018). - PubMed

Publication types

Substances