. 2021 Jul;39(7):825-835.
doi: 10.1038/s41587-021-00869-9. Epub 2021 Apr 12.

Single-cell CUT&Tag profiles histone modifications and transcription factors in complex tissues

Affiliations

Single-cell CUT&Tag profiles histone modifications and transcription factors in complex tissues

Marek Bartosovic et al. Nat Biotechnol. 2021 Jul.

Abstract

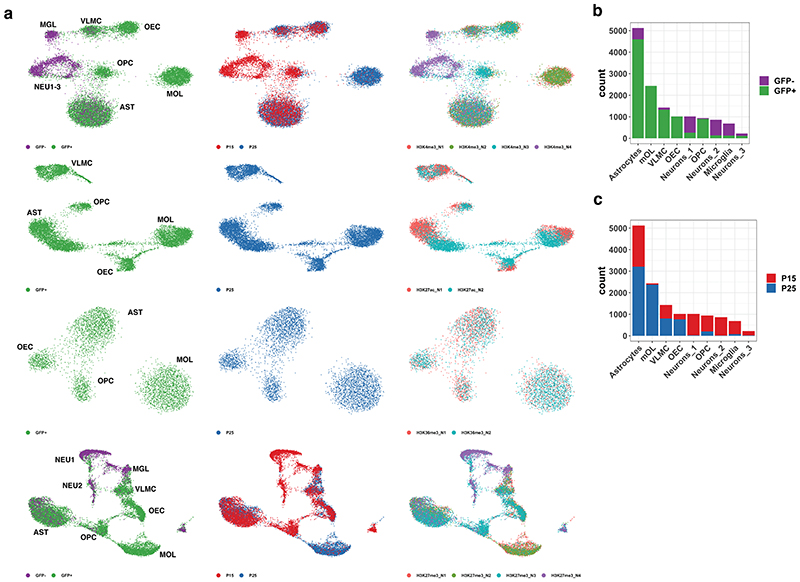
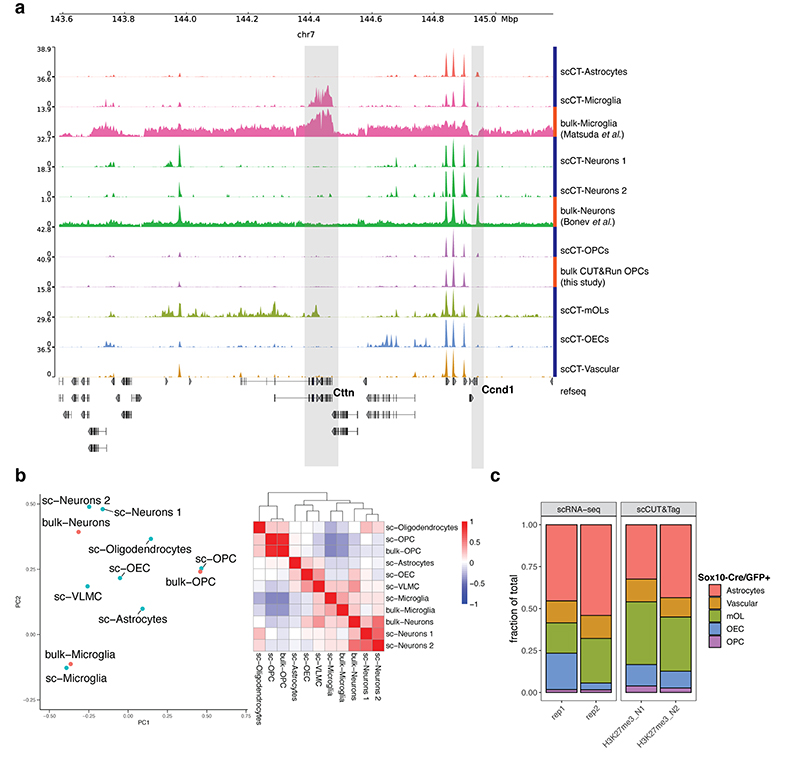
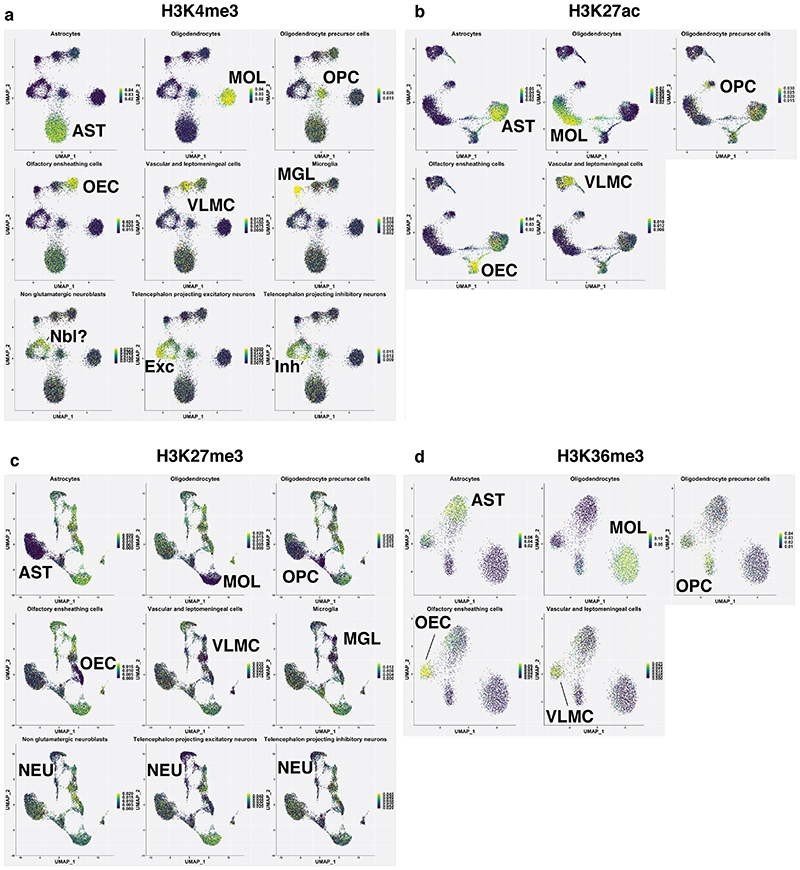
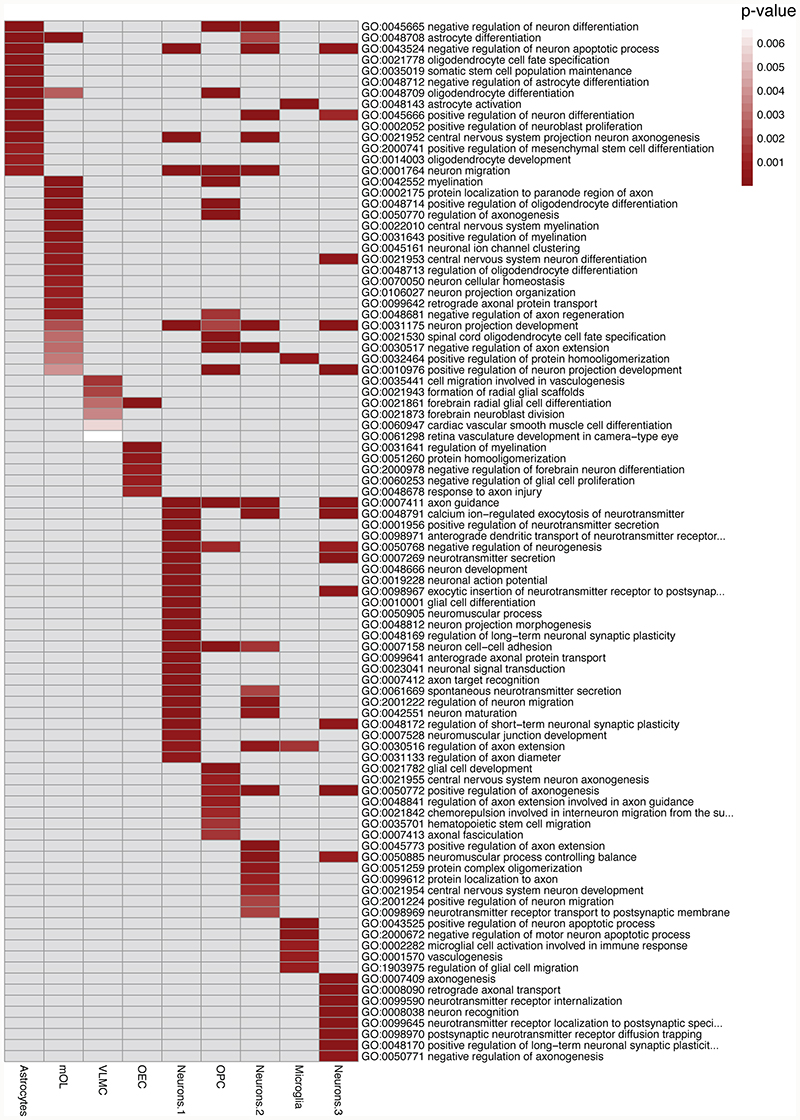
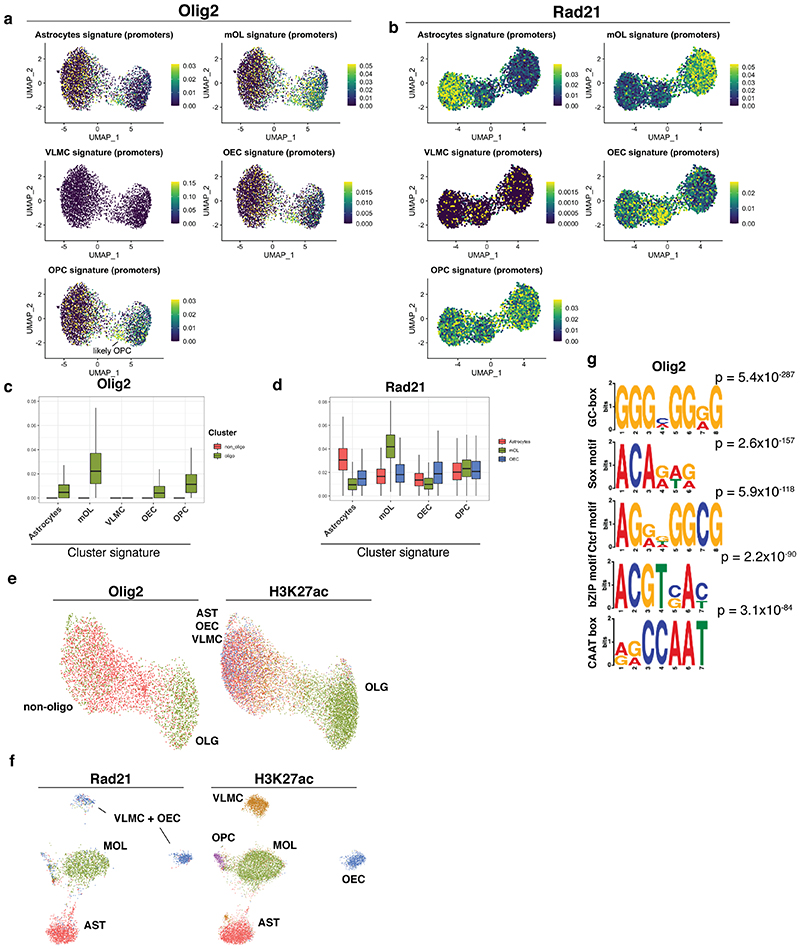
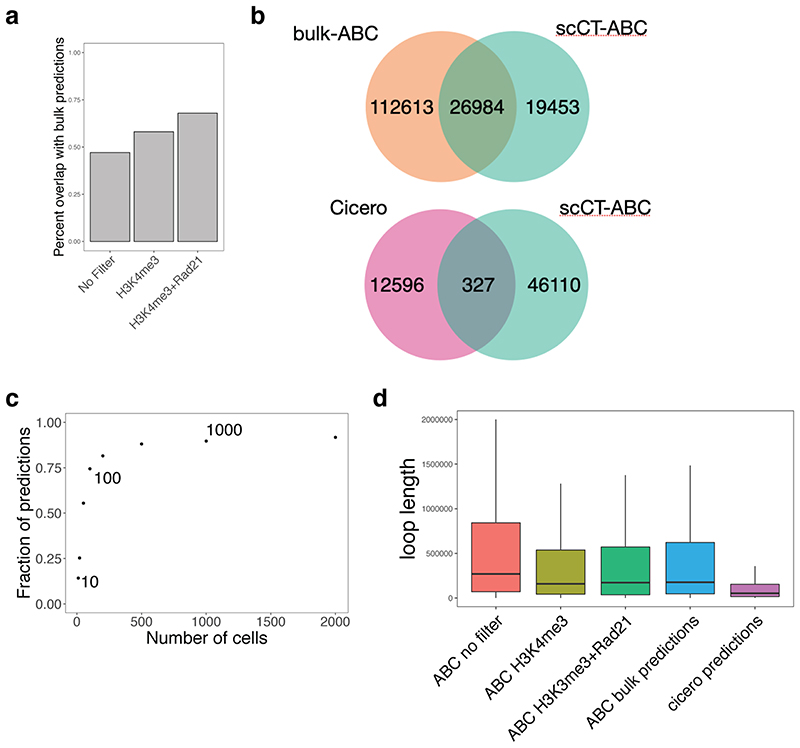
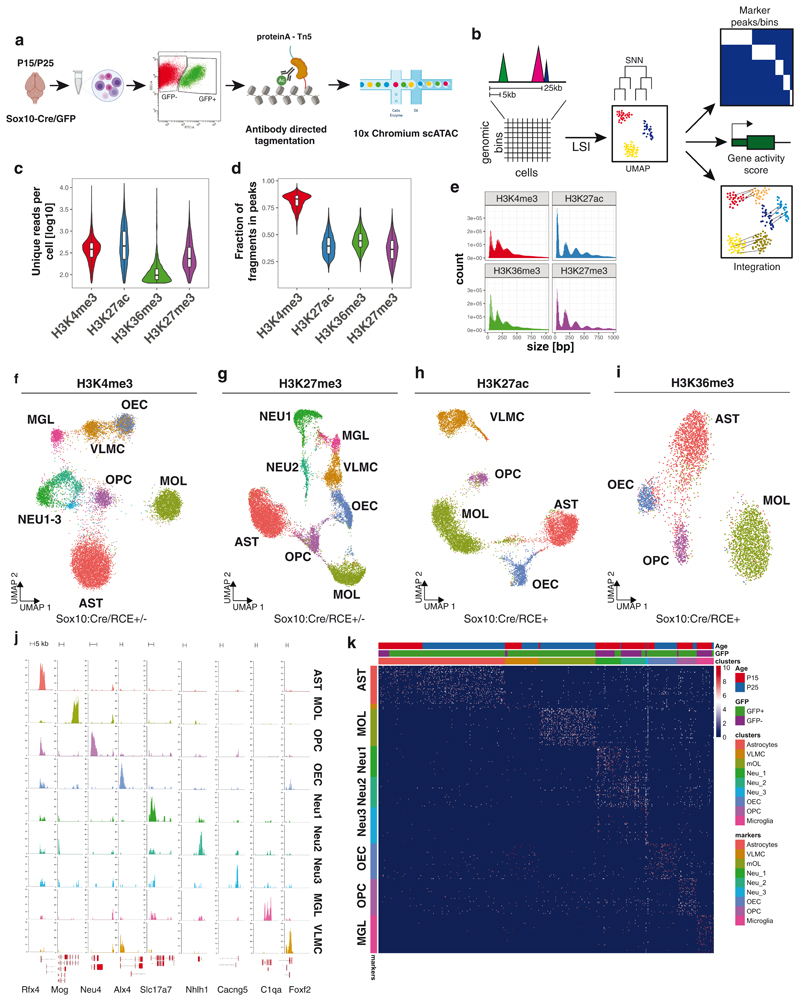
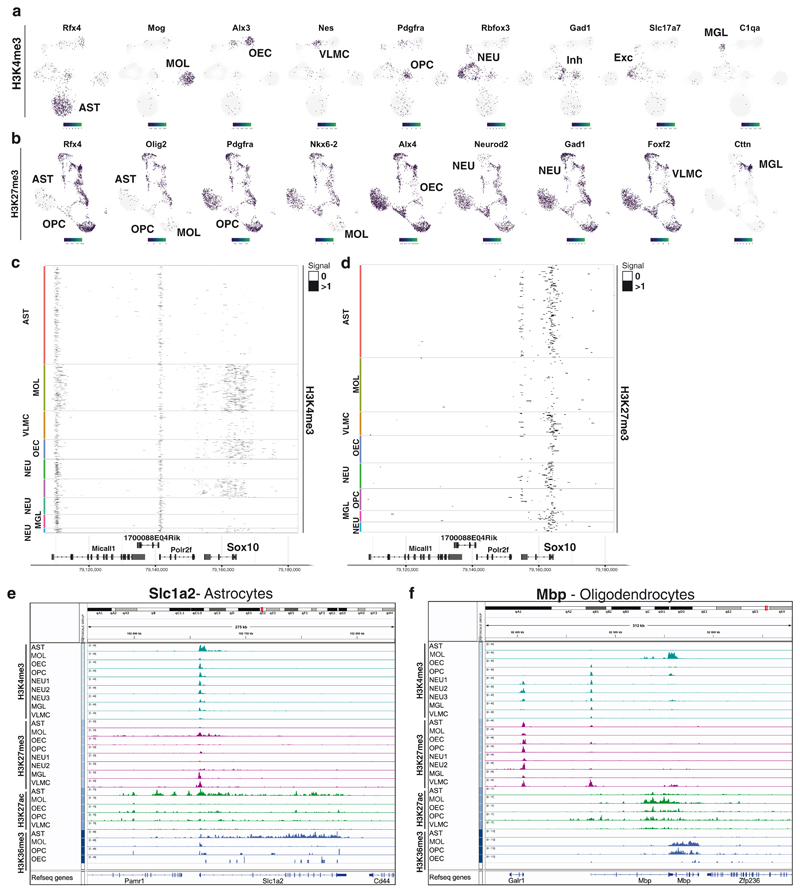
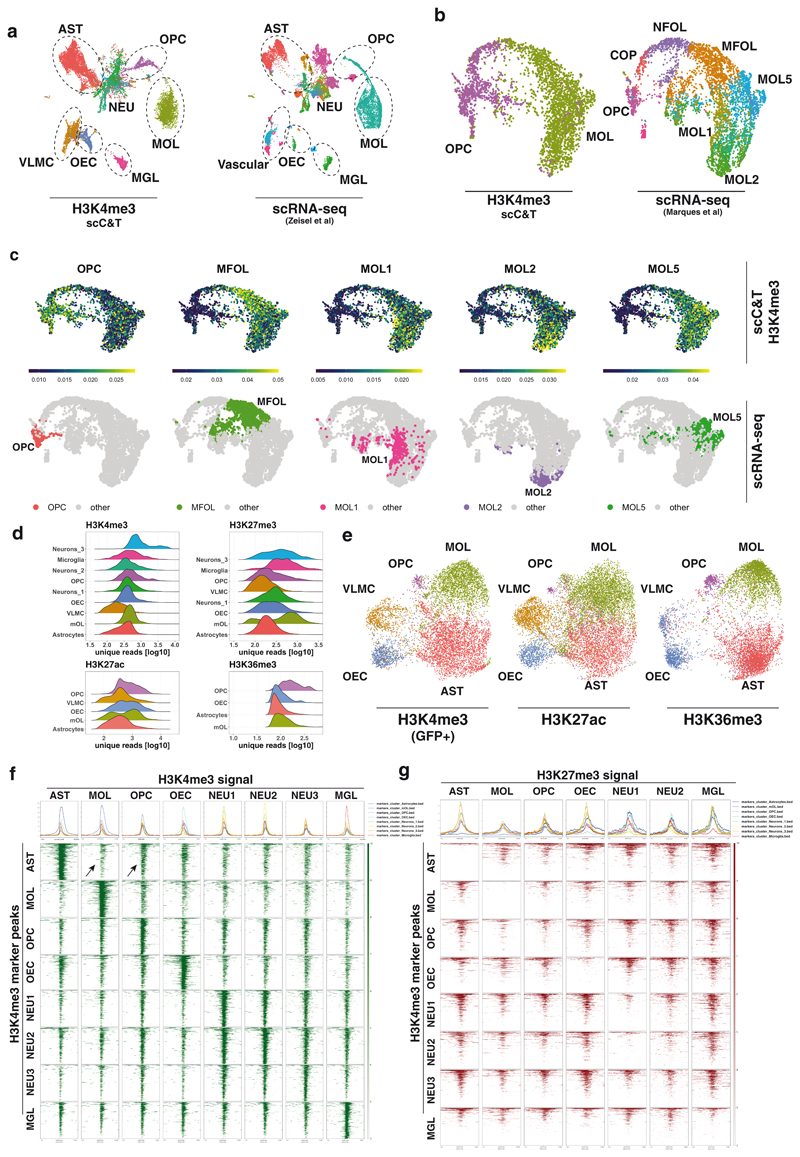
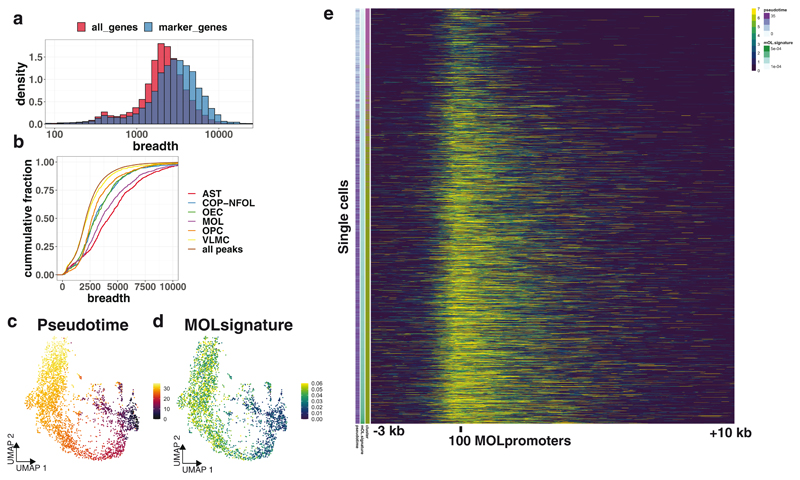
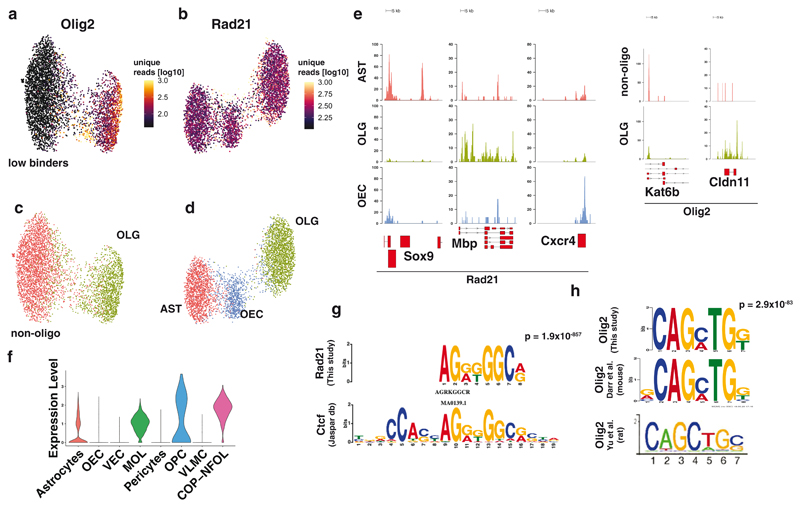
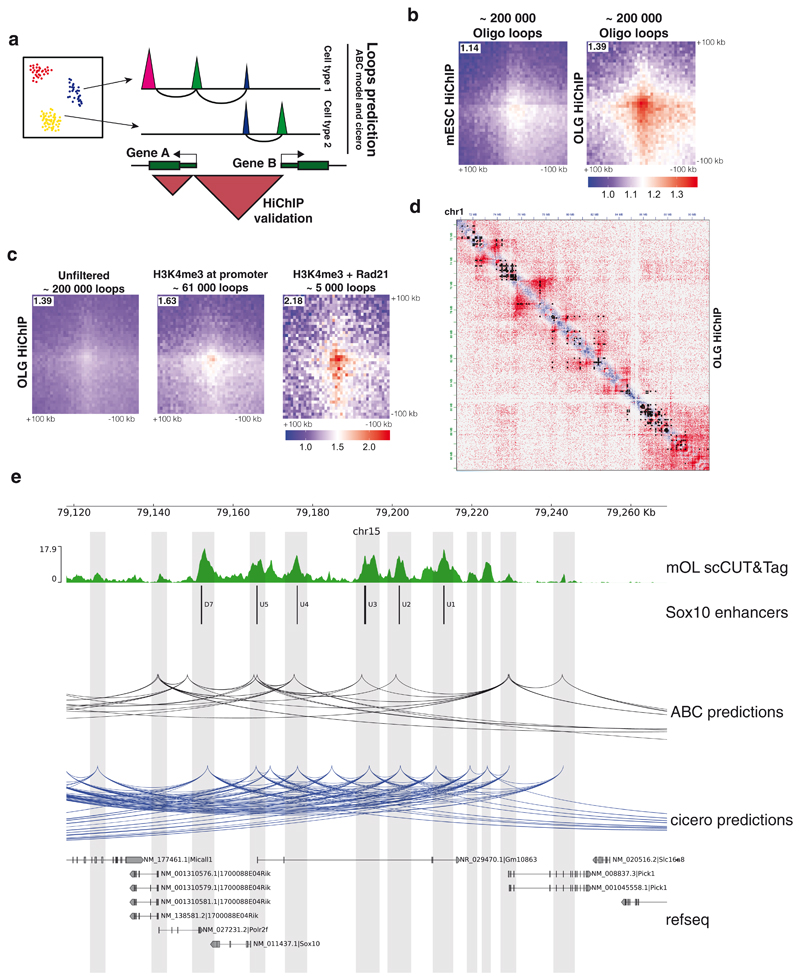
In contrast to single-cell approaches for measuring gene expression and DNA accessibility, single-cell methods for analyzing histone modifications are limited by low sensitivity and throughput. Here, we combine the CUT&Tag technology, developed to measure bulk histone modifications, with droplet-based single-cell library preparation to produce high-quality single-cell data on chromatin modifications. We apply single-cell CUT&Tag (scCUT&Tag) to tens of thousands of cells of the mouse central nervous system and probe histone modifications characteristic of active promoters, enhancers and gene bodies (H3K4me3, H3K27ac and H3K36me3) and inactive regions (H3K27me3). These scCUT&Tag profiles were sufficient to determine cell identity and deconvolute regulatory principles such as promoter bivalency, spreading of H3K4me3 and promoter-enhancer connectivity. We also used scCUT&Tag to investigate the single-cell chromatin occupancy of transcription factor OLIG2 and the cohesin complex component RAD21. Our results indicate that analysis of histone modifications and transcription factor occupancy at single-cell resolution provides unique insights into epigenomic landscapes in the central nervous system.


Figures

Extended Data Figure 1
Extended Data Figure 1. Optimization of tagmentation step in the scCUT&Tag protocol by addition of BSA.
a. Table depicting scCUT&Tag protocol steps (Primary Antibody, Secondary Antibody, Tn5 binding, Tagmentation) and whether BSA was included in the scCUT&Tag buffers during these steps. b. DAPI counterstaining of the nuclei after the scCUT&Tag procedure. Inclusion of BSA in the procedure substantially reduces clumping of the nuclei. c. Genome browser profiles of bulk cut&tag experiment from the different BSA conditions (described in a). d. Gating strategy depicting sorting of GFP cells. P1 Depicts general gate for selection of cells, P2 gate selects for singlets, DAPI-gate selects only live cells and GFP+ gate selects cells that possess GFP signal (Sox10-Cre/GFP).
Extended Data Figure 2
Extended Data Figure 2. scCUT&Tag of mixture of mouse cell lines.
a. UMAP projection of H3K27me3 scCUT&Tag in two dimensions. Points are colored by assigned cell identity. N=2 technical replicates b. Genome browser view of merged pseudobulk profiles of 5 scCUT&Tag clusters and bulk ChIP-seq or Cut&Run profiles of the respective cell lines. c. PCA analysis and pearson correlation matrix of 5 scCUT&Tag clusters and bulk ChIP-seq or Cut&Run data. The PCA was performed on the top 150 most variable marker regions selected from the scCUT&Tag data. Heatmap shows pearson’s correlation coefficient of signal in the same features. d. Scatter plot showing correlation of scCUT&Tag signal among clusters and technical replicates. e. Stacked barplot showing relative proportions of cell types identified using scCUT&Tag data. f and g. Metagene plot showing the distribution of ChIP-seq for mESCs (f) and 3T3 cells (g) and downscaled scCUT&Tag signal around peaks that were called from the bulk dataset.
Extended Data Figure 3
Extended Data Figure 3. Quality control of the scCUT&Tag data.
a. Merged pseudobulk profiles of scCUT&Tag with four antibodies against modified histones. b. Scatterplot of number of reads per cells (x axis) and fraction of reads originating from peak regions (y axis) that was used to set cutoffs for cells identification. Cutoffs were set after manual inspection of the plots and are depicted as horizontal and vertical lines overlaid over the plot. c. Histogram of number of features identified per cell for each antibody used in scCUT&Tag. d. Violin plots showing fraction of reads per cell that overlap peak regions that were called on merged bulk profiles using the same parameters for all compared samples. scCUT&Tag peak calling parameters are different from parameters used in Figure 1d. Point specifies mean of the distribution and lines standard error of mean. Number of cells per sample – H3K27me3_N1 3304, H3K27me3_N2 3090, H3K27me3_N3 5145, H3K27me3_N4 2393, H3K27me3_cell_lines_1 4872, H3K27me3_cell_lines_2 3873, K562_H3K4me2_iCell8 807, K562_H3K27me3_iCell8 1387, H1_H3K27me3_iCell8 486, Grosselin_1 2005, Grosselin_2 4122, Grosselin_3 960. e. Violin plot showing number of unique reads per cell. Point specifies mean of the distribution and lines standard error of mean. Number of cells per sample – H3K27me3_N1 n=3304, H3K27me3_N2 n=3090, H3K27me3_N3 n=5145, H3K27me3_N4 n=2393, H3K27me3_cell_lines_1 n=4872, H3K27me3_cell_lines_2 n=3873, K562_H3K4me2_iCell8 n=807, K562_H3K27me3_iCell8 n=1387, H1_H3K27me3_iCell8 n=486, Grosselin_1 n=2005, Grosselin_2 n=4122, Grosselin_3 n=960. f. Bar plot depicting number of analyzed cells per experiment g. Fingerprint plot representing relationship between cumulative signal of scCUT&Tag and scChIP-seq relative to fraction of genomic bins analyzed.
Extended Data Figure 4
Extended Data Figure 4. De novo identification of cell types by cell type specific marker regions.
Projection of gene activity scores of (a) H3K27ac and (b) H3K36me3 scCUT&Tag on the two-dimensional UMAP embedding. Gene name is depicted in the title and specific population is highlighted in the UMAP plot by labeling the cell type. c-d. Heatmap representation of the scCUT&Tag signal for (c) H3K27ac and (d) H3K36me3. X axis represents genomic region, each row in Y axis contains data from one cell. Cell correspondence to clusters is depicted by color bar on the right side of the heatmap and annotated with cell type. Signal is aggregated per 250 bp windows and binarized. e-h. Aggregated pseudobulk scCUT&Tag profiles for four histone modifications in all identified cell types around selected marker genes.
Extended Data Figure 5
Extended Data Figure 5. Summary of meta features of cells analyzed by scCUT&Tag.
a. Two dimensional UMAP embedding of the scCUT&Tag data. Cells are colored by correspondence to GFP population, developmental age and biological replicate. b-c. Bar plot summary of the correspondence to the (b) GFP population and (c) developmental age per cell type identified from the H3K4me3 scCUT&Tag data.
Extended Data Figure 6
Extended Data Figure 6. Comparison of merged profiles of populations identified from scCUT&Tag data and corresponding bulk ChIP-seq or bulk Cut&Run data.
a. Genome browser view of a representative region harboring microglia-specific and neuron-specific H3K27me3 peak regions (highlighted in grey). b. PCA analysis and pearson correlation matrix of merged scCUT&Tag profiles per cluster and bulk ChIP-seq and bulk Cut&Run data. PCA was performed on top 150 most variable marker regions selected from scCUT&Tag data. Heatmap shows pearson’s correlation coefficient of signal in the same features. c. Relative cell type proportions identified from scCUT&Tag data and scRNA-seq data from biological replicates.
Extended Data Figure 7
Extended Data Figure 7. Metagene analysis of gene activity scores.
a-d. Metagene activity projection of scCUT&Tag data on the UMAP embeddings of four histone modification scCUT&Tag datasets. Metagenes are selected as top 100 most specifically expressed in the scRNA-seq data.
Extended Data Figure 8
Extended Data Figure 8. Gene Ontology analysis of H3K4me3 scCUT&Tag marker genes.
a. Gene ontology analysis of the marker genes determined by gene activity scores from the H3K4me3 scCUT&Tag data. GO terms were manually selected from the list of all enriched GO terms in all populations.
Extended Data Figure 9
Extended Data Figure 9. scCUT&Tag of transcription factors.
a. Meta-region activity scores of marker regions determined from H3K4me3 scCUT&Tag data and specific for the respective population for (a) Olig2 and (b) Rad21 scCUT&Tag data. c-d. Boxplot representation of a and b, single cell meta-region profiles aggregated per cell type. Lower and upper bound of boxplot specify 25th and 75th percentile and lower and upper whisker specifies minimum and maximum no further than 1.5 times of inter-quantile range. Outliers are not displayed. non_oligo cells n=2877, oligo cells n=1667. e-f. Co-embedding of (e) H3K27ac and Olig2 and (f) H3K27ac and Rad21 in single two-dimensional UMAP space. g. Additional motifs identified using MEME from the merged pseudobulk profile of Olig2 scCUT&Tag.
Extended Data Figure 10
Extended Data Figure 10. Benchmarking of loops predicted by the ABC model with scCUT&Tag data.
a. Bar plot depicting fraction of loops predicted by the ABC model with scCUT&Tag data that overlap with loops predicted by ABC model with bulk CUT&Tag data. b. Venn diagram showing the overlap of loops predicted with scCUT&Tag data with loops predicted with ABC model with bulk CUT&Run data and Cicero. c. Scatter plot showing consistency of predictions of ABC model run with downscaled scCUT&Tag data. d.Boxplot representation of lengths of the loops predicted by various methods. Lower and upper bound of boxplot specify 25th and 75th percentile and lower and upper whisker specifies minimum and maximum no further than 1.5 times of inter-quantile range. Outliers are not displayed. mOL n=1796, Astrocytes n=1506, OEC n=913, Unknown n=160.
Figure 1
Figure 1. Single-cell profiling of several histone modifications in the mouse brain.
a. Schematic of the scCut&Tag experimental design. Cells were isolated from mouse brain at age P15 or P25, sorted either for GFP+ or GFP-population; nuclei were isolated and incubated with specific antibody against chromatin modifications or transcription factors and tagmented using proteinA-Tn5 fusion and processed by the 10x chromium scATAC-seq protocol. b. Schematic of the analysis strategy. scCUT&Tag signal was aggregated into cell x bin matrix, with various bin size (5kb or 50kb); dimensionality reduction was performed using LSI and UMAP and clustering using SNN. Cell clusters were used to identify marker regions, gene activity scores was calculated per cell and integration with other datasets was performed. c. Comparison of number of unique reads per antibody in scCUT&Tag experiments. Lower and upper bound of boxplot specify 25th and 75th percentile and lower and upper whisker specifies minimum and maximum no further than 1.5 times of inter-quantile range. Outliers are not displayed. H3K4me3 – n=13739 cells from 4 biological replicates; H3K27ac – n=10414 cells from 2 biological replicates; H3K27me3 – n=13932 from 4 biological replicates; H3K36me3 – n=4350 cells from 2 biological replicates d. Comparison of percentage of reads falling into peak regions per antibody in scCUT&Tag experiments. Peaks were obtained by peak calling in merged bulk datasets. Lower and upper bound of boxplot specify 25th and 75th percentile and lower and upper whisker specifies minimum and maximum no further than 1.5 times of inter-quantile range. Outliers are not displayed. H3K4me3 – n=13739 cells from 4 biological replicates; H3K27ac – n=10414 cells from 2 biological replicates; H3K27me3 – n=13932 from 4 biological replicates; H3K36me3 – n=4350 cells from 2 biological replicates. e. Distribution of fragment lengths scCUT&Tag experiments per antibody. f-i. two-dimensional UMAP representation of the scCUT&Tag data for H3K4me3, n=4 (f), H3K27me3, n=4 (g), H3K27ac, n=2 (h) and H3K36me3, n=2 (i). AST – Astrocytes, MOL – Mature Oligodendrocytes, OPC - Oligodendrocyte progenitor cells, NEU – Neurons, MGL - Microglia, VLMC – Vascular and leptomeningeal cells, OEC – Olfactory ensheating cells. j. Pseudo-bulk scCUT&Tag profiles of H3K4me3 aggregated by cell type at markers’ loci. k. Heatmap showing H3K4me3 signal intensity in top 50 most specifically enriched genomic bins per cluster (rows) and single cells (columns). Cells are randomly sampled and 5% of total number of cells are displayed. Color bars in rows specify marker cluster, and in columns cell metadata (Age, GFP).
Figure 2
Figure 2. De novo identification of cell types by cell type specific scCut&Tag marker regions.
a-b. Projection of scCut&Tag gene activity scores of (a) H3K4me3 and (b) H3K27me3 on two-dimensional UMAP embedding. Gene name is depicted in the title and specific population is highlighted in the UMAP plot by labeling the cell type. c-d. Heatmap representation of the scCUT&Tag signal for (c) H3K4me3 and (d) H3K27me3. X axis represents genomic region, each row in Y axis contains data from one cell. Cell correspondence to clusters is depicted by color bar on the right side of the heatmap and annotated with cell type. Signal is aggregated per 250 bp windows and binarized. e-f. Aggregated pseudobulk scCUT&Tag profiles for four histone modifications in all identified cell types at the loci of selected marker genes (Slc1a2 – astrocytes and Mbp – oligodendrocytes).
Figure 3
Figure 3. Integration of the scCUT&Tag data with single-cell gene expression
a. Coembedding of the H3K4me3 scCUT&Tag data together with the mouse brain atlas scRNA-seq data. b. Coembedding of the H3K4me3 of OPC and MOL clusters together with the scRNA-seq data depicting heterogeneity of the OLG lineage. c. Metagene activity scores of OLG lineage sub-clusters. Activity scores are calculated by aggregating the H3K4me3 scCUT&Tag signal (in gene body and promoter) over the 200 most specific genes (determined by p-value) expressed in the corresponding scRNA-seq cluster. The corresponding scRNA-seq populations are highlighted in the UMAP plots in the bottom row d. Ridgeline plots depicting histogram of number of unique reads per population of four histone modifications. e. Coembedding of the scCUT&Tag data of three active histone modifications – H3K4me3, H3K27ac and H3K36me3 in a single two-dimensional UMAP space. H3K4me3 dataset was filtered for cells corresponding to populations present in the GFP+ samples. f-g. Metagene heatmaps of (f) H3K4me3 and (g) H3K27me3 occupancy in populations (x axis) at the loci of H3K4me3 peaks (y axis). Arrows highlight the H3K4me3 signal in MOL and OPC populations around the AST marker regions. AST – Astrocytes, MOL – Mature Oligodendrocytes, OPC - Oligodendrocyte progenitor cells, NFOL – Newly formed oligodendrocytes, NEU – Neurons, MGL - Microglia, VLMC – Vascular and leptomeningeal cells, OEC – Olfactory ensheating cells.
Figure 4
Figure 4. Spreading of H3K4me3 mark at promoters at single-cell resolution.
a. Histogram of breadth of H3K4me3 around promoters of all annotated genes (all_genes) and genes that are marker genes for specific populations in scRNA-seq (marker_genes). b. Cumulative distribution of the breadth of H3K4me3 peaks around the promoters of marker genes identified from scRNA-seq. c. Pseudotime analysis of the OLG lineage H3K4me3 scCUT&Tag data that was integrated with scRNA-seq data. d. MOL signature score (H3K4me3 signal in MOL-specific gene body and promoter normalized to total number of reads in each cell) projected on the UMAP representation of H3K4me3 scCUT&Tag data. e. Heatmap depicting H3K4me3 spreading from the promoters of MOL-specific genes. Each row represents a single cell. Cells are ordered by the MOL signature score, that is correlated also with pseudotime. X axis shows the genomic distance from the meta-promoter (-3kb / +10kb). Meta-promoters are promoters of top 100 most specifically expressed genes in MOLs defined by scRNA-seq data.
Figure 5
Figure 5. scCUT&Tag analysis of transcription factors binding.
a-b. Two dimensional UMAP embedding of (a) Olig2 and (b) Rad21 scCUT&Tag data with coloring by the number of unique reads per cell. c-d UMAP embedding of the (c) Olig2 and (d) Rad21 scCUT&Tag with coloring by the cell type. e. Pseudobulk profiles of Olig2 and Rad21 scCUT&Tag data aggregated by cell type around the marker gene regions. f. RNA expression of Olig2 from scRNA-seq data for cell types present in Sox10-Cre/RCE+ populations. g. Logo representation of the motif that was found to be the most enriched in the scCUT&Tag of Rad21 and its alignment with the motif of transcription factor Ctcf retrieved from the Jaspar database. h. Logo representation of the motif found to be enriched in the Olig2 Cut&Tag that is consistent with the previously reported Olig2-specific motif,. The newly discovered motif was compared to known motifs from Jaspar database using TomTom from MEME suite without small sample correction (--no-ssc option). AST – Astrocytes, MOL – Mature Oligodendrocytes, OPC - Oligodendrocyte progenitor cells, NEU – Neurons, MGL - Microglia, VLMC – Vascular and leptomeningeal cells, OEC – Olfactory ensheating cells.
Figure 6
Figure 6. Prediction of gene regulatory networks from the scCUT&Tag data
a. Schematic depicting the strategy used to predict and validate the promoter-enhancer specific loops. Loops are predicted using the H3K27ac scCUT&Tag and other publicly available datasets (see Methods). Presence of loops is validated by H3K27ac HiChIP analysis of purified populations of OLG lineage b. Pileup analysis of 200,000 loops predicted by the ABC model. Signal of HiChIP performed in either mES cells or OLG lineage cells was aggregated and plotted as a heatmap with the center at the intersection of the loop coordinates. c. Pileup analysis of loops predicted by ABC and filtered using H3K4me3 (~61,000 loops) and Rad21 (~5000 loops) scCUT&Tag data. d. Representative overlay of OLG HiChIP matrix with the loops predicted by the ABC model from the scCUT&Tag data and filtered with the H3K4me3 signal (black dots). e. Representative example of the loops predicted by Cicero and ABC model from H3K27ac scCUT&Tag data. Known Sox10 enhancers and putative new candidate enhancers are highlighted with grey bars.

References

    1. Zeisel A, et al. Molecular Architecture of the Mouse Nervous System. Cell. 2018;174:999–1014.e22. - PMC - PubMed
    1. La Manno G, et al. RNA velocity of single cells. Nature. 2018;560:494–498. - PMC - PubMed
    1. Buenrostro JD, et al. Single-cell chromatin accessibility reveals principles of regulatory variation. Nature. 2015;523:486–490. - PMC - PubMed
    1. Lorthongpanich C, et al. Single-Cell DNA-Methylation Analysis Reveals Epigenetic Chimerism in Preimplantation Embryos. Science. 2013;341:1110–1112. - PubMed
    1. Skene PJ, Henikoff S. An efficient targeted nuclease strategy for high-resolution mapping of DNA binding sites. eLife. 6 - PMC - PubMed

Publication types