

Comparison of seven commercial SARS-CoV-2 rapid point-of-care antigen tests: a single-centre laboratory evaluation study
- PMID: 33846704
- PMCID: PMC8026170
- DOI: 10.1016/S2666-5247(21)00056-2
Comparison of seven commercial SARS-CoV-2 rapid point-of-care antigen tests: a single-centre laboratory evaluation study
Abstract
Background: Antigen point-of-care tests (AgPOCTs) can accelerate SARS-CoV-2 testing. As some AgPOCTs have become available, interest is growing in their utility and performance. Here we aimed to compare the analytical sensitivity and specificity of seven commercially available AgPOCT devices.
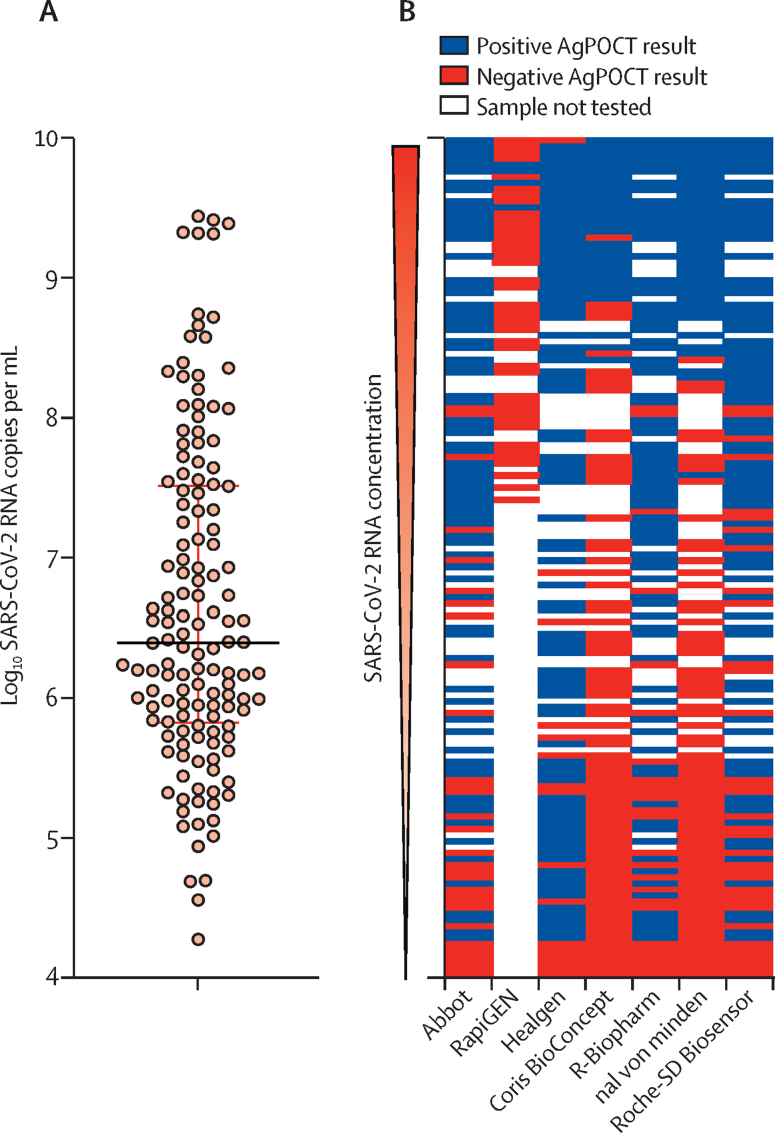
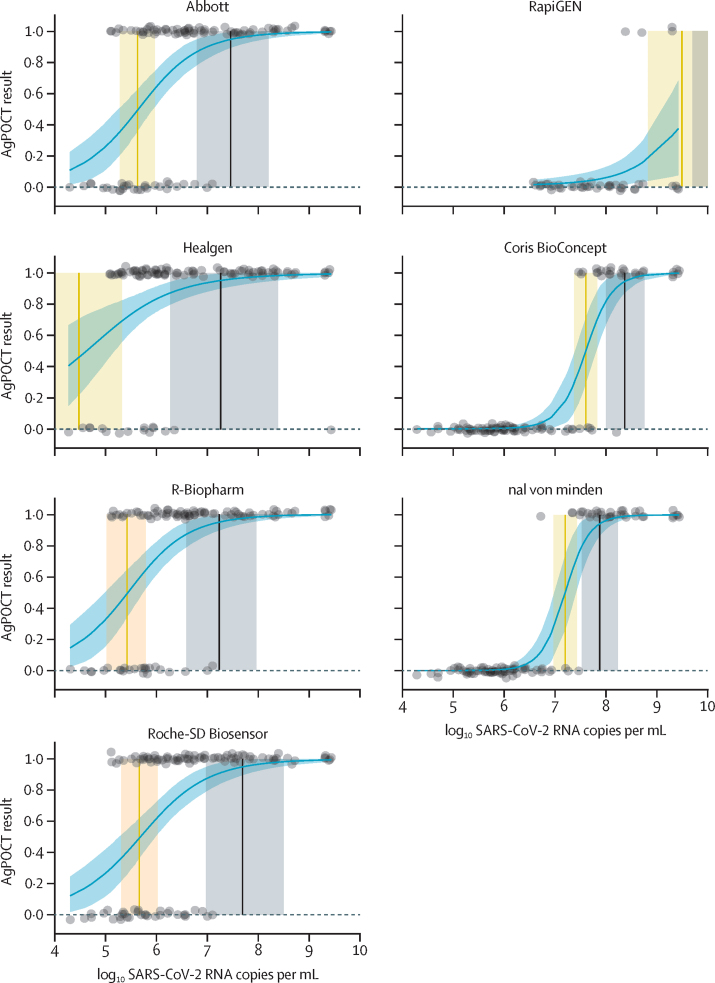
Methods: In a single-centre, laboratory evaluation study, we compared AgPOCT products from seven suppliers: the Abbott Panbio COVID-19 Ag Rapid Test, the RapiGEN BIOCREDIT COVID-19 Ag, the Healgen Coronavirus Ag Rapid Test Cassette (Swab), the Coris BioConcept COVID-19 Ag Respi-Strip, the R-Biopharm RIDA QUICK SARS-CoV-2 Antigen, the nal von minden NADAL COVID-19 Ag Test, and the Roche-SD Biosensor SARS-CoV Rapid Antigen Test. Tests were evaluated on recombinant SARS-CoV-2 nucleoprotein, cultured endemic and emerging coronaviruses, stored respiratory samples with known SARS-CoV-2 viral loads, stored samples from patients with respiratory pathogens other than SARS-CoV-2, and self-sampled swabs from healthy volunteers. We estimated analytical sensitivity in terms of approximate viral concentrations (quantified by real-time RT-PCR) that yielded positive AgPOCT results, and specificity in terms of propensity to generate false-positive results.
Findings: In 138 clinical samples with quantified SARS-CoV-2 viral load, the 95% limit of detection (concentration at which 95% of test results were positive) in six of seven AgPOCT products ranged between 2·07 × 106 and 2·86 × 107 copies per swab, with an outlier (RapiGEN) at 1·57 × 1010 copies per swab. The assays showed no cross-reactivity towards cell culture or tissue culture supernatants containing any of the four endemic human coronaviruses (HCoV‑229E, HCoV‑NL63, HCoV‑OC43, or HCoV‑HKU1) or MERS-CoV, with the exception of the Healgen assay in one repeat test on HCoV-HKU1 supernatant. SARS-CoV was cross-detected by all assays. Cumulative specificities among stored clinical samples with non-SARS-CoV-2 infections (n=100) and self-samples from healthy volunteers (n=35; cumulative sample n=135) ranged between 98·5% (95% CI 94·2-99·7) and 100·0% (97·2-100·0) in five products, with two outliers at 94·8% (89·2-97·7; R-Biopharm) and 88·9% (82·1-93·4; Healgen). False-positive results did not appear to be associated with any specific respiratory pathogen.
Interpretation: The sensitivity range of most AgPOCTs overlaps with SARS-CoV-2 viral loads typically observed in the first week of symptoms, which marks the infectious period in most patients. The AgPOCTs with limit of detections that approximate virus concentrations at which patients are infectious might enable shortcuts in decision making in various areas of health care and public health.
Funding: EU's Horizon 2020 research and innovation programme, German Ministry of Research, German Federal Ministry for Economic Affairs and Energy, German Ministry of Health, and Bill & Melinda Gates Foundation.
© 2021 The Author(s). Published by Elsevier Ltd. This is an Open Access article under the CC BY 4.0 license.
Conflict of interest statement
We declare no competing interests.
Figures
Comment in
-
Précision diagnostique de deux tests rapides antigéniques SARS-CoV-2.Rev Med Suisse. 2021 May 5;17(737):898-899. Rev Med Suisse. 2021. PMID: 33950594 French. No abstract available.
References
-
- WHO Diagnostic testing for SARS-CoV-2. Interim guidance. Sept 11, 2020. https://www.who.int/publications/i/item/diagnostic-testing-for-sars-cov-2
-
- Guglielmi G. The explosion of new coronavirus tests that could help to end the pandemic. Nature. 2020;583:506–509. - PubMed
Publication types
MeSH terms
Substances
LinkOut - more resources
Full Text Sources
Other Literature Sources
Medical
Miscellaneous
