Observational Study
. 2021 Apr 13:10:e65266.
doi: 10.7554/eLife.65266.

Quantifying noxious-evoked baseline sensitivity in neonates to optimise analgesic trials

Affiliations
Observational Study

Quantifying noxious-evoked baseline sensitivity in neonates to optimise analgesic trials

Maria M Cobo et al. Elife. .

Abstract

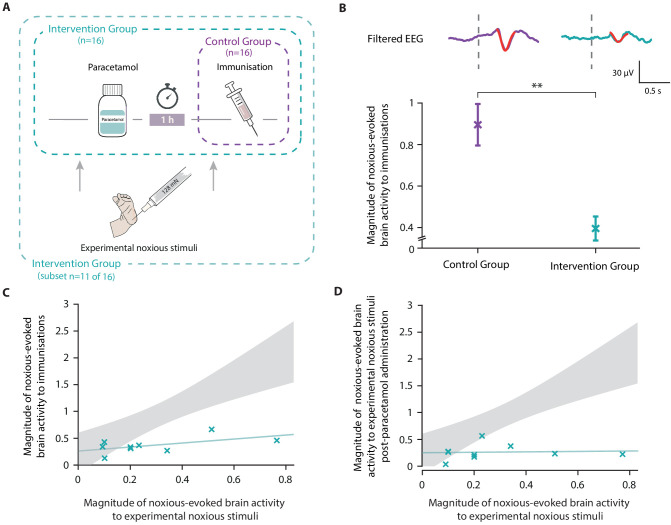
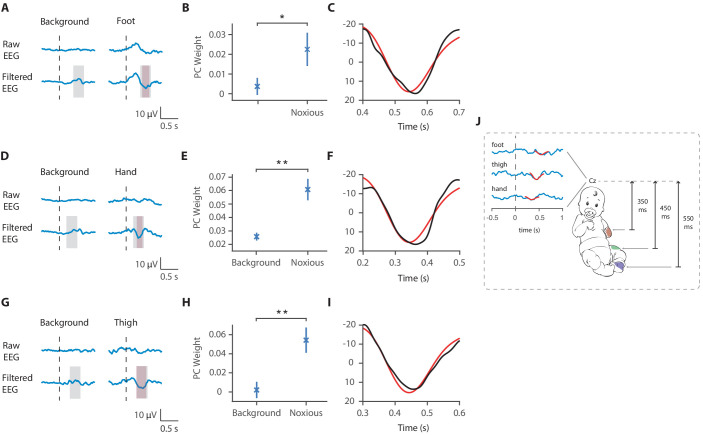
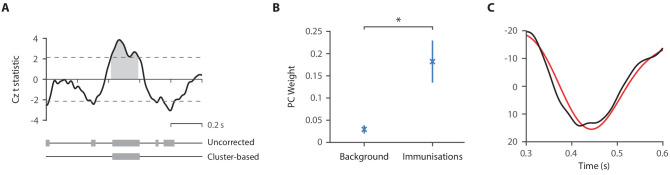
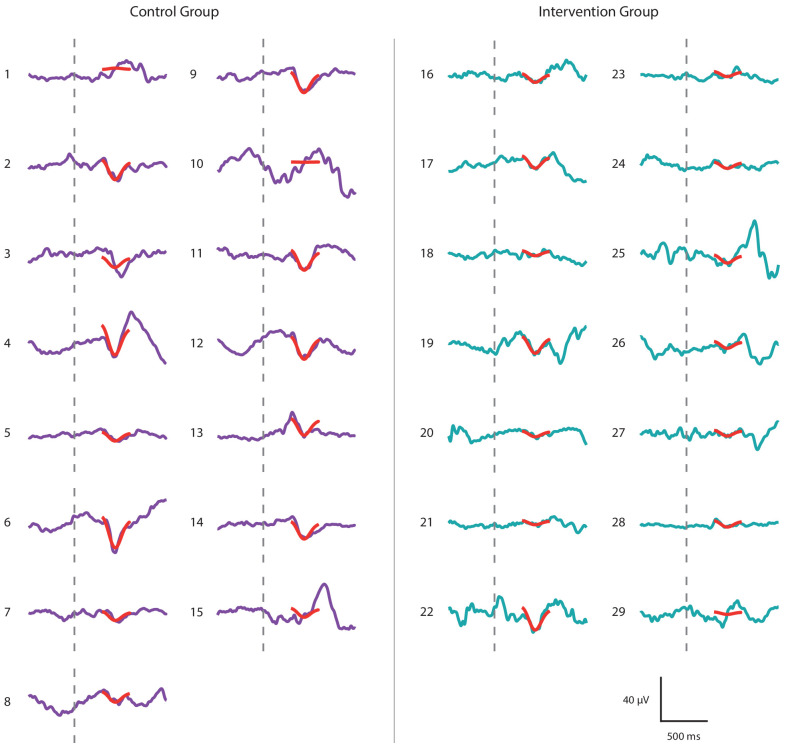
Despite the high burden of pain experienced by hospitalised neonates, there are few analgesics with proven efficacy. Testing analgesics in neonates is experimentally and ethically challenging and minimising the number of neonates required to demonstrate efficacy is essential. EEG (electroencephalography)-derived measures of noxious-evoked brain activity can be used to assess analgesic efficacy; however, as variability exists in neonate's responses to painful procedures, large sample sizes are often required. Here, we present an experimental paradigm to account for individual differences in noxious-evoked baseline sensitivity which can be used to improve the design of analgesic trials in neonates. The paradigm is developed and tested across four observational studies using clinical, experimental, and simulated data (92 neonates). We provide evidence of the efficacy of gentle brushing and paracetamol, substantiating the need for randomised controlled trials of these interventions. This work provides an important step towards safe, cost-effective clinical trials of analgesics in neonates.

Keywords: analgesic clinical trials; baseline sensitivity; human; medicine; neonates; neuroscience.

Plain language summary

Hospitalized newborns often undergo medical procedures, like blood tests, without pain relief. This can cause the baby to experience short-term distress that may have negative consequences later in life. However, testing the effects of pain relief in newborns is challenging because, unlike adults, they cannot report how much pain they are experiencing. One way to overcome this is to record the brain activity of newborns during a painful procedure and to see how these signals are modified following pain relief. Randomized controlled trials are the gold standard for these kinds of medical assessments, but require a high number of participants to account for individual differences in how babies respond to pain. Finding ways to reduce the size of pain control studies could lead to faster development of pain relief methods. Here, Cobo, Hartley et al. demonstrate a way to reduce the number of newborns needed to test potential pain-relieving interventions. In the experiments, the brain activity of nine babies was measured after a gentle poke and after a painful clinically required procedure. Cobo, Hartley et al. found that the babies’ response to the gentle poke correlated with their response to pain. Further data analysis revealed that this information can be used to predict the variability in pain experienced by different newborns, reducing the number of participants needed for pain relief trials. Next, Cobo, Hartley et al. used this new approach in two pilot tests. One showed that gently stroking an infant’s leg before blood is drawn from their heel reduced their brains’ response to pain. The second showed that giving a baby the painkiller paracetamol lessened the brain’s response to immunisation. The new approach identified by Cobo, Hartley et al. may enable smaller studies that can more quickly identify ways to reduce pain in babies. Furthermore, this work suggests that gentle brushing and paracetamol could provide pain relief for newborns undergoing hospital acute procedures. However, more formal clinical trials are needed to test the effectiveness of these two strategies.


Conflict of interest statement

MC, CH, DG, FA, Mv, GS, LB, ED, MB, RE, GG, AH, RR, EA, FM, RS No competing interests declared

Figures

Figure 1.
Figure 1.. Noxious-evoked sensitivity paradigm explained.
Schematic representation of the noxious-evoked sensitivity paradigm components. A brief description of each step is included with additional explanatory notes.
Figure 2.
Figure 2.. Magnitude of noxious-evoked brain activity in response to experimental noxious stimuli correlates with the response to a clinically required heel lance and can be used as a measure of baseline sensitivity to reduce sample sizes.
(A) The magnitude of noxious-evoked brain activity following mild experimental noxious stimuli and a clinically required heel lance was significantly correlated within-subject (p=0.0025, R2 = 0.77, n = 9, Pearson correlation test, Study 1); grey solid line indicates line of best fit. Dashed lines and their corresponding electroencephalography (EEG) traces indicate three neonates with a range of response magnitudes. The magnitude of the brain activity was quantified using a template of noxious-evoked activity, shown overlaid in red (Hartley et al., 2017). (B-E) In Study 2, we used simulated data to investigate how sample size is altered when the relationship in (A) is considered. (B) For each sample size, 1000 data sets were simulated with a 40% reduction in the response to a clinically required procedure assumed in the Intervention Group. The power (percentage of significant results, p<0.05) to detect a difference between the two groups was calculated for each sample size using a linear regression with (red) and without (blue) accounting for individual differences in baseline sensitivity. (C) The number of neonates required to achieve 95% power with different levels of intervention effect. Simulations were run with increasing numbers of neonates until 95% power was achieved. (D) Percentage reduction in the number of neonates required per group when individual baseline sensitivity is accounted for compared with not accounting for baseline sensitivity (power = 95%). (E) The percentage reduction in the number of neonates required per group with different degrees of correlation (standard deviation of residuals) between the responses to experimental noxious stimuli and clinically required procedure (40% intervention effect, 95% power). The red marker indicates the standard deviation of residuals (SD = 0.37) in (A) (Figure 2—source data 1). The code to produce (B-E) is available from https://gitlab.com/paediatric_neuroimaging/simulating_power_nociceptive_sensitivity.git.
Figure 3.
Figure 3.. Accounting for individual baseline sensitivity in the assessment of efficacy of a gentle touch intervention.
(A) The magnitude of the noxious-evoked brain activity following a mild experimental noxious stimulus compared with the clinically required heel lance for each neonate in the Control Group (n = 15). Solid line indicates line of best fit. (B) (Top) Group average raw electroencephalography (EEG) and (Woody) filtered EEG traces in response to the clinically required heel lance; Control Group (purple) and Intervention Group (neonates received gentle touch at a rate of approximately 3 cm/s for 10 s prior to the heel lance, n = 16) (blue). Dashed lines indicate the point of stimulation; the template of noxious-evoked brain activity is shown overlaid in red. Each neonate’s EEG responses to the experimental noxious stimulus and the heel lance are shown in Figure 3—figure supplement 1. (Bottom) Magnitude of the noxious-evoked brain activity following heel lance in the two groups. Error bars indicate mean ± standard error. (C) Comparison of the stimulus responses for each neonate in the Intervention Group. Gentle touch was not applied prior to the experimental noxious stimuli so that each neonate’s individual baseline sensitivity could be assessed. (D) Confidence intervals of the correlations for the two groups shown overlaid: Control Group (purple), Intervention Group (blue), solid lines indicate line of best fit. The effect of the intervention (gentle touch) is demonstrated by the difference between the two groups’ confidence intervals and is most evident in neonates who have greater baseline sensitivity (i.e. higher responses to the experimental noxious stimulus) (Figure 3—source data 1).
Figure 3—figure supplement 1.
Figure 3—figure supplement 1.. Noxious-evoked brain activity in individual neonates in the Control Group and Intervention Group, Study 3.
Average noxious-evoked brain activity to the experimental noxious stimuli and the corresponding brain activity following heel lancing within the 31 neonates in Study 3. The template of noxious-evoked brain activity (Hartley et al., 2017) is overlaid in red and the grey dashed lines indicate the point of stimulation. Neonates in the Intervention Group (electroencephalography [EEG] traces in blue) received gentle brushing before the heel lancing.
Figure 4.
Figure 4.. Effect of gentle touch on reflex responses.
(A) The magnitude of the reflex withdrawal following a mild experimental noxious stimulus (baseline reflex sensitivity) compared with the clinically required heel lance for each neonate in the Control Group (n = 18). Solid line indicates line of best fit. (B) Average electromyography (EMG) traces (top) for neonates in the Control Group (purple) and Intervention Group (blue, n = 15) where neonates were gently brushed at a rate of approximately 3 cm/s for 10 s prior to the heel lance. Dashed lines indicate the point of stimulation. Each neonate’s EMG responses to the experimental noxious stimulus and the heel lance are shown in Figure 4—figure supplement 1. (Bottom) Magnitude of the reflex withdrawal response in the two groups. Error bars indicate mean of the root mean square (RMS) of the reflex withdrawal ± standard error. (C) The magnitude of the reflex withdrawal following a mild experimental noxious stimulus (baseline reflex sensitivity) compared with the clinically required heel lance for each neonate in the Intervention Group (gentle touch) (Figure 4—source data 1).
Figure 4—figure supplement 1.
Figure 4—figure supplement 1.. Reflex withdrawal activity in individual neonates in the Control group and Intervention Group, Study 3.
Average reflex withdrawal in response to experimental noxious stimulation and reflex withdrawal evoked by heel lancing in the 31 neonates included in Study 3. Neonates in the Intervention Group (EMG traces in blue) received gentle brushing before the heel lancing.
Figure 5.
Figure 5.. Paracetamol significantly reduces noxious-evoked brain activity following immunisation.
(A) Experimental design of Study 4. Electroencephalography (EEG) was recorded during immunisations in neonates before (Control Group, n = 16) and after the guideline change (Intervention Group, n = 16, received paracetamol 1 hr prior to immunisation). A subset of neonates in the Intervention Group (n = 11 of 16) received experimental noxious stimuli before and approximately 1 hr after paracetamol administration. (B) Average (Woody) filtered EEG following immunisations are displayed (top); for the Control Group in purple and Intervention Group in teal, the template of noxious-evoked brain activity is shown overlaid in red. Dashed lines indicate the point of contact of the needle with the skin. The use of the template of noxious-evoked brain activity to quantify the magnitude of noxious-evoked brain activity from immunisation applied to the thigh was validated: Figure 5—figure supplement 1 and Figure 5—figure supplement 2. Individual neonate’s EEG responses to the immunisation are shown in Figure 5—figure supplement 3. (Bottom) Magnitude of the noxious-evoked brain activity following immunisations in the two groups (Control Group n = 15, Intervention Group n = 14), error bars indicate mean ± standard error (linear mixed effects regression model − without accounting for baseline sensitivity, t = 3.61, **p<0.001). (C) Magnitude of the noxious-evoked brain activity following the experimental noxious stimulus prior to paracetamol administration (baseline sensitivity) compared with the noxious-evoked brain activity to immunisation (which was approximately 1 hr after paracetamol administration) for each neonate in the Intervention Group subset (n = 9, markers in teal). For comparison, the confidence interval of the Control Group correlation in Study 3 (i.e. the correlation between the response to experimental noxious stimuli and a heel lance) is shown in grey. (D) Magnitude of the noxious-evoked brain activity to experimental noxious stimuli prior to paracetamol administration (baseline sensitivity) compared with the noxious-evoked brain activity to experimental noxious stimuli applied approximately 1 hr after paracetamol administration for each neonate in the Intervention Group subset (n = 9, markers in teal). For comparison, the confidence interval of the Control Group correlation in Study 3 (i.e. the correlation between the response to experimental noxious stimuli and a heel lance) is shown in grey (Figure 5—source data 1).
Figure 5—figure supplement 1.
Figure 5—figure supplement 1.. Latency of the noxious-evoked brain activity in response to stimulation on the foot, thigh, and hand.
(A) Raw average and Woody filtered electroencephalography (EEG) following experimental noxious stimuli of the foot and during background brain activity. (B) Principal component analysis (PCA) was conducted in the time window 400–700 ms after the stimulus and the second principal component weights were significantly higher to noxious stimulation of the foot compared with in the background brain activity (paired t-test, *p<0.05). (C) The second principal component waveform (black) was highly correlated with the previously described template of noxious-evoked brain activity (red). (D) Raw average and Woody filtered EEG following experimental noxious stimuli of the hand and during background brain activity. (E) PCA was conducted in the time window 200–500 ms after the stimulus and the second principal component weights were significantly higher to noxious stimulation of the hand compared with in the background brain activity (**p<0.001). (F) The second principal component waveform (black) was highly correlated with the previously described template of noxious-evoked brain activity (red). (G) Raw average and Woody filtered EEG following experimental noxious stimuli of the thigh and during background brain activity. (H) PCA was conducted in the time window 300–600 ms after the stimulus and the second principal component weights were significantly higher to noxious stimulation of the thigh compared with in the background brain activity (**p<0.001). (I) The second principal component waveform (black) was highly correlated with the previously described template of noxious-evoked brain activity (red). (J) Schematic representation of the latency of the noxious-evoked brain activity with stimuli applied across different locations. In panels (A,D,G) dashed lines show the timepoint of the stimulation. Pink shading shows the time window of the identified noxious response cluster and grey shading shows the time window where the PCA was performed.
Figure 5—figure supplement 2.
Figure 5—figure supplement 2.. Validation of the template for use in immunisation studies.
(A) t-Statistics from the comparison of the noxious-evoked brain activity following immunisations and during background brain activity in 15 neonates from the Control Group in Study 4. Dashed lines indicate the t-statistic threshold for cluster significance, set as the 97.5 percentile of the permuted data. The grey bars indicate time periods outside of the t-statistic threshold and the significant time window identified with the cluster analysis is illustrated by the grey shading area. (B) Principal component analysis was conducted in the time window 300–600 ms after the immunisations and the first principal component weights were significantly higher following immunisations compared with in the background brain activity (*p<0.01). (C) The first principal component waveform (black) was highly correlated with the previously described template of noxious-evoked brain activity (red).
Figure 5—figure supplement 3.
Figure 5—figure supplement 3.. Noxious-evoked brain activity following immunisations in individual neonates in the Control Group and Intervention Group, Study 4.
Average noxious-evoked brain activity in individual neonates following immunisations in the 29 neonates in Study 4. The template of noxious-evoked brain activity (Hartley et al., 2017) is overlaid in red and the grey dashed lines indicate the point of stimulation. Neonates in the Intervention Group (electroencephalography [EEG] traces in teal) received paracetamol approximately 1 hr prior to the immunisations.

References

    1. Allegaert K. Clinical studies in infants (pediatric pharmacology) In: Hock F, Gralinski M, editors. Drug Discovery and Evaluation: Methods in Clinical Pharmacology. Springer; 2017. pp. 1–16. - DOI
    1. Anand KJS, Hall RW, Desai N, Shephard B, Bergqvist LL, Young TE, Boyle EM, Carbajal R, Bhutani VK, Moore MB, Kronsberg SS, Barton BA. Effects of morphine analgesia in ventilated preterm neonates: primary outcomes from the NEOPAIN randomised trial. The Lancet. 2004;363:1673–1682. doi: 10.1016/S0140-6736(04)16251-X. - DOI - PubMed
    1. Ancora G, Lago P, Garetti E, Pirelli A, Merazzi D, Mastrocola M, Pierantoni L, Faldella G. Efficacy and safety of continuous infusion of fentanyl for pain control in preterm newborns on mechanical ventilation. The Journal of Pediatrics. 2013;163:645–651. doi: 10.1016/j.jpeds.2013.02.039. - DOI - PubMed
    1. Andrews K, Fitzgerald M. The cutaneous withdrawal reflex in human neonates: sensitization, receptive fields, and the effects of contralateral stimulation. Pain. 1994;56:95–101. doi: 10.1016/0304-3959(94)90154-6. - DOI - PubMed
    1. Andrews K, Fitzgerald M. Cutaneous flexion reflex in human neonates: a quantitative study of threshold and stimulus-response characteristics after single and repeated stimuli. Developmental Medicine & Child Neurology. 1999;41:696–703. doi: 10.1017/S0012162299001425. - DOI - PubMed

Publication types

MeSH terms