. 2021 Aug;53(8):622-632.
doi: 10.1080/23744235.2021.1910727. Epub 2021 Apr 13.

Visual scoring of chest CT at hospital admission predicts hospitalization time and intensive care admission in Covid-19

Affiliations

Visual scoring of chest CT at hospital admission predicts hospitalization time and intensive care admission in Covid-19

Erik Ahlstrand et al. Infect Dis (Lond). 2021 Aug.

Abstract

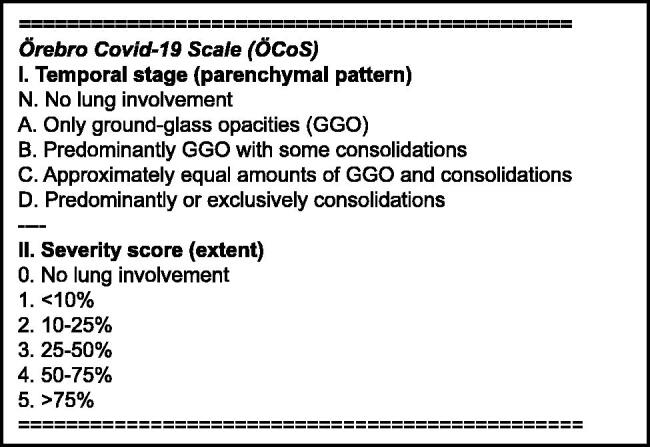
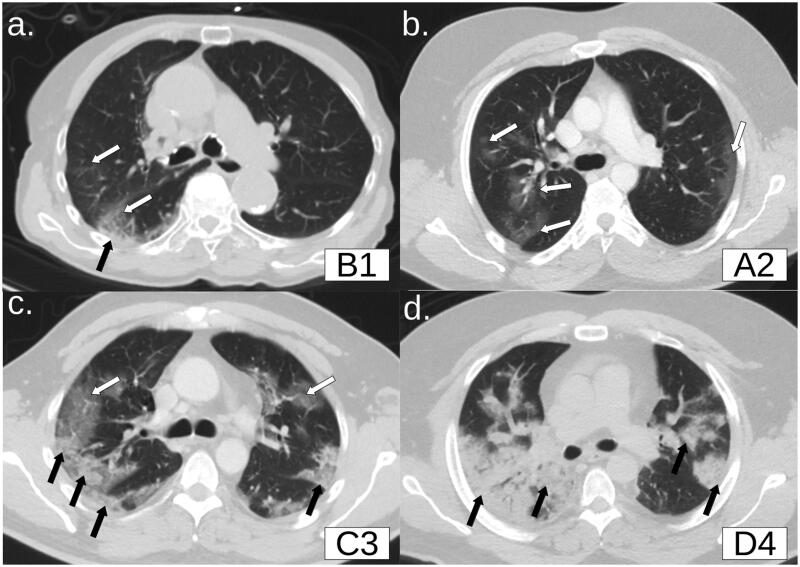
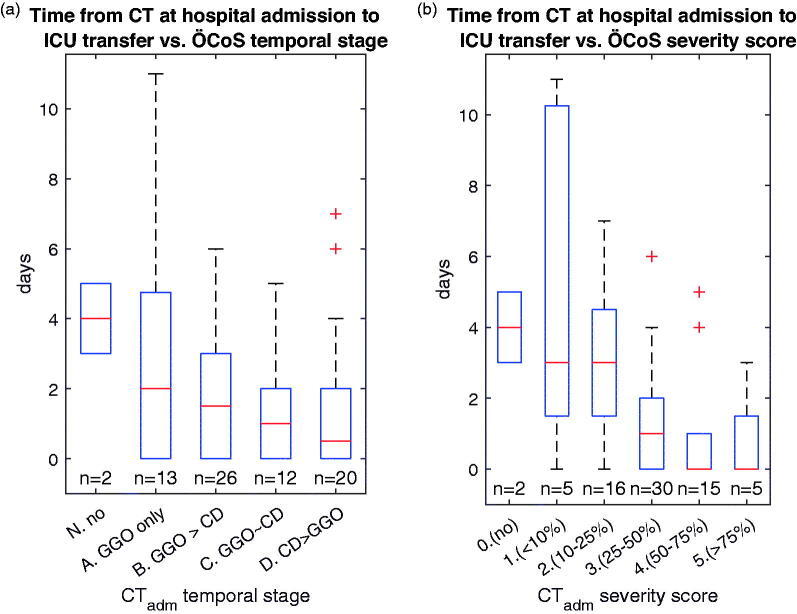
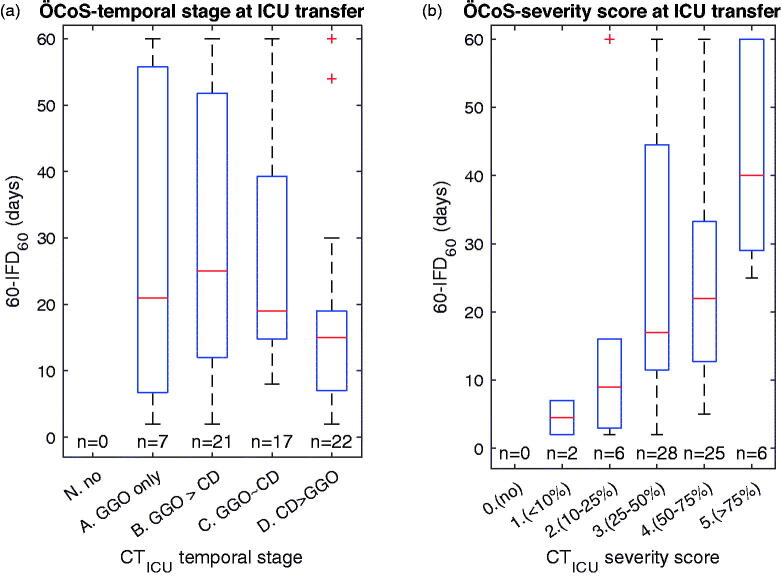
Background: Chest CT is prognostic in Covid-19 but there is a lack of consensus on how to report the CT findings. A chest CT scoring system, ÖCoS, was implemented in clinical routine on 1 April 2020, in Örebro Region, Sweden. The ÖCoS-severity score measures the extent of lung involvement. The objective of the study was to evaluate the ÖCoS scores as predictors of the clinical course of Covid-19.

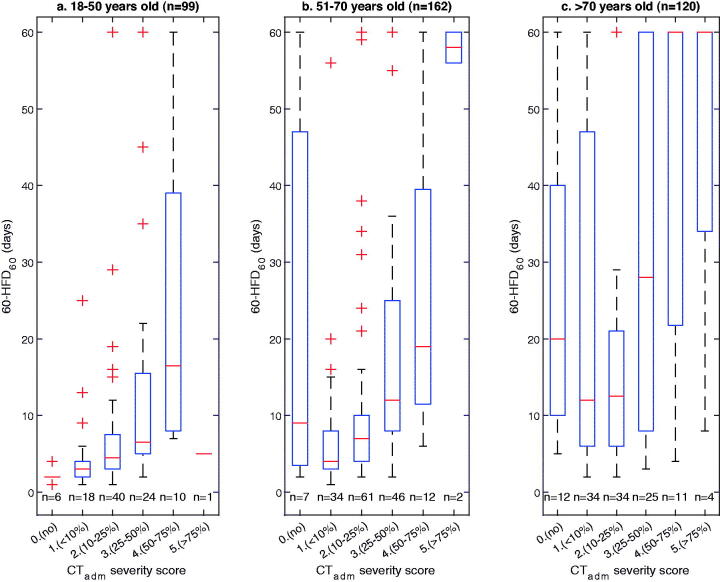
Methods: Population based study including data from all hospitalized patients with Covid-19 in Örebro Region during March to July 2020. We evaluated the correlations between CT scores at the time of admission to hospital and intensive care in relation to hospital and intensive care length of stay (LoS), intensive care admission and death. C-reactive protein and lymphocyte count were included as covariates in multivariate regression analyses.

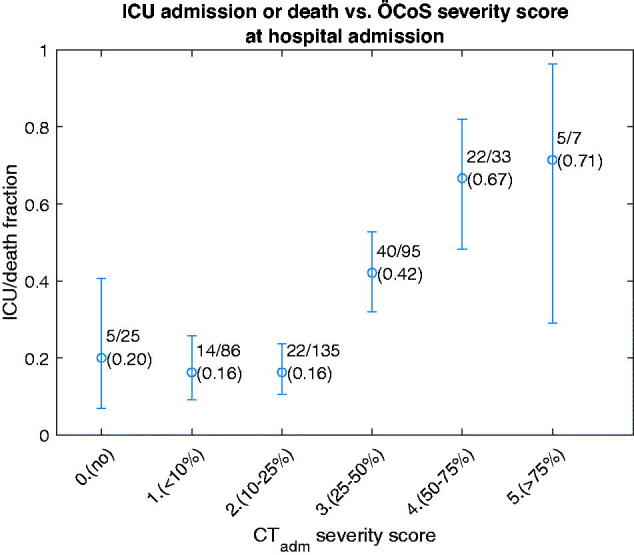
Results: In 381 included patients, the ÖCoS-severity score at admission closely correlated to hospital length of stay, and intensive care admission or death. At admission to intensive care, the ÖCoS-severity score correlated with intensive care length of stay. The ÖCoS-severity score was superior to basic inflammatory biomarkers in predicting clinical outcomes.

Conclusion: Chest CT visual scoring at admission to hospital predicted the clinical course of Covid-19 pneumonia.

Keywords: Covid-19; chest CT; computed tomography; prediction models; visual scoring.


Conflict of interest statement

No potential conflict of interest was reported by the author(s).

Figures

Figure 1.
Figure 1.
Inclusion and exclusion flowchart. ICU: intensive care unit; CTadm: CT at hospital admission; CTICU: CT at ICU admission.
Figure 2.
Figure 2.
The Örebro Covid-19 Scale. GGO: ground glass opacities. Crazy-paving pattern was assessed as GGO and organizing pneumonia pattern as consolidations. Only one selection for temporal stage and one selection for severity score was allowed. Stage N was always combined with severity 0 (N/0), and stages A–D were always combined with severity 1–5.
Figure 3.
Figure 3.
Lung window chest CT axial images at the level of carina demonstrating examples of Örebro Covid-19 Scale (ÖCoS) temporal stage and severity score. White arrows – ground-glass opacities (GGO). Black arrows – consolidations. (a) ÖCoS-temporal/severity B/1 (predominantly GGO, <10% lung involvement). (b) ÖCoS A/2 (Only GGO, 10–25% lung involvement). (c) ÖCoS C/3 (Approximately equal GGO and consolidations, 25–50%). (d) ÖCoS D/4 (Predominantly consolidations, 50–75%).
Figure 4.
Figure 4.
Box plot showing hospital length of stay, defined as 60-HFD60, in relation to ÖCoS severity score on CT at hospital admission for (a) 18–50 years old, (b) 51–70 years old, and (c) >70 years old. HFD60: 60-day hospital free living days.
Figure 5.
Figure 5.
Combined ICU admission and 60-day mortality rate in relation to ÖCoS severity score on CT at hospital admission. Whiskers show 95% confidence interval for the proportion. ICU: intensive care unit; ÖCoS: Örebro Covid-19 Scale.
Figure 6.
Figure 6.
Time between first CT at hospital admission and ICU transfer according to (a) ÖCoS-temporal stage and (b) ÖCoS-severity score. ICU: intensive care unit; ÖCoS: Örebro Covid-19 Scale; GGO: ground-glass opacities; CD: consolidations.
Figure 7.
Figure 7.
ICU length of stay, defined as 60-IFD60, in relation to (a) ÖCoS -temporal stage, and (b) ÖCoS-severity score in CT at ICU transfer. ICU: intensive care unit; IFD60: 60 day ICU free days; ÖCoS: Örebro Covid-19 Scale; GGO: ground-glass opacities; CD: consolidations.

References

    1. Dong E, Du H, Gardner L.. An interactive web-based dashboard to track COVID-19 in real time. Lancet Infect Dis. 2020;20(5):533–534. - PMC - PubMed
    1. Zhou F, Yu T, Du R, et al. . Clinical course and risk factors for mortality of adult inpatients with COVID-19 in Wuhan, China: a retrospective cohort study. Lancet. 2020;395(10229):1054–1062. - PMC - PubMed
    1. Williamson EJ, Walker AJ, Bhaskaran K, et al. . Factors associated with COVID-19-related death using OpenSAFELY. Nature. 2020;584(7821):430–436. - PMC - PubMed
    1. Siordia JA. Jr. Epidemiology and clinical features of COVID-19: a review of current literature. J Clin Virol. 2020;127:104357. - PMC - PubMed
    1. Reichberg SB, Mitra PP, Haghamad A, et al. . Rapid emergence of SARS-CoV-2 in the Greater New York metropolitan area: geolocation, demographics, positivity rates, and hospitalization for 46,793 persons tested by Northwell Health. Clin Infect Dis. 2020;71(12):3204–3213. - PMC - PubMed

Publication types