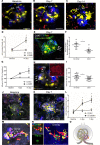
Serial intravital imaging captures dynamic and functional endothelial remodeling with single-cell resolution
- PMID: 33848265
- PMCID: PMC8262275
- DOI: 10.1172/jci.insight.123392
Serial intravital imaging captures dynamic and functional endothelial remodeling with single-cell resolution
Abstract
Endothelial cells are important in the maintenance of healthy blood vessels and in the development of vascular diseases. However, the origin and dynamics of endothelial precursors and remodeling at the single-cell level have been difficult to study in vivo owing to technical limitations. Therefore, we aimed to develop a direct visual approach to track the fate and function of single endothelial cells over several days and weeks in the same vascular bed in vivo using multiphoton microscopy (MPM) of transgenic Cdh5-Confetti mice and the kidney glomerulus as a model. Individual cells of the vascular endothelial lineage were identified and tracked owing to their unique color combination, based on the random expression of cyan/green/yellow/red fluorescent proteins. Experimental hypertension, hyperglycemia, and laser-induced endothelial cell ablation rapidly increased the number of new glomerular endothelial cells that appeared in clusters of the same color, suggesting clonal cell remodeling by local precursors at the vascular pole. Furthermore, intravital MPM allowed the detection of distinct structural and functional alterations of proliferating endothelial cells. No circulating Cdh5-Confetti+ cells were found in the renal cortex. Moreover, the heart, lung, and kidneys showed more significant clonal endothelial cell expansion compared with the brain, pancreas, liver, and spleen. In summary, we have demonstrated that serial MPM of Cdh5-Confetti mice in vivo is a powerful technical advance to study endothelial remodeling and repair in the kidney and other organs under physiological and disease conditions.
Keywords: Endothelial cells; Hypertension; Mouse models; Nephrology.
Figures


Similar articles
-
Novel in vivo techniques to visualize kidney anatomy and function.Kidney Int. 2015 Jul;88(1):44-51. doi: 10.1038/ki.2015.65. Epub 2015 Mar 4. Kidney Int. 2015. PMID: 25738253 Free PMC article. Review.
-
Tracking the fate of glomerular epithelial cells in vivo using serial multiphoton imaging in new mouse models with fluorescent lineage tags.Nat Med. 2013 Dec;19(12):1661-6. doi: 10.1038/nm.3405. Epub 2013 Nov 24. Nat Med. 2013. PMID: 24270544 Free PMC article.
-
Long-Term Cell Fate Tracking of Individual Renal Cells Using Serial Intravital Microscopy.Methods Mol Biol. 2020;2150:25-44. doi: 10.1007/7651_2019_232. Methods Mol Biol. 2020. PMID: 31087287 Free PMC article.
-
Novel fluorescence techniques to quantitate renal cell biology.Methods Cell Biol. 2019;154:85-107. doi: 10.1016/bs.mcb.2019.04.013. Epub 2019 May 17. Methods Cell Biol. 2019. PMID: 31493823 Free PMC article.
-
In vivo microscopy.Nephrol Ther. 2016 Apr;12 Suppl 1(Suppl 1):S21-4. doi: 10.1016/j.nephro.2016.01.004. Epub 2016 Mar 8. Nephrol Ther. 2016. PMID: 26968479 Free PMC article. Review.
Cited by
-
Longitudinal intravital microscopy of the mouse kidney: inflammatory responses to abdominal imaging windows.Am J Physiol Renal Physiol. 2024 Nov 1;327(5):F845-F868. doi: 10.1152/ajprenal.00071.2024. Epub 2024 Sep 26. Am J Physiol Renal Physiol. 2024. PMID: 39323386
-
Clonal Expansion in Cardiovascular Pathology.JACC Basic Transl Sci. 2023 Jul 19;9(1):120-144. doi: 10.1016/j.jacbts.2023.04.008. eCollection 2024 Jan. JACC Basic Transl Sci. 2023. PMID: 38362345 Free PMC article. Review.
-
The unique structural and functional characteristics of glomerular endothelial cell fenestrations and their potential as a therapeutic target in kidney disease.Am J Physiol Renal Physiol. 2023 Oct 1;325(4):F465-F478. doi: 10.1152/ajprenal.00036.2023. Epub 2023 Jul 20. Am J Physiol Renal Physiol. 2023. PMID: 37471420 Free PMC article. Review.
-
Intravital Multiphoton Microscopy as a Tool for Studying Renal Physiology, Pathophysiology and Therapeutics.Front Physiol. 2022 Mar 24;13:827280. doi: 10.3389/fphys.2022.827280. eCollection 2022. Front Physiol. 2022. PMID: 35399274 Free PMC article. Review.
-
Longitudinal tracking of acute kidney injury reveals injury propagation along the nephron.Nat Commun. 2023 Jul 21;14(1):4407. doi: 10.1038/s41467-023-40037-y. Nat Commun. 2023. PMID: 37479698 Free PMC article.
References
Publication types
MeSH terms
Grants and funding
LinkOut - more resources
Full Text Sources
Other Literature Sources
Molecular Biology Databases
Miscellaneous

