. 2021 Oct 22;144(9):2625-2634.
doi: 10.1093/brain/awab147.

Classification of neurological diseases using multi-dimensional CSF analysis

Affiliations

Classification of neurological diseases using multi-dimensional CSF analysis

Catharina C Gross et al. Brain. .

Abstract

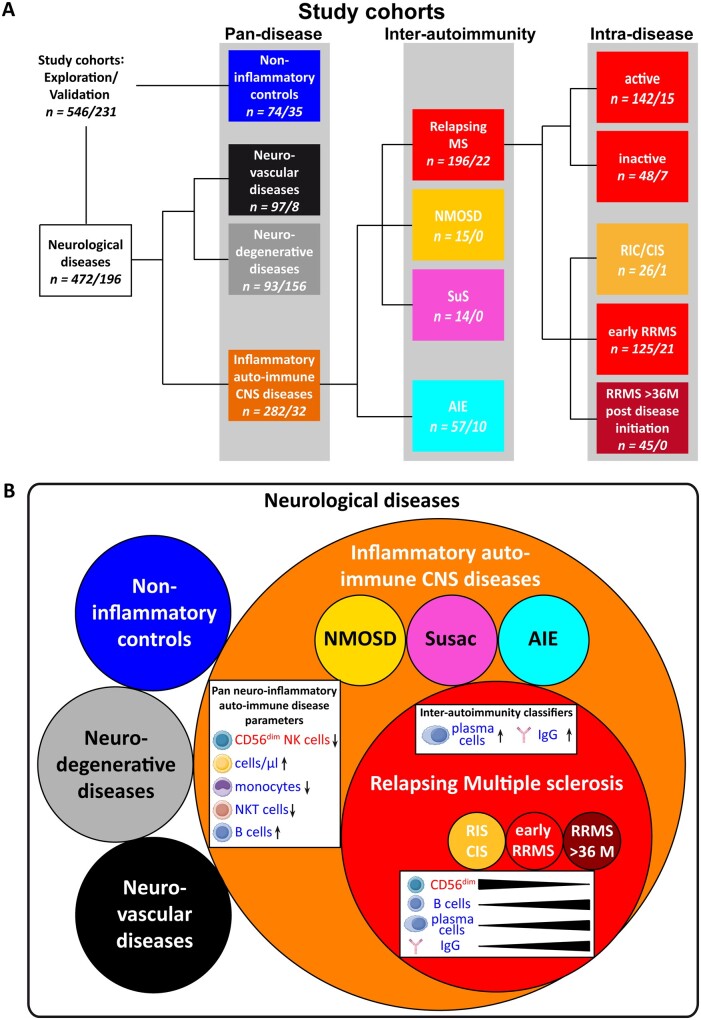
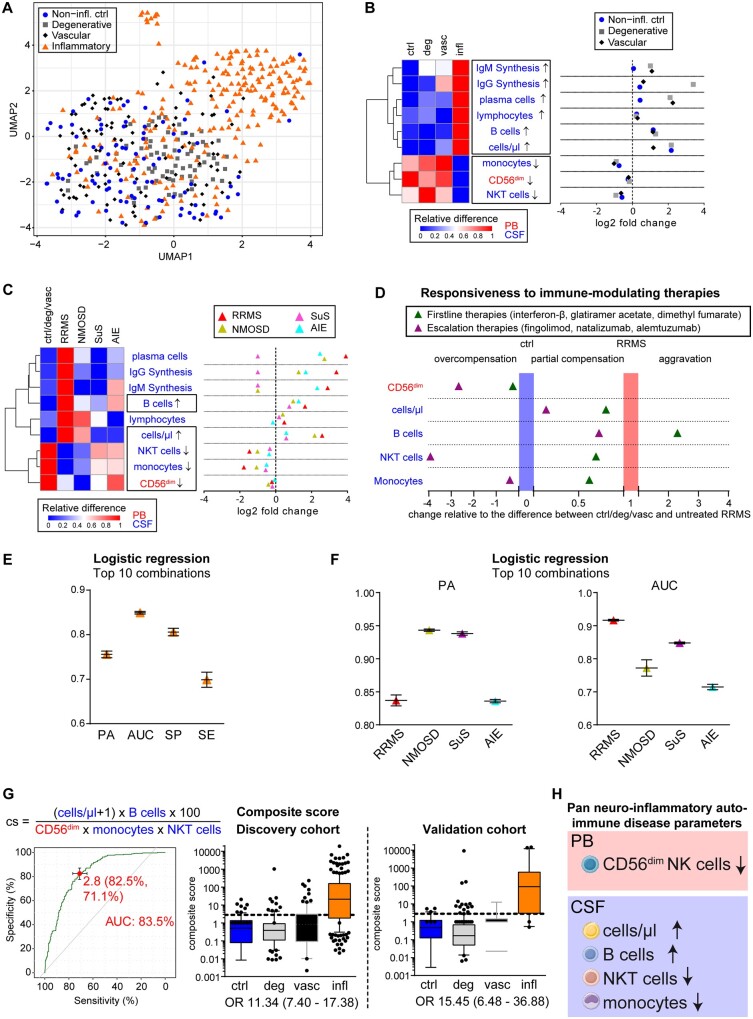
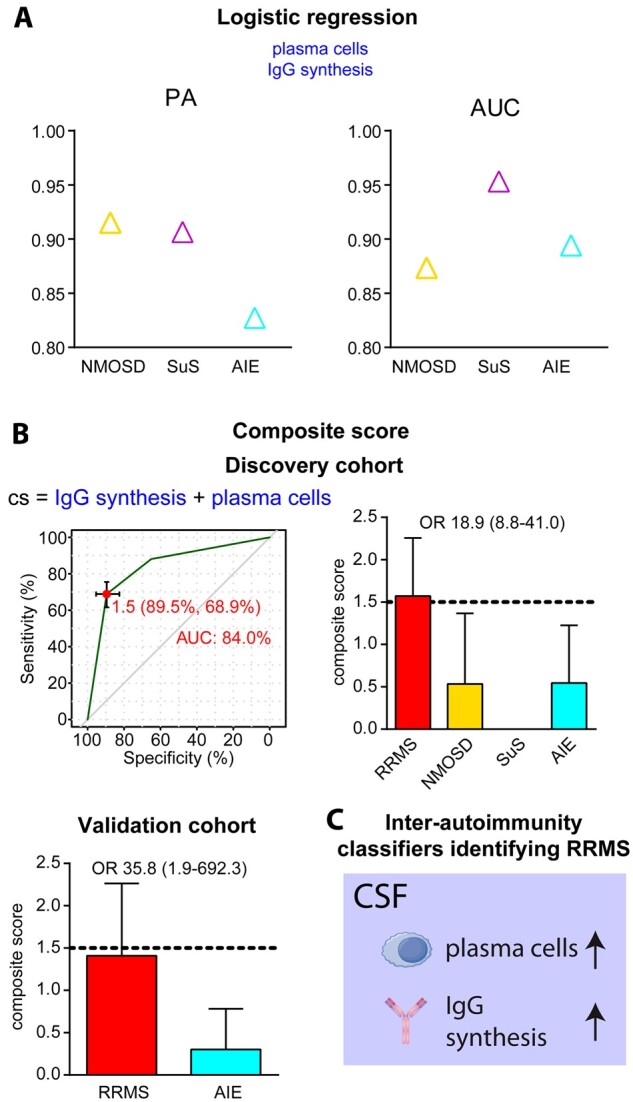
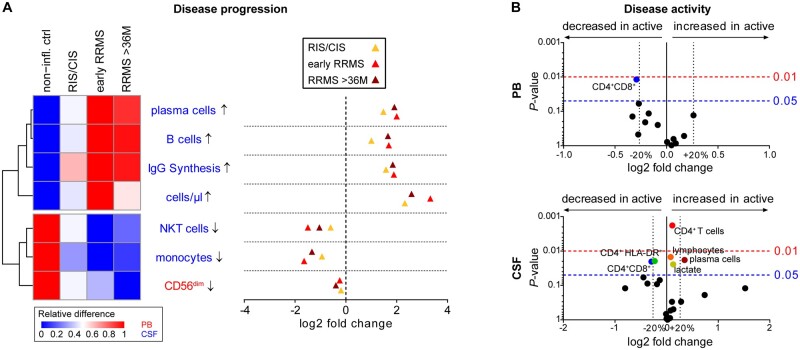
Although CSF analysis routinely enables the diagnosis of neurological diseases, it is mainly used for the gross distinction between infectious, autoimmune inflammatory, and degenerative disorders of the CNS. To investigate, whether a multi-dimensional cellular blood and CSF characterization can support the diagnosis of clinically similar neurological diseases, we analysed 546 patients with autoimmune neuroinflammatory, degenerative, or vascular conditions in a cross-sectional retrospective study. By combining feature selection with dimensionality reduction and machine learning approaches we identified pan-disease parameters that were altered across all autoimmune neuroinflammatory CNS diseases and differentiated them from other neurological conditions and inter-autoimmunity classifiers that subdifferentiate variants of CNS-directed autoimmunity. Pan-disease as well as diseases-specific changes formed a continuum, reflecting clinical disease evolution. A validation cohort of 231 independent patients confirmed that combining multiple parameters into composite scores can assist the classification of neurological patients. Overall, we showed that the integrated analysis of blood and CSF parameters improves the differential diagnosis of neurological diseases, thereby facilitating early treatment decisions.

Keywords: CNS autoimmunity; CSF; differential diagnosis; immune profile; multiple sclerosis.


Figures

Figure 1
Figure 1
Study cohorts and conclusion. (A) Data derived from patients undergoing routine as well as flow cytometric CSF analysis were investigated to identify factors assisting the classification of neurological diseases. The results from this discovery cohort (first n numbers) were validated in a comparable validation cohort (second n numbers). From a total of 546/231 patients undergoing routine as well as flow cytometric CSF analysis, a group of 74/35 individuals was identified as non-inflammatory controls (blue box). Furthermore, 97/8 patients with neuro-vascular (ischaemic stroke, black boxes) and 93/156 patients with neurodegenerative diseases (grey boxes, amyotrophic lateral sclerosis, n = 52/0; mild Alzheimer’s disease, n = 41/156) were included in the study. The orange box details 282/32 patients who suffered from inflammatory (auto-)immune CNS diseases, which could be further differentiated into patients with multiple sclerosis (MS; n = 196/22, red box), NMOSD (n = 15/0, yellow box), Susac syndrome (SuS; n = 14/0, magenta box), or AIE (n = 57/10, cyan box). Patients with RRMS could be further divided into patients with radiologically or clinically isolated symptoms (RIC/CIS; n = 26/1), early RRMS (≤36 months since onset, n = 125/21) and those in the later stages >36 months since disease onset (n = 45/0) or into patients with active (n = 142/15) or inactive (n = 48/7) disease at the time of lumbar puncture. (B) Visualization of multi-level discrimination of neurological diseases by flow cytometric immune profiling between (i) inflammatory autoimmune CNS diseases and other neurological diseases; (ii) RRMS and other inflammatory autoimmune CNS diseases; and (iii) alteration of involved parameters during the disease course.RRMS)
Figure 2
Figure 2
Identification of pan-disease parameters characterizing CNS neuroinflammation. (A) Patients from the discovery cohort under homeostatic conditions (non-inflammatory controls, blue circle, n = 74), neurodegenerative [grey square, n = 93: amyotrophic lateral sclerosis (ALS), mild Alzheimer’s disease (mAD)], neurovascular (red diamond, n = 97) or inflammatory autoimmune CNS disorders [inflammatory, orange triangle, n = 229: Early RRMS including radiologically or clinically isolated syndrome (RIS/CIS), NMOSD, Susac syndrome (SuS) and AIE] were mapped based on immunological data from the peripheral blood and CSF following dimensionality reduction with uniform manifold approximation and prediction (UMAP). (B and C) Heat map (left) illustrating the relative changes and dot plot (right) displaying the fold changes of the nine parameters differentiating CNS neuroinflammation (infl) from non-inflammatory controls (ctrl), neurodegenerative (deg) and neurovascular (vasc) conditions (B) as well as in distinct inflammatory autoimmune diseases of the CNS (early RRMS including RIS/CIS, red triangle, n = 143; NMOSD, yellow triangle, n = 15; Susac syndrome, pink triangle, n = 14; AIE, blue triangle, n = 57) in comparison to control cohorts (C). In the heat maps, red indicates the highest expression, whereas blue indicates the lowest expression. Parameter labelling provides information on the respective compartment (peripheral blood; CSF). The black boxes highlight the commonly altered parameters. (D) Realignment plot illustrating the change in pan neuroinflammatory parameters as a consequence of first line and escalation immune therapies. The median height of each parameter was summed up and averaged as described for volcano plots by division of the result from the subtraction of the control (non-inflammatory control, degenerative, and vascular cohort) median from the respective median by the result of the subtraction of the control median from the median of treatment-naïve patients with RRMS. For CD56dim NK cells for example, controls were at 12.22%, naïve RRMS at 10.55% and escalation therapies at 17.62%, resulting in (17.62%–12.22%)/(10.55%–12.22%) = −3.23, indicating an overcompensation (<0) beyond control levels. Thus, parameters overcompensated by immunotherapy [baseline therapies (green triangle): interferon-β n = 9, glatiramer acetate n = 5 and dimethyl fumarate n = 5; escalation therapies (purple triangle): fingolimod n = 15, natalizumab n = 41 and alemtuzumab (10–14 months post last injection) n = 30 are in the left part of the graph, whereas parameters with partial compensation for neuroinflammatory alterations are in the middle. Parameters exhibiting aggravated levels more different from control cohorts than untreated RRMS patients are represented in the right of the graph. (E) Mean and standard deviation of prediction accuracy (PA), area under the curve (AUC), specificity (SP) and sensitivity (SE) from the top 10 combinations of up to five pan-disease parameters as calculated by logistic regression to differentiate all neuroinflammatory diseases from non-inflammatory controls, neurodegenerative, and neurovascular diseases. (F) Mean and standard deviation of prediction accuracy and AUC for differentiating distinct neuroinflammatory CNS diseases (RRMS, NMOSD, Susac syndrome and AIE) from control cohorts. (G) Predictive score composed by division of parameters consistently increased by parameters decreased in neuroinflammation (top). Receiver operating characteristic (ROC) analysis (left) identified a cut-off of 2.8 distinguishing (right) patients with neuroinflammatory diseases (infl) from non-inflammatory controls (ctrl), neurodegenerative (deg) and neurovascular (vasc) patients with an AUC of 83.5 and odds ratio (OR) of 11.34. This composite score was verified in the validation cohort, resulting in the identification of neuroinflammatory patients with an OR of 15.45. (H) Pan neuroinflammatory auto-immune disease parameters commonly altered in all neuroinflammatory autoimmune diseases of the CNS in comparison with other neurological diseases as well homeostatic conditions.
Figure 3
Figure 3
Inter-autoimmunity classifiers characterizing distinct neuro-inflammatory diseases. (A) Prediction accuracy and AUC of plasma cell occurrence and intrathecal IgG synthesis as determined by logistic regression for differentiating early RRMS, including radiologically or clinically isolated syndrome (RIS/CIS) from NMOSD (yellow triangle), Susac syndrome (SuS, pink triangle) and AIE (blue triangle). (B) Composite score (top left) derived by addition of plasma cell positivity (=1) and intrathecal IgG synthesis (=1) allowing differentiation (top right) of patients with RRMS in the discovery cohort from patients with NMOSD, Susac syndrome and AIE by a cut-off of 1.5 as determined by ROC analysis (top left) with an AUC of 84.0 and an OR of 18.9. Inter-autoimmunity classification was verified in the validation cohort, showing classification with an odds ratio of 35.8 (bottom left). (C) Inter-autoimmunity classifiers distinguishing RRMS from other neuroinflammatory autoimmune diseases.
Figure 4
Figure 4
Factors describing RRMS disease evolution and activity. (A) Heat map (left) illustrating the relative changes and dot plot (right) displaying the fold changes in pan- and inter-autoimmunity classifiers between patients with non-inflammatory diseases as well as patients from the discovery cohort with radiologically or clinically isolated syndrome (RIS/CIS, yellow triangles, n = 26) or RRMS within (early, light red triangles, n = 125) and after 36 months (>36 M, dark red triangles, n = 45) from disease manifestation. On the heat map, red indicates the highest expression, whereas blue indicates the lowest expression. Parameter labelling provides information on the respective compartment (peripheral blood or CSF). (B) Volcano plots representing the median fold change in parameters between patients with RRMS without (inactive, n = 48) and with (active, n = 142) clinical and/or radiological disease activity within 4 weeks before lumbar puncture. P-values were calculated by Mann-Whitney test. Only significantly (P < 0.05) altered parameters are labelled.

Similar articles

Cited by

References

    1. Jarius S, Wildemann B, Paul F.. Neuromyelitis optica: Clinical features, immunopathogenesis and treatment. Clin Exp Immunol. 2014;176(2):149–164. - PMC - PubMed
    1. Gruter T, Ott A, Meyer W, et al.Effects of IVIG treatment on autoantibody testing in neurological patients: Marked reduction in sensitivity but reliable specificity. J Neurol. 2020;267(3):715–720. - PubMed
    1. Ringelstein M, Harmel J, Zimmermann H, et al.; Neuromyelitis Optica Study Group (NEMOS). Longitudinal optic neuritis-unrelated visual evoked potential changes in NMO spectrum disorders. Neurology. 2020;94(4):e407–e418. - PubMed
    1. Dalmau J, Gleichman AJ, Hughes EG, et al.Anti-NMDA-receptor encephalitis: Case series and analysis of the effects of antibodies. Lancet Neurol. 2008;7(12):1091–1098. - PMC - PubMed
    1. Dalmau J, Graus F.. Antibody-mediated encephalitis. N Engl J Med. 2018;378(9):840–851. - PubMed

Publication types