Temporal trends in the quality of deceased donor kidneys and kidney transplant outcomes in Europe: an analysis by the ERA-EDTA Registry
- PMID: 33848355
- PMCID: PMC8719578
- DOI: 10.1093/ndt/gfab156
Temporal trends in the quality of deceased donor kidneys and kidney transplant outcomes in Europe: an analysis by the ERA-EDTA Registry
Abstract
Background: We investigated 10-year trends in deceased donor kidney quality expressed as the kidney donor risk index (KDRI) and subsequent effects on survival outcomes in a European transplant population.
Methods: Time trends in the crude and standardized KDRI between 2005 and 2015 by recipient age, sex, diabetic status and country were examined in 24 177 adult kidney transplant recipients in seven European countries. We determined 5-year patient and graft survival probabilities and the risk of death and graft loss by transplant cohort (Cohort 1: 2005-06, Cohort 2: 2007-08, Cohort 3: 2009-10) and KDRI quintile.
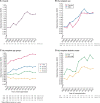
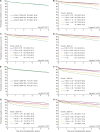
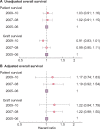
Results: The median crude KDRI increased by 1.3% annually, from 1.31 [interquartile range (IQR) 1.08-1.63] in 2005 to 1.47 (IQR 1.16-1.90) in 2015. This increase, i.e. lower kidney quality, was driven predominantly by increases in donor age, hypertension and donation after circulatory death. With time, the gap between the median standardized KDRI in the youngest (18-44 years) and oldest (>65 years) recipients widened. There was no difference in the median standardized KDRI by recipient sex. The median standardized KDRI was highest in Austria, the Netherlands and the Basque Country (Spain). Within each transplant cohort, the 5-year patient and graft survival probability were higher for the lowest KDRIs. There was no difference in the patient and graft survival outcomes across transplant cohorts, however, over time the survival probabilities for the highest KDRIs improved.
Conclusions: The overall quality of deceased donor kidneys transplanted between 2005 and 2015 has decreased and varies between age groups and countries. Overall patient and graft outcomes remain unchanged.
Keywords: deceased donors; epidemiology; survival outcomes; transplantation.
© The Author(s) 2021. Published by Oxford University Press on behalf of ERA-EDTA.
Figures


References
-
- Eurotransplant. Eurotransplant. Annual Report 2017. 2015. http://www.eurotransplant.org/wp-content/uploads/2019/12/Annual-Report-2... (15 November 2020, date late accessed)
-
- NHS Blood and Transplant. Annual Report on Kidney 2015/16, https://nhsbtdbe.blob.core.windows.net/umbraco-assetscorp/1313/organ_spe... (15 November 2020, date last accessed)
-
- Johnson RJ, Bradbury LL, Martin K et al. . Organ donation and transplantation in the UK—the last decade: a report from the UK national transplant registry. Transplantation 2014; 97(Suppl 1): S1–S27 - PubMed
Publication types
MeSH terms
Substances
LinkOut - more resources
Full Text Sources
Other Literature Sources
Medical
Miscellaneous

