. 2021 May 20;81(10):2216-2230.e10.
doi: 10.1016/j.molcel.2021.03.032. Epub 2021 Apr 12.

Impact of chromatin context on Cas9-induced DNA double-strand break repair pathway balance

Affiliations

Impact of chromatin context on Cas9-induced DNA double-strand break repair pathway balance

Ruben Schep et al. Mol Cell. .

Abstract

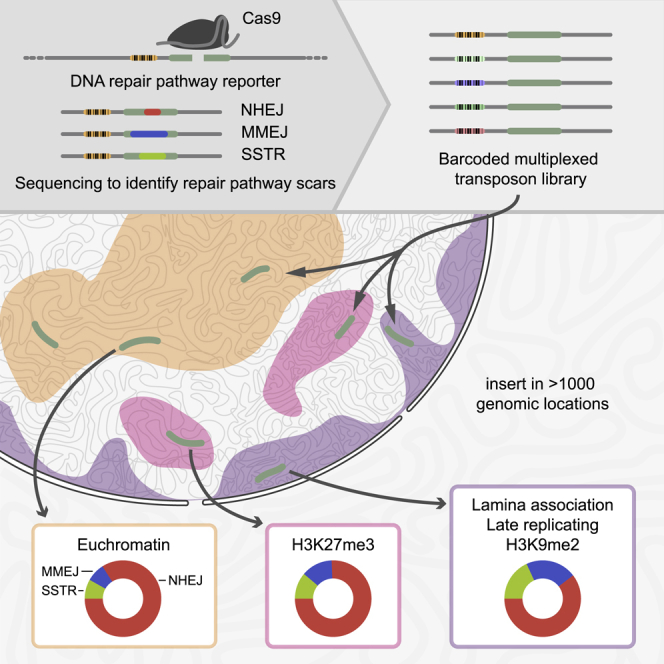
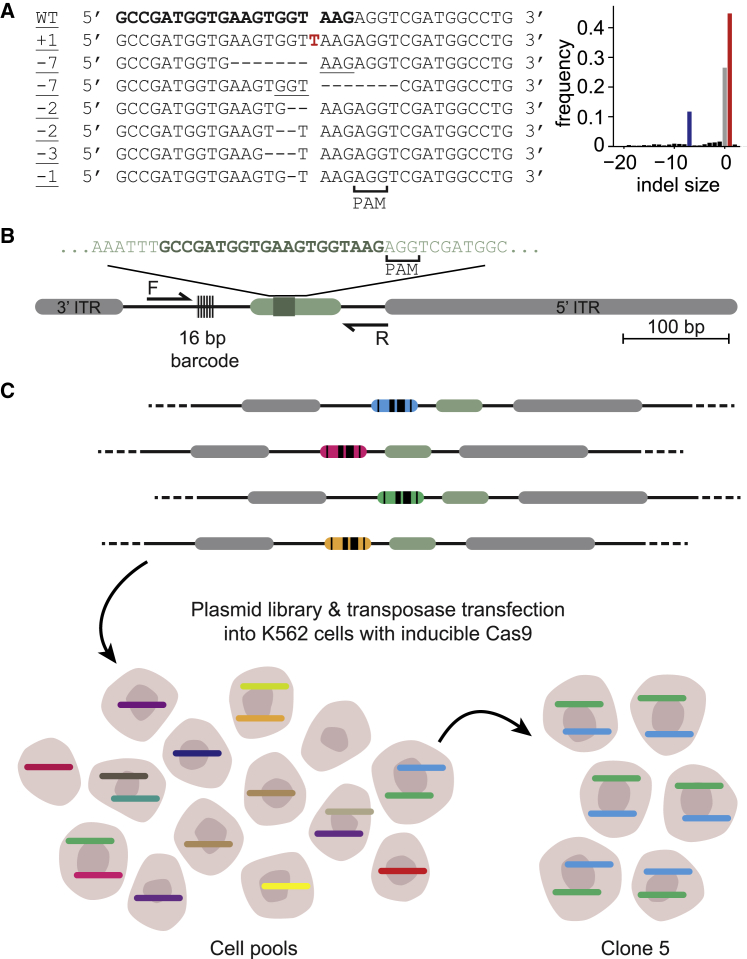
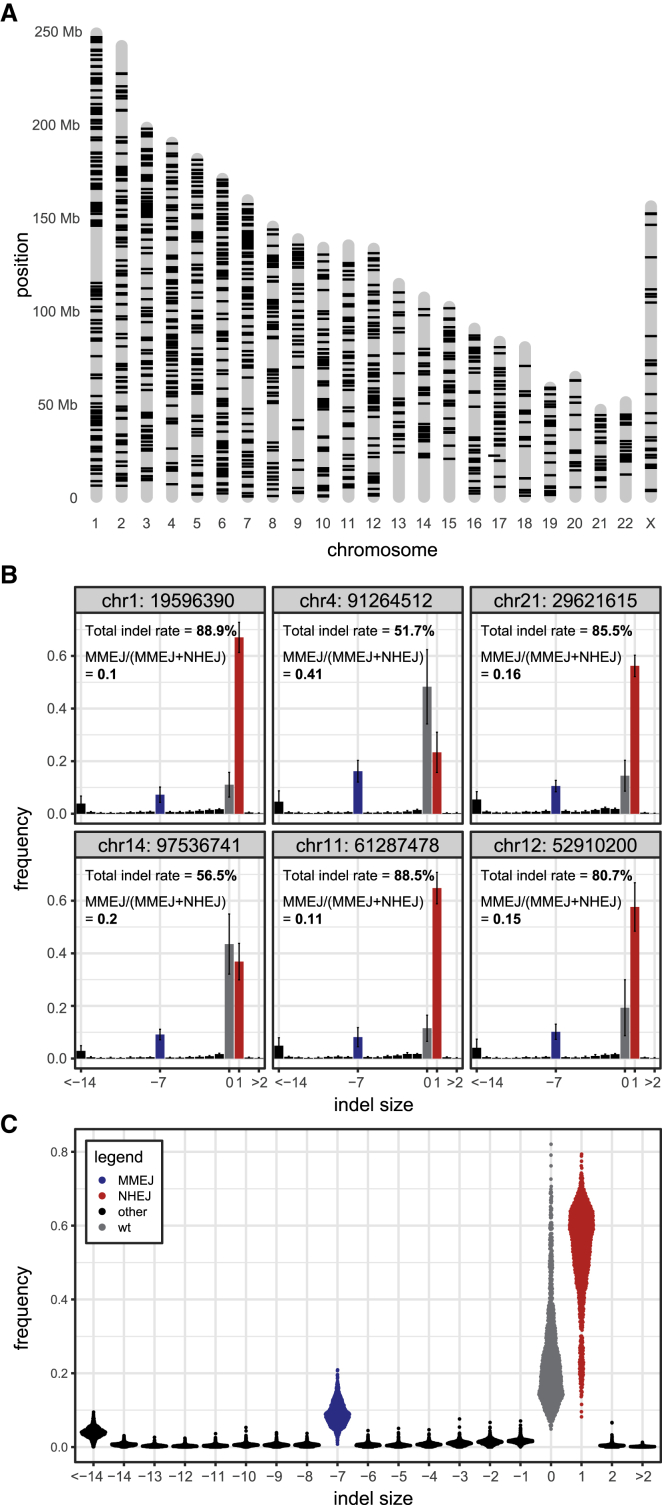
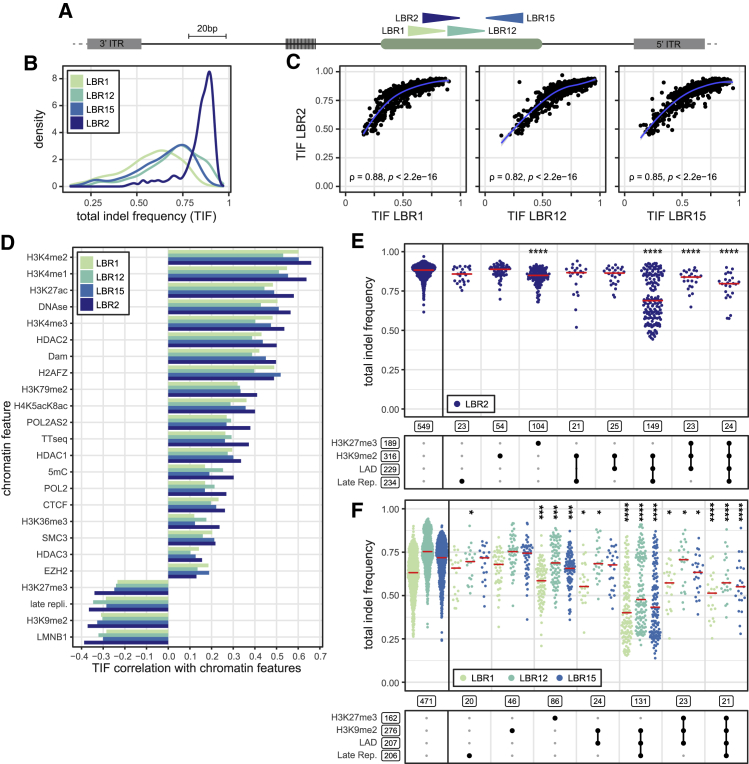
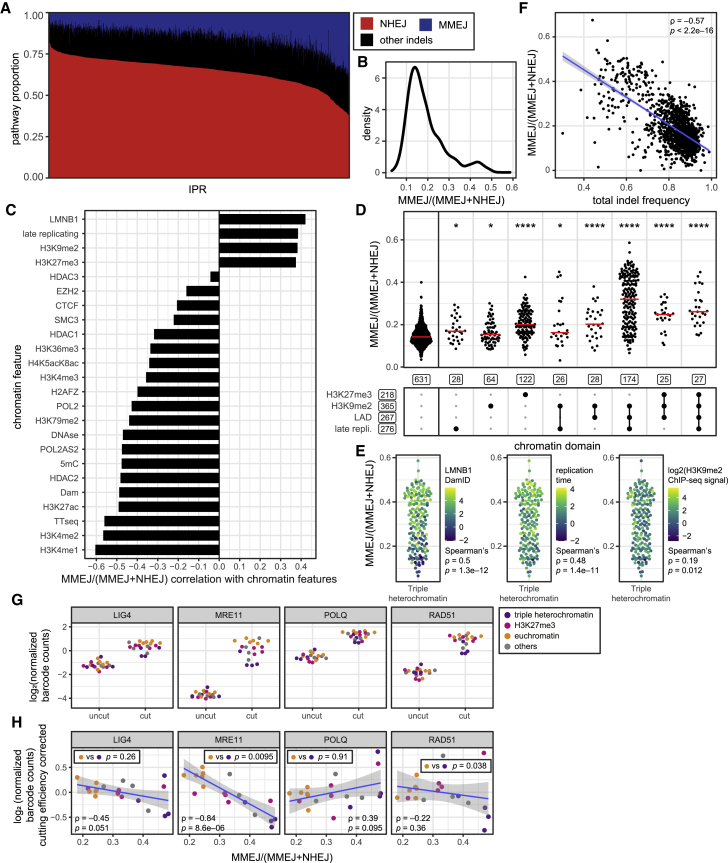
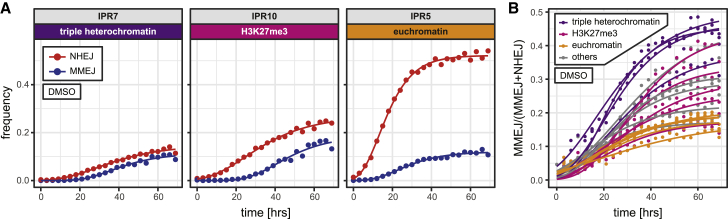
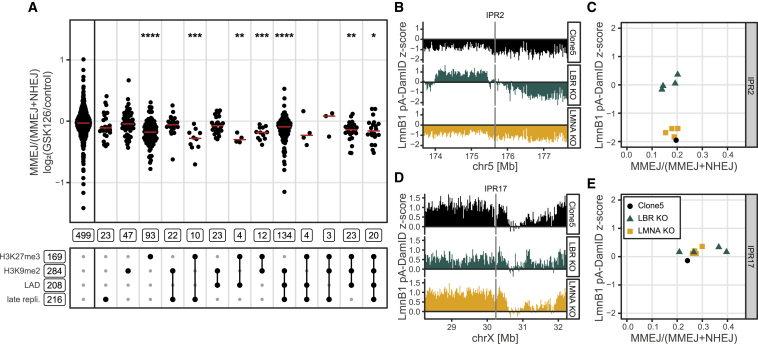
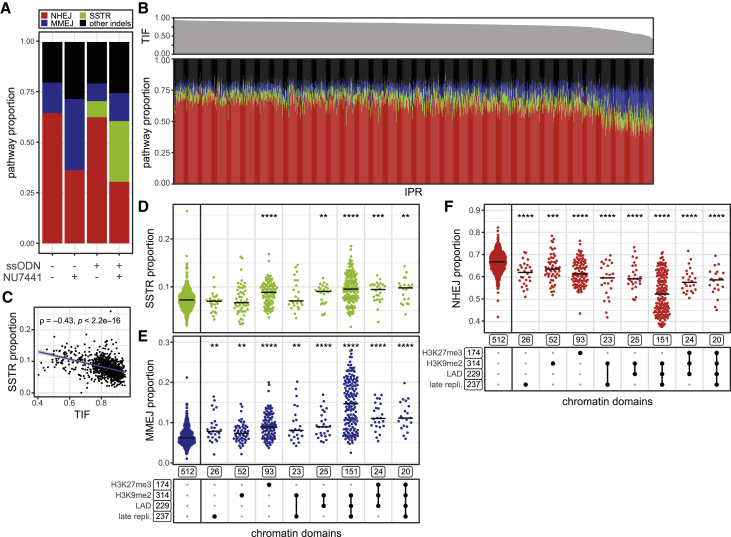
DNA double-strand break (DSB) repair is mediated by multiple pathways. It is thought that the local chromatin context affects the pathway choice, but the underlying principles are poorly understood. Using a multiplexed reporter assay in combination with Cas9 cutting, we systematically measure the relative activities of three DSB repair pathways as a function of chromatin context in >1,000 genomic locations. This reveals that non-homologous end-joining (NHEJ) is broadly biased toward euchromatin, while the contribution of microhomology-mediated end-joining (MMEJ) is higher in specific heterochromatin contexts. In H3K27me3-marked heterochromatin, inhibition of the H3K27 methyltransferase EZH2 reverts the balance toward NHEJ. Single-stranded template repair (SSTR), often used for precise CRISPR editing, competes with MMEJ and is moderately linked to chromatin context. These results provide insight into the impact of chromatin on DSB repair pathway balance and guidance for the design of Cas9-mediated genome editing experiments.

Keywords: CRISPR; Chromatin; DNA repair; MMEJ; NHEJ; SSTR; double strand break; heterochromatin; nuclear lamina; reporter assay.


Conflict of interest statement

Declaration of interests B.v.S. is a member of the Advisory Board of Molecular Cell.

Figures

None
Graphical abstract
Figure 1
Figure 1
Principle of multiplexed DSB repair pathway reporter assay (A) Left panel: sequences of the most common insertions and deletions produced after break and repair induced with sgRNA LBR2. Inserted nucleotide in red, microhomologies are underlined. Right panel: indel frequency distribution after cutting the LBR gene. Negative indel sizes refer to deletions, positive sizes refer to insertions. The +1 and −7 indels are marked in red and blue, respectively. (B) Schematic of the TRIP construct. ITR, inverted terminal repeat of PiggyBac transposable element; the LBR gene-derived sequence is shown in light green, with the sgRNA target sequence in dark green. PCR primers are indicated by the arrows (F and R). (C) Schematic of the TRIP experimental setup. See main text.
Figure 2
Figure 2
Multiplexed detection of DSB repair pathway use (A) Genomic integration coordinates of 1,229 uniquely mapped IPRs (both cell pools combined) that passed filtering as described in STAR Methods and are used in this work. (B) Indel frequency distributions of six randomly selected IPRs, 64 h after Cas9 induction. Data are average of six independent replicates. Error bars are ±SD. Gray, wild-type sequence; red, +1 insertion, diagnostic of NHEJ; blue, −7 deletion, diagnostic of MMEJ; black, other indels. (C) Indel frequencies of all IPRs shown in (A), 64 h after Cas9 induction. Data are average of two to six independent replicates. See also Figures S1 and S2.
Figure 3
Figure 3
IPR total indel frequency varies as a function of chromatin context (A) Schematic of the IPR with four different gRNA target sites indicated by arrowheads, oriented toward the PAM. (B) Total indel frequency distributions of IPRs after cutting with each sgRNA, shown as density plots, which can be interpreted as smoothed histograms. For each sgRNA, IPRs were included only if they yielded reliable data in at least two independent experiments (LBR2: 1,010 IPRs [n = 2–8]; LBR1: 956 IPRs [n = 2]; LBR12: 942 IPRs [n = 2]; LBR15: 932 IPRs [n = 2]). Indel frequencies were not corrected for transfection efficiency, which we infer to be close to 100% because some IPRs have indel frequencies near 100%. (C) Scatterplots of total indel frequencies obtained with LBR2 versus the three other sgRNAs. ρ is Spearman’s rank correlation coefficient. (D) Spearman’s correlations between total indel frequencies in IPRs and the local intensities of 24 chromatin features at the IPR integration sites, for each sgRNA. p < 0.01 for all correlations. Chromatin features are ordered by the LBR2 correlation coefficients. (E) Total indel frequency at each IPR obtained with LBR2 sgRNA, split into different combinations of heterochromatin features present, as indicated by black dots in the scheme below the graph. Red lines show median values. Boxed numbers indicate the number of IPRs in each group; only groups with >20 IPRs are shown. Asterisks mark p values according to Wilcoxon test, compared with euchromatin IPRs (leftmost column): p < 0.05, ∗∗p < 0.01, ∗∗∗p < 0.001, and ∗∗∗∗p < 0.0001. (F) Same as (E) but for the other three sgRNAs. See also Figure S3.
Figure 4
Figure 4
Chromatin context effects on MMEJ:NHEJ balance and protein binding (A) Variation in indel composition across IPRs. Red, +1 (NHEJ); blue, −7 (MMEJ); black, other indels (unknown pathway). IPRs are ordered by +1 insertion frequency (1,171 IPRs, two to eight independent experiments). (B) MMEJ:NHEJ balance distribution across all IPRs. (C) Spearman’s correlation coefficients of MMEJ:NHEJ balance versus the local intensities of 24 chromatin features. p < 0.001 for all correlations. (D) MMEJ:NHEJ balance per IPR, split into different combinations of heterochromatin features similar to Figure 3E; see Figure S4D for all groups. Asterisks mark p values according to the Wilcoxon test, compared with euchromatin IPRs (leftmost column): p < 0.05, ∗∗p < 0.01, ∗∗∗p < 0.001, and ∗∗∗∗p < 0.0001. (E) MMEJ:NHEJ balance of IPRs in triple heterochromatin, colored by levels of H3K9me2, LMNB1, or replication timing. (F) Correlation between total indel frequency and MMEJ:NHEJ balance across all IPRs. (G) Barcode counts (normalized log2 values) of IPRs in clone 5 after ChIP of indicated proteins, 16 h after Cas9 induction with (cut) or without (uncut) sgRNA LBR2. (H) Same ChIP data as (G) under cut conditions, but now corrected for estimated cutting efficiencies at t = 72 h and plotted against MMEJ:NHEJ balance. Bottom p values refer to the Pearson’s correlation with MMEJ:NHEJ balance; top p values refer to the difference between IPRs in euchromatin and triple heterochromatin (Wilcoxon test); blue line and gray shading show linear regression fit with 95% confidence interval. Triple heterochromatin is the combination of H3K9me2, lamina association, and late replication; euchromatin is here defined as the absence of any heterochromatin features. See also Figure S4.
Figure 5
Figure 5
Accumulation of indels over time (A) Time curves of the +1 insertion (red) and −7 deletion (blue) in single IPRs located in three different types of chromatin. See Figure S5 for plots of all 19 IPRs in clone 5. Dots are measured values; lines are fitted sigmoid curves. (B) Shifting MMEJ:NHEJ balance over time in 19 IPRs of clone 5, colored by chromatin type. Data in (A) and (B) are averages of two independent experiments. See also Figure S5.
Figure 6
Figure 6
Effects of heterochromatin perturbations on pathway balance (A) Log2 fold change of MMEJ:NHEJ balance in GSK126 treated cells compared with control cells, for 917 IPRs divided by heterochromatin type. Data are average of two independent biological replicates. Wilcoxon test compared with euchromatin IPRs (leftmost column): p < 0.05, ∗∗p < 0.01, ∗∗∗p < 0.001, and ∗∗∗∗p < 0.0001. (B and D) Nuclear lamina interaction tracks around IPR2 (B) and IPR17 (D). The tracks for the KO clones are the average of four separate clones (individual tracks are shown in Figures S7K and S7L). All data are average of two independent biological replicates. (C and E) Comparison of MMEJ:NHEJ balance (n = 3) and average lamina interaction score in a 20 kb window centered on the IPR (n = 2), for IPR2 (C) and IPR17 (E). See also Figure S6.
Figure 7
Figure 7
Balance between NHEJ, MMEJ, and SSTR in euchromatin and heterochromatin (A) Average pathway contribution across all IPRs in the cell pools, in the absence or presence of an ssODN donor, and with or without NU7441 treatment (DMSO: 1,219 IPRs [n = 2–8, same data as in Figures 3 and 4]; DMSO + ssODN: 1,032 IPRs [n = 2 or 3]; NU7441: 1,186 IPRs [n = 2–4, same data as in Figures S2A and S2B]; NU7441 + ssODN: 1,047 IPRs [n = 2 or 3]). Red, +1 insertion (NHEJ); blue, −7 deletion (MMEJ); green, +2 insertion due to SSTR; black, other indels. (B) Pathway contributions in all individual IPRs in the presence of ssODN donor but without NU7441 (bottom panel), sorted by overall indel frequency (top panel). (C) Correlation between total indel frequency and SSTR proportion across all IPRs. Blue line and gray shading show linear regression fit with 95% confidence interval. ρ is Pearson’s rank correlation coefficient. (D–F) Proportions of total indels generated by SSTR (D), MMEJ (E), and NHEJ (F) in the presence of the ssODN donor, split according to heterochromatin features as indicated in the bottom panel, similar to Figure 3E. Asterisks mark p values according to the Wilcoxon test, compared with euchromatin IPRs (most left column): p < 0.05, ∗∗p < 0.01, ∗∗∗p < 0.001, and ∗∗∗∗p < 0.0001. See also Figure S7.

Comment in

References

    1. Akhtar W., de Jong J., Pindyurin A.V., Pagie L., Meuleman W., de Ridder J., Berns A., Wessels L.F., van Lohuizen M., van Steensel B. Chromatin position effects assayed by thousands of reporters integrated in parallel. Cell. 2013;154:914–927. - PubMed
    1. Akhtar W., Pindyurin A.V., de Jong J., Pagie L., Ten Hoeve J., Berns A., Wessels L.F., van Steensel B., van Lohuizen M. Using TRIP for genome-wide position effect analysis in cultured cells. Nat. Protoc. 2014;9:1255–1281. - PubMed
    1. Alagoz M., Katsuki Y., Ogiwara H., Ogi T., Shibata A., Kakarougkas A., Jeggo P. SETDB1, HP1 and SUV39 promote repositioning of 53BP1 to extend resection during homologous recombination in G2 cells. Nucleic Acids Res. 2015;43:7931–7944. - PMC - PubMed
    1. Aho A.V., Kernighan B.W., Weinberger P.J. The awk programming language. Comput. Hum. 1992;26:293–297.
    1. Allen F., Crepaldi L., Alsinet C., Strong A.J., Kleshchevnikov V., De Angeli P., Palenikova P., Khodak A., Kiselev V., Kosicki M. Predicting the mutations generated by repair of Cas9-induced double-strand breaks. Nat. Biotechnol. 2018 doi: 10.1038/nbt.4317. Published online November 27, 2018. - DOI - PMC - PubMed

Publication types