. 2021 May 13;184(10):2649-2664.e18.
doi: 10.1016/j.cell.2021.03.031. Epub 2021 Apr 12.

Kinase-mediated RAS signaling via membraneless cytoplasmic protein granules

Affiliations

Kinase-mediated RAS signaling via membraneless cytoplasmic protein granules

Asmin Tulpule et al. Cell. .

Abstract

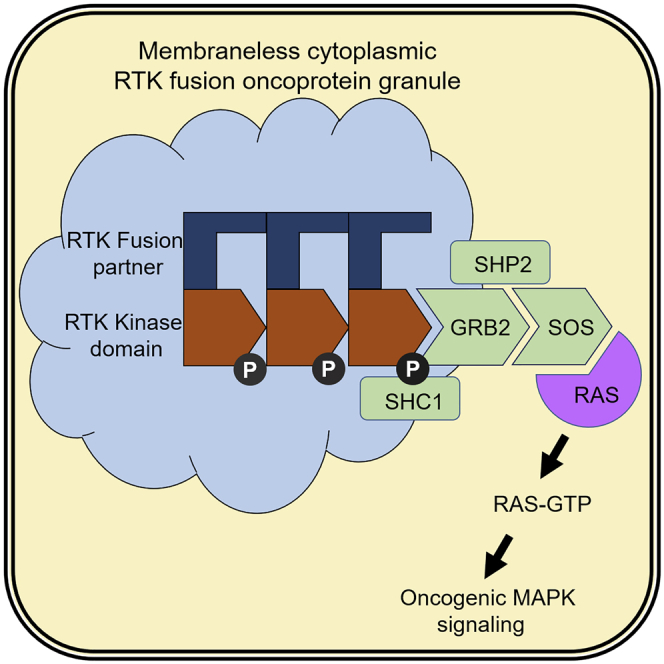
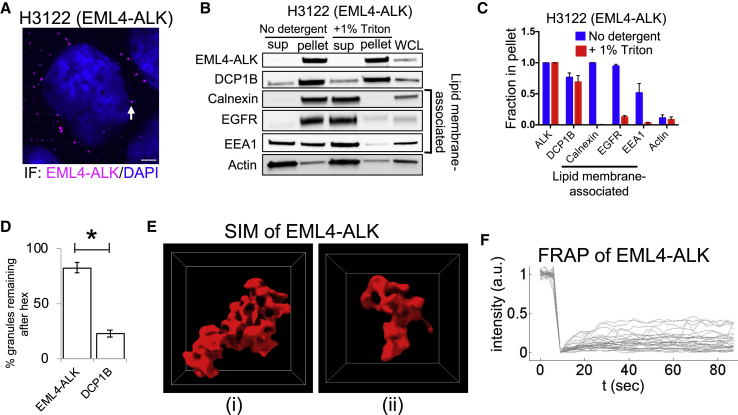
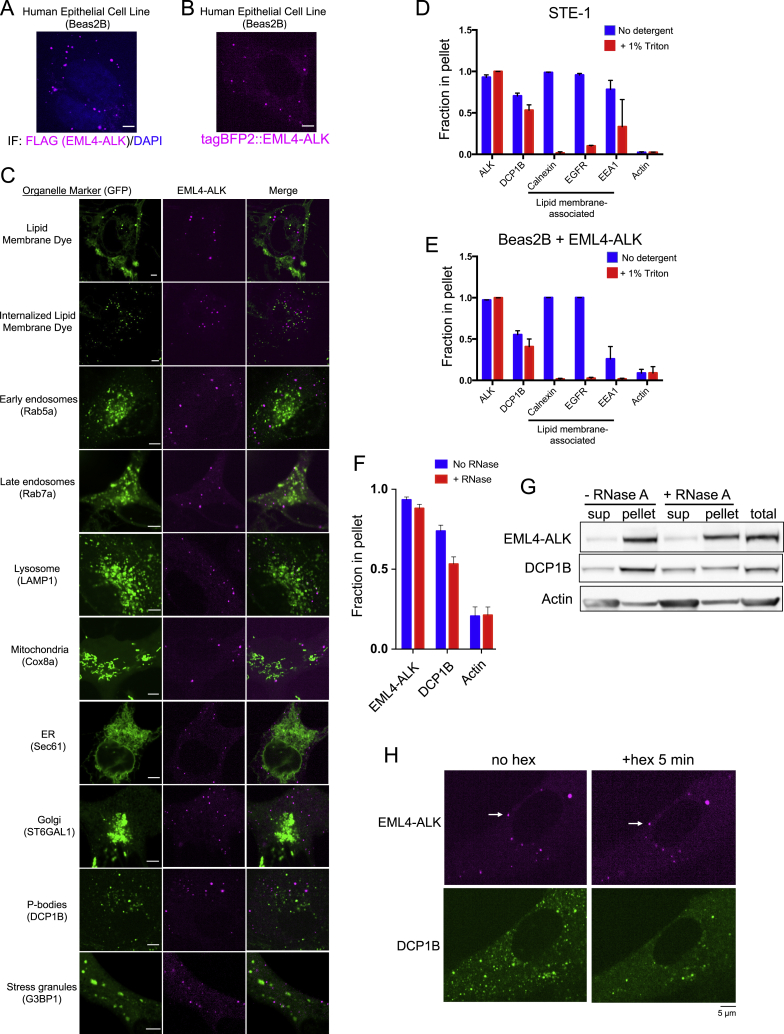
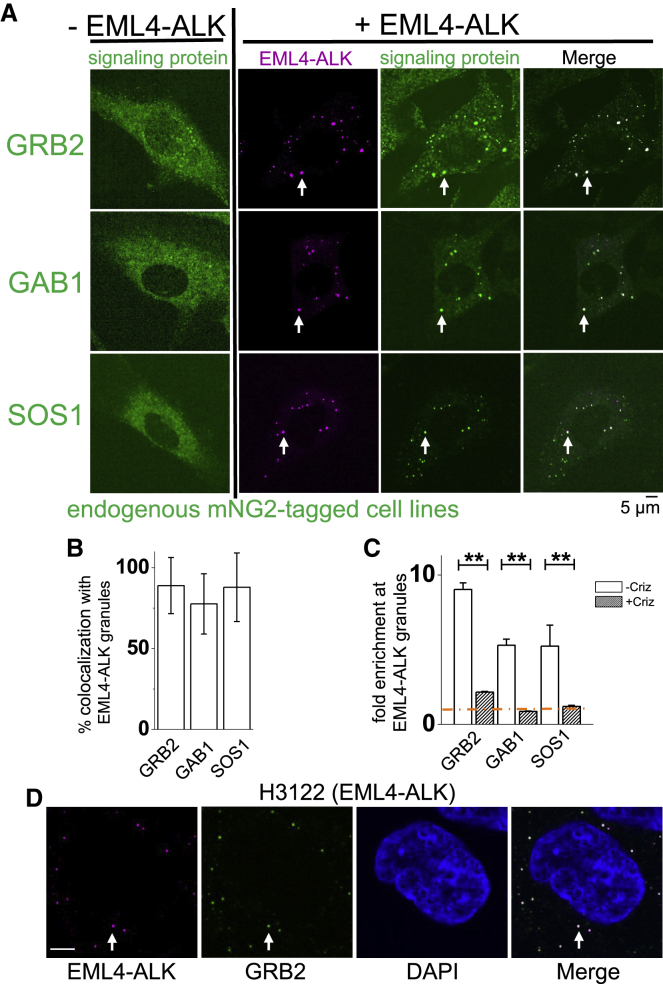
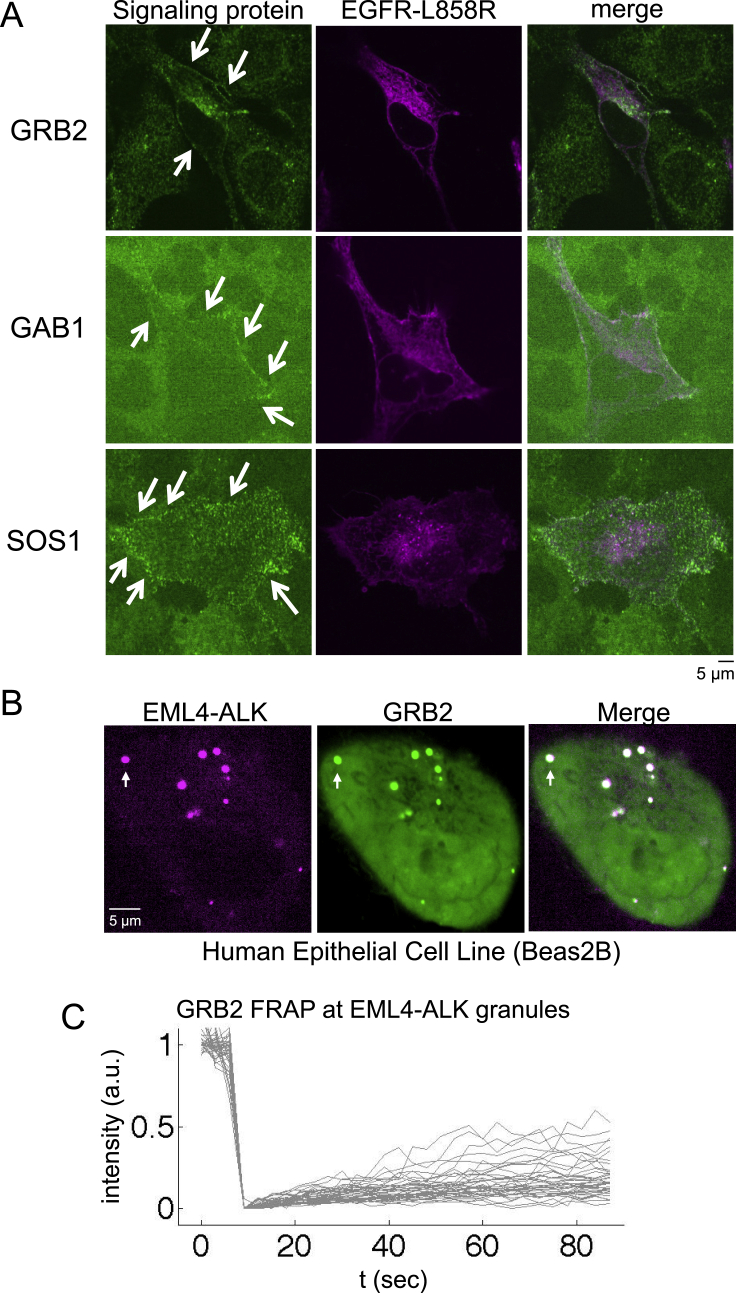
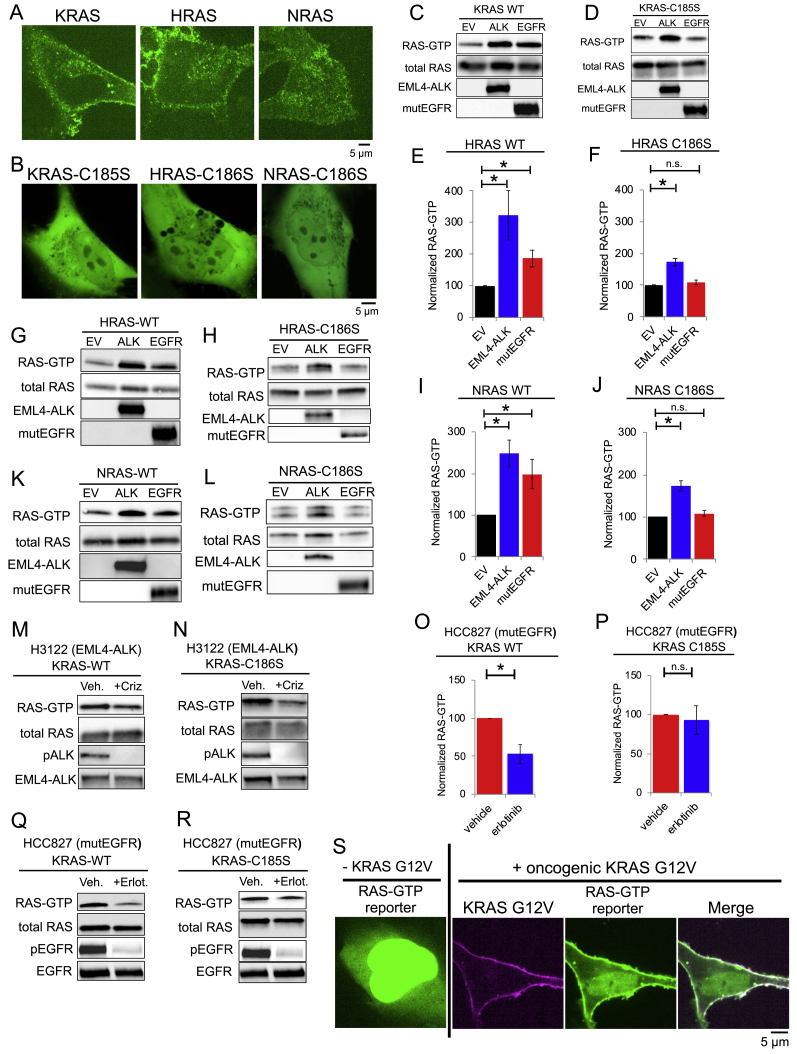
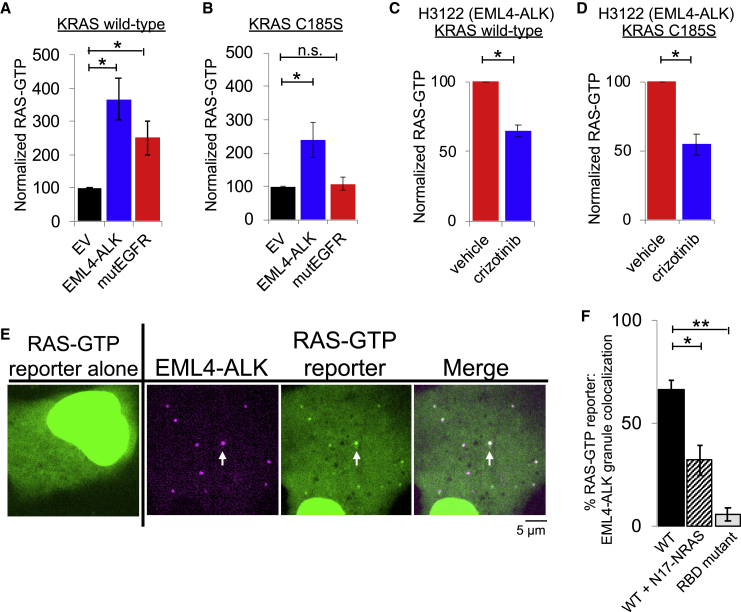
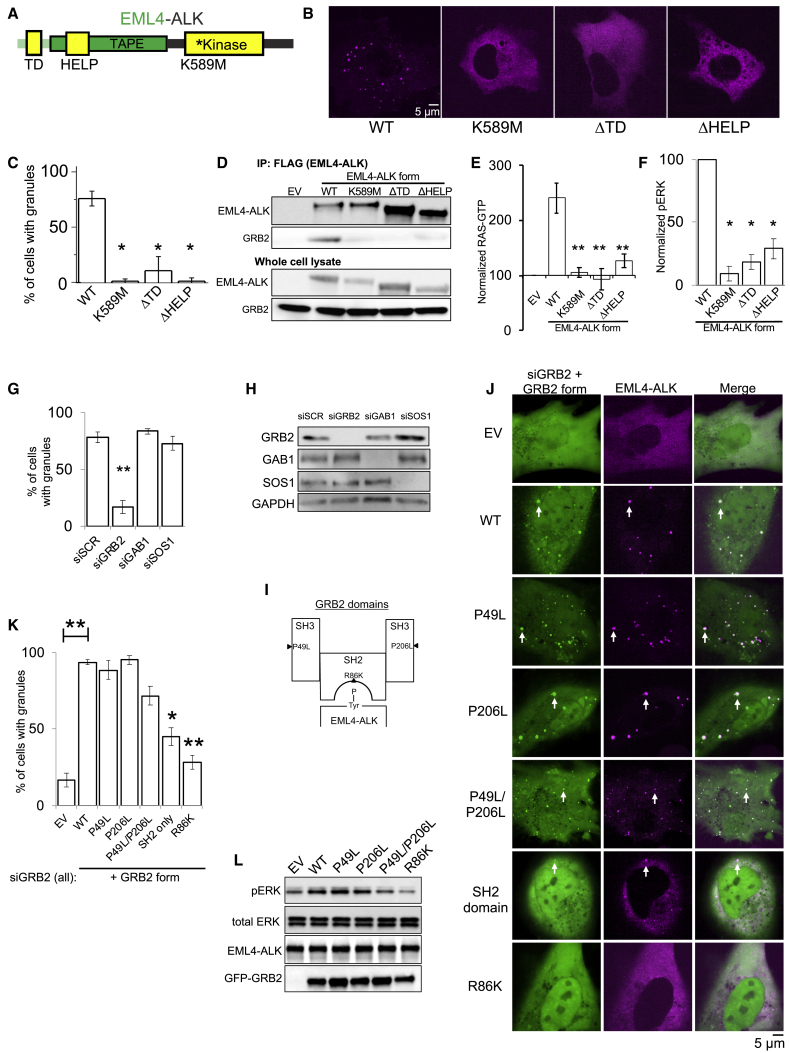
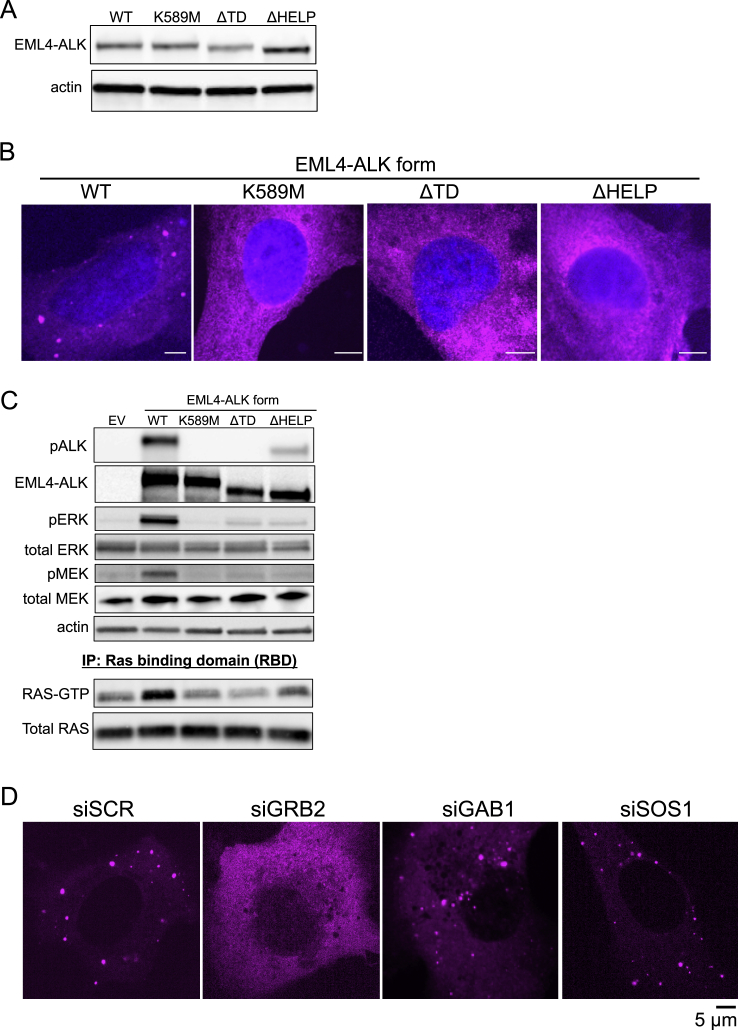
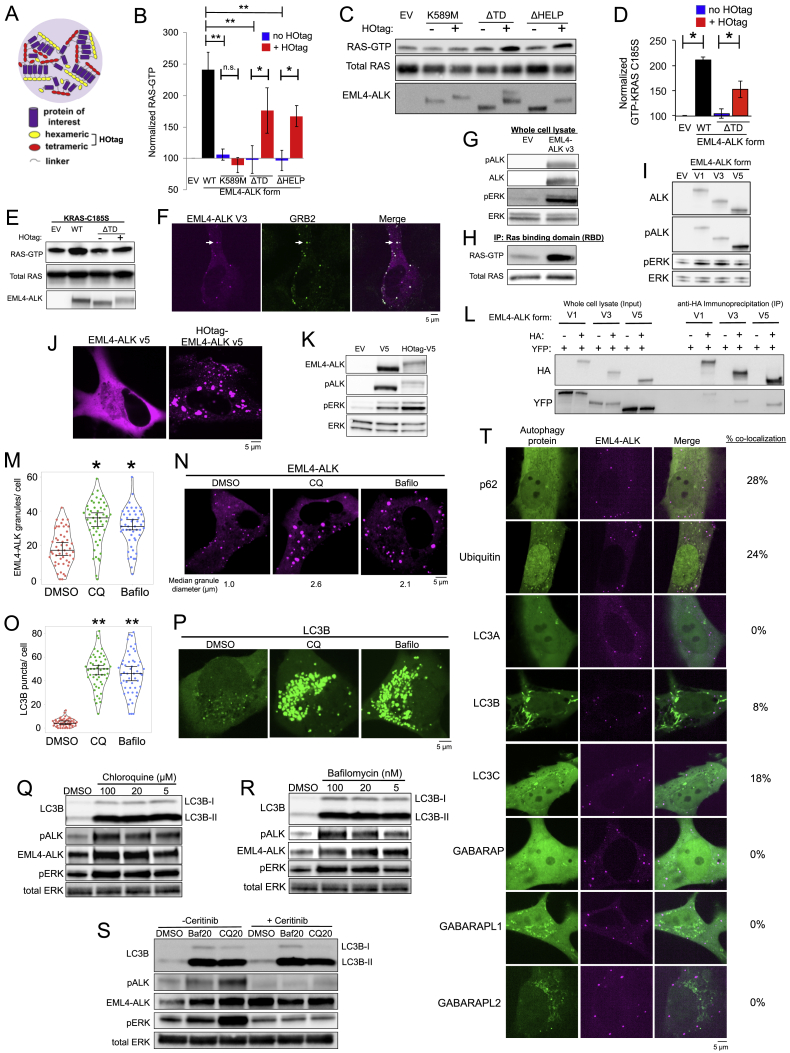
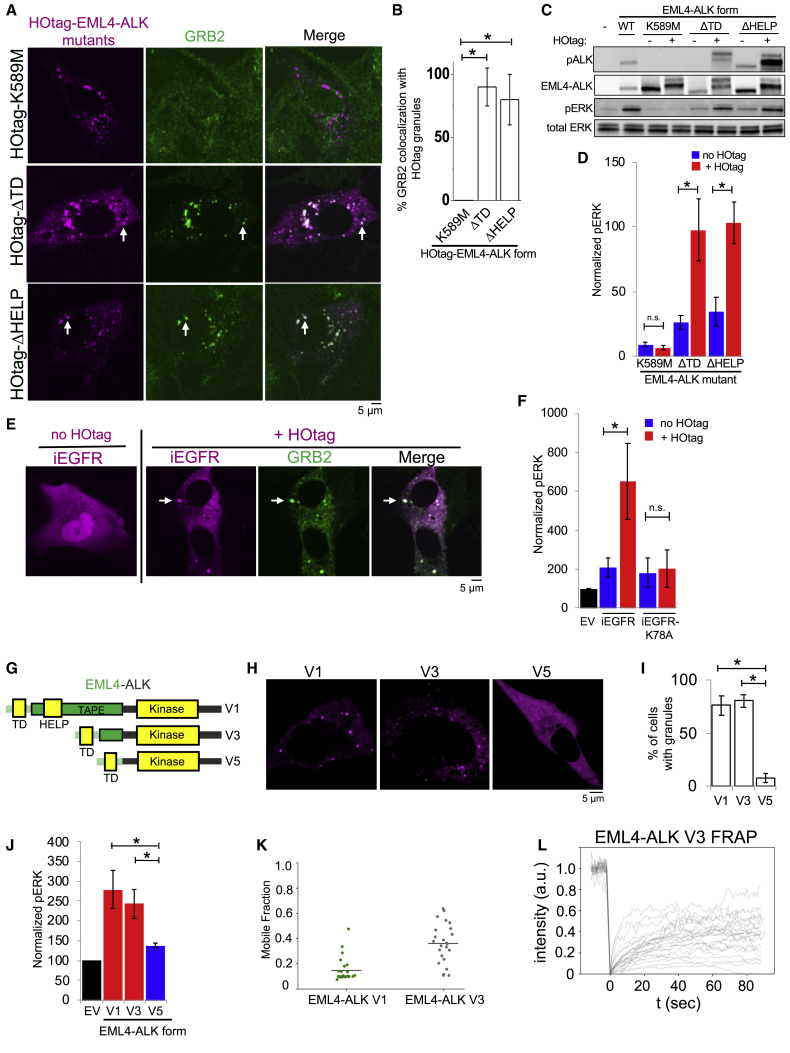
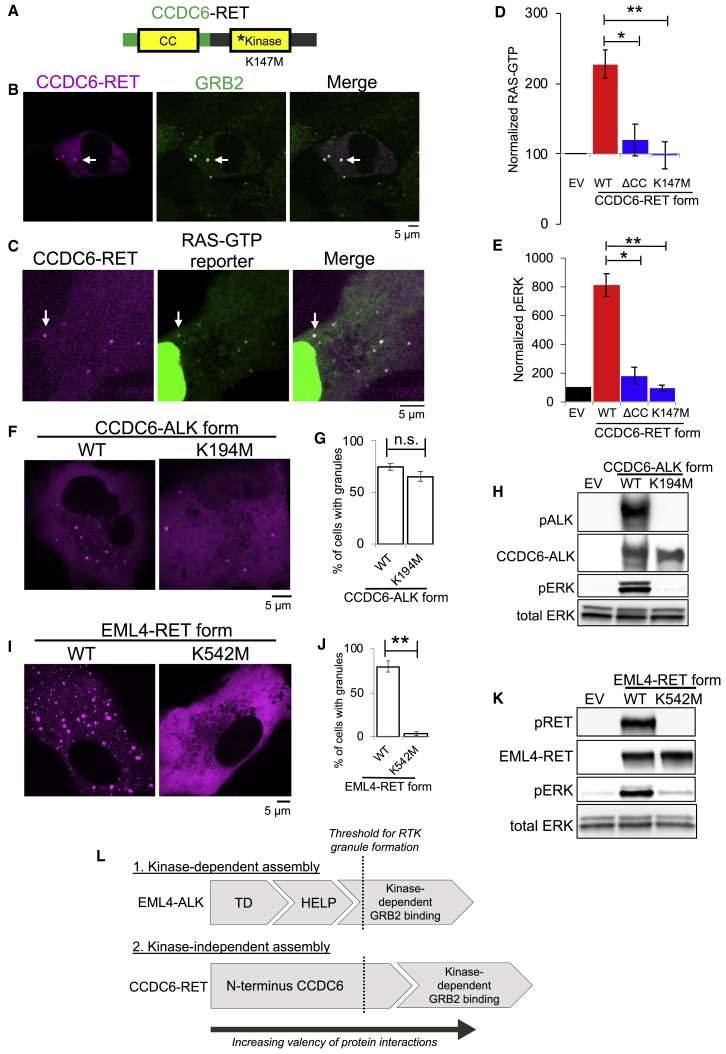
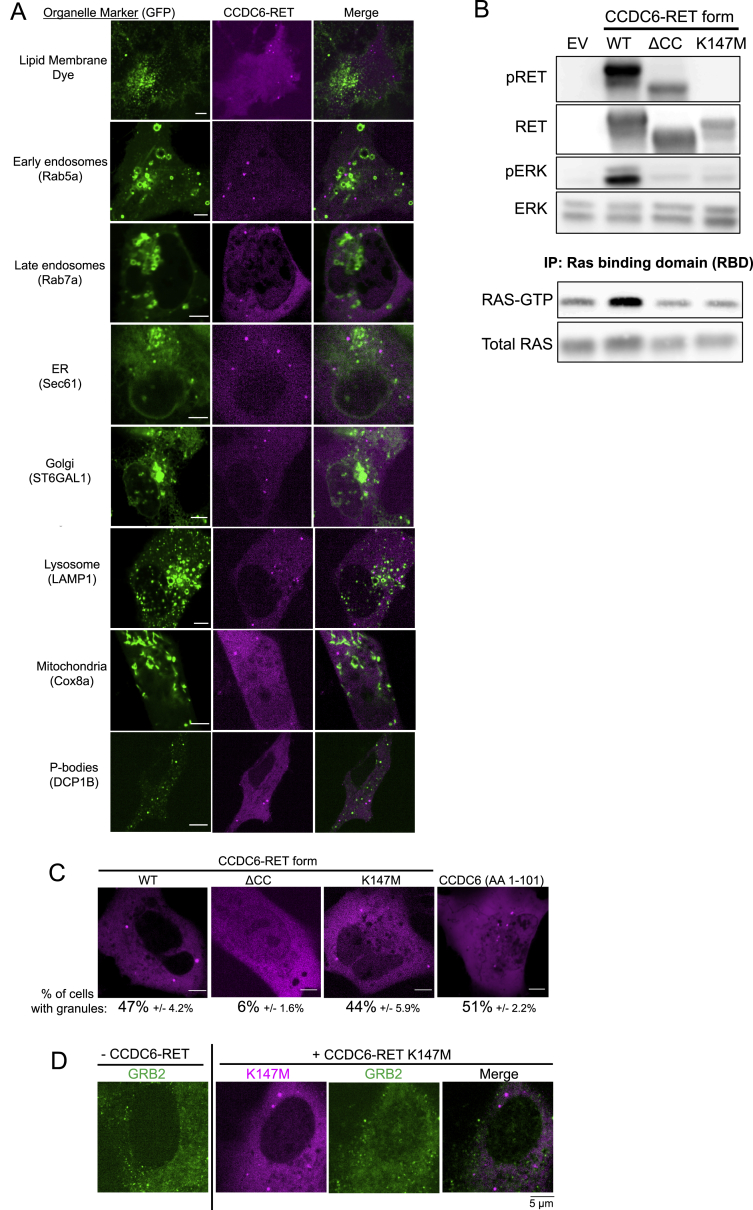
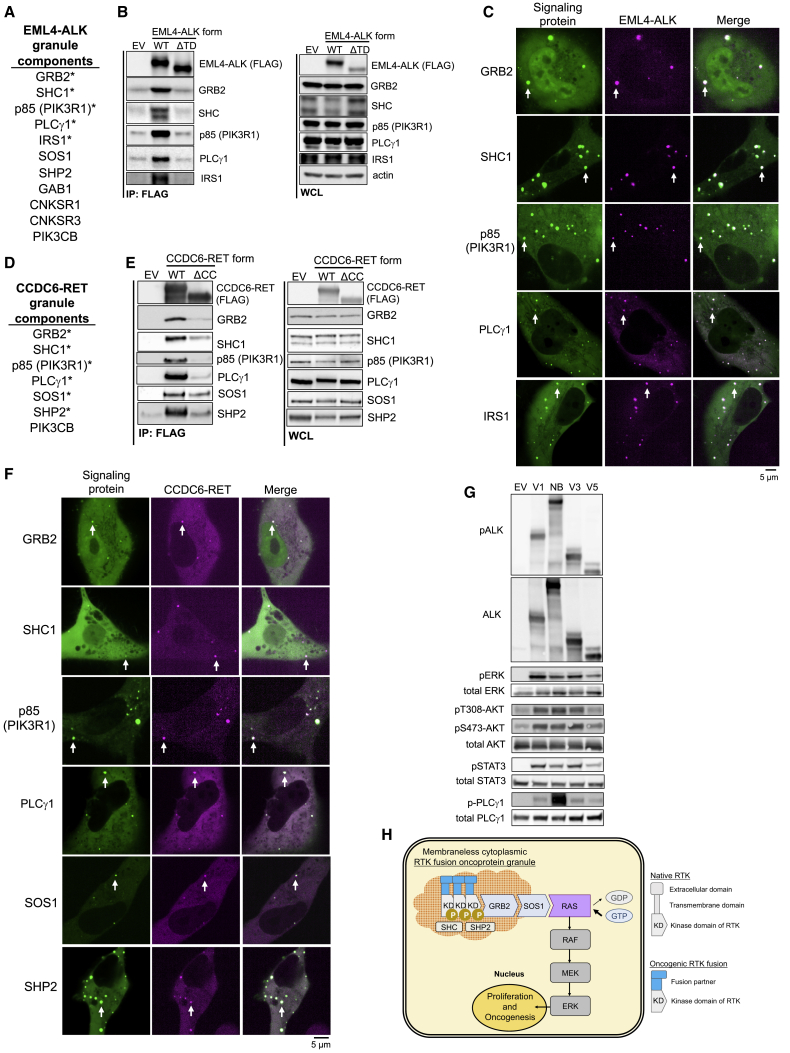
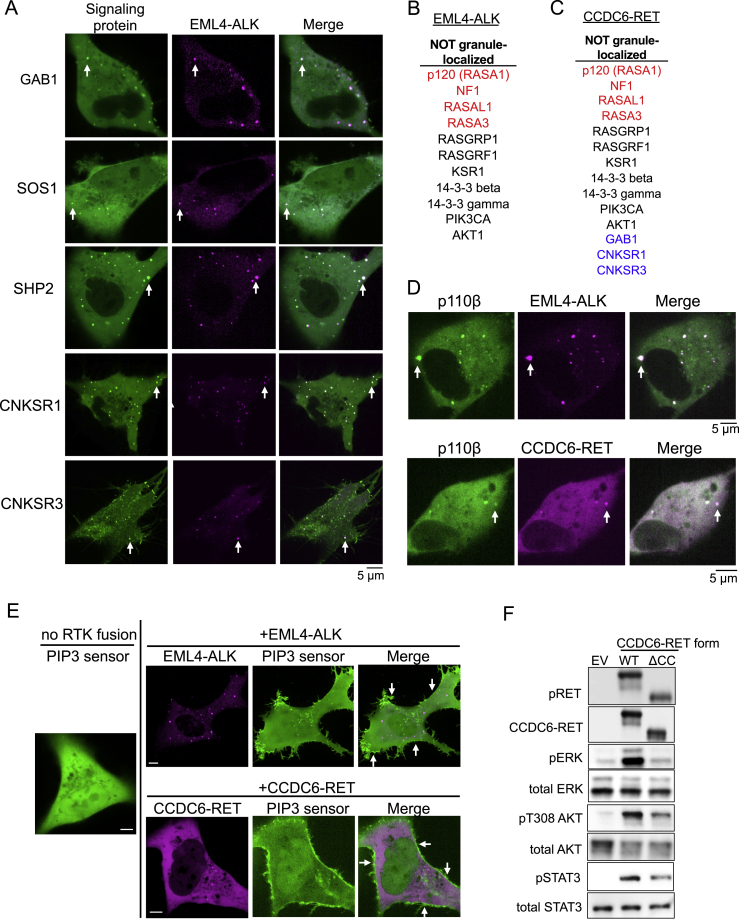
Receptor tyrosine kinase (RTK)-mediated activation of downstream effector pathways such as the RAS GTPase/MAP kinase (MAPK) signaling cascade is thought to occur exclusively from lipid membrane compartments in mammalian cells. Here, we uncover a membraneless, protein granule-based subcellular structure that can organize RTK/RAS/MAPK signaling in cancer. Chimeric (fusion) oncoproteins involving certain RTKs including ALK and RET undergo de novo higher-order assembly into membraneless cytoplasmic protein granules that actively signal. These pathogenic biomolecular condensates locally concentrate the RAS activating complex GRB2/SOS1 and activate RAS in a lipid membrane-independent manner. RTK protein granule formation is critical for oncogenic RAS/MAPK signaling output in these cells. We identify a set of protein granule components and establish structural rules that define the formation of membraneless protein granules by RTK oncoproteins. Our findings reveal membraneless, higher-order cytoplasmic protein assembly as a distinct subcellular platform for organizing oncogenic RTK and RAS signaling.

Keywords: ALK; MAPK; RAS; RET; anaplastic lymphoma kinase; biomolecular condensate; gene fusion; kinase; protein granule; receptor tyrosine kinase.


Conflict of interest statement

Declarations of interest T.G.B. is an advisor to Array Biopharma/Pfizer, Revolution Medicines, Relay Therapeutics, Rain Therapeutics, Novartis, AstraZeneca, Takeda, Springworks, and Jazz Pharmaceuticals and receives research funding from Novartis, Revolution Medicines, and Strategia.

Figures

None
Graphical abstract
Figure 1
Figure 1
EML4-ALK forms de novo membraneless cytoplasmic protein granules (A) Anti-ALK IF in H3122 cells representative of 20+ cells, n = 3. Arrow indicates a representative EML4-ALK puncta. Scale bar, 5 μm. (B and C) Subcellular fractionation ±1% Triton X-100 in H3122 cells, followed by western blotting (B). EML4-ALK and DCP1B are statistically distinct (p < 0.05, one-way ANOVA with post hoc Tukey’s HSD test) from the lipid membrane-associated proteins, which shift from the insoluble fraction (pellet) to the supernatant (sup) with detergent. n = 3. (D) EML4-ALK or DCP1B granule persistence after 5 min of 5% hexanediol (hex) treatment. Error bars represent ±SEM, p value < 0.05 by unpaired t test. (E) SIM images of 2 distinct YFP::EML4-ALK puncta in Beas2B cells. SIM box: 2 μm3. (F) FRAP analysis of YFP::EML4-ALK puncta in Beas2B cells. N = 30 cells. See also Figure S1 and Video S1.
Figure S1
Figure S1
Cell biological and biophysical properties of EML4-ALK membraneless cytoplasmic protein granules, related to Figure 1 (A) Anti-FLAG immunofluorescence of FLAG-tagged EML4-ALK expressed in human epithelial cell line Beas2B. DAPI serves as a nuclear stain. Image is representative of at least 75 analyzed cells in total over 3 independent experiments. Scale bar = 5 μM. (B) Live-cell confocal imaging of human epithelial cell line Beas2B upon expression of mTagBFP2::EML4-ALK. Image is representative of 200 analyzed cells in total over 5 independent experiments. Scale bar = 5 μM. (C) Live-cell confocal imaging of human epithelial cell line Beas2B upon expression of mTagBFP2::EML4-ALK and mEGFP-tagged organelle markers as listed. Membrane dye experiments were conducted using live cells incubated with CellTracker CM-DiI Dye (Invitrogen). Each panel is a representative image of at least 20 analyzed cells per condition in 3 independent experiments. Scale bar = 5 μM. (D, E) Subcellular fractionation by ultracentrifugation ± detergent (1% Triton X-100) to disrupt lipid membranes in STE-1 (D), an EML4-ALK expressing cancer cell line, and Beas2B cells expressing EML4-ALK (E). In both cell lines, EML4-ALK and DCP1B are statistically distinct from the lipid membrane-associated proteins, which shift from the insoluble fraction (pellet) to the soluble fraction with detergent (p < 0.05 for all comparisons by one-way ANOVA with post hoc Tukey’s HSD test, except for DCP1B versus EEA1 in panel D and E and ALK versus EEA1 in panel E). Bar graphs reflect quantification of western blotting results for 3 independent replicates. Fraction in pellet calculated as ratio of the insoluble fraction to total (insoluble plus supernatant fractions) as assessed by western blotting. Error bars represent ± SEM. (F, G) Subcellular fractionation by ultracentrifugation ± RNase A treatment for 30 minutes in EML4-ALK expressing cancer cell line H3122. P-body protein DCP1B partially shifts from the insoluble (pellet) fraction to the supernatant (sup) upon RNase A treatment, in contrast to EML4-ALK. Western blotting images are representative of at least 5 independent experiments. Fraction in pellet (G) calculated as ratio of the insoluble fraction to total (insoluble plus supernatant fractions) as assessed by western blotting (F). DCP1B demonstrates a significant RNase-dependent reduction in the insoluble fraction (p < 0.05 by paired t test) compared to EML4-ALK. (H) Live-cell imaging of human epithelial cell line Beas2B co-expressing mTagBFP2::EML4-ALK and eGFP::DCP1B treated with 5% hexanediol (hex) and imaged at respective time points. Images are representative of at least 5 analyzed cells in 3 independent experiments. White arrows indicate a representative EML4-ALK cytoplasmic protein granule (multiple non-highlighted granules are also pictured in all panels). Quantification of granule persistence shown in Main Figure 1D.
Figure 2
Figure 2
EML4-ALK membraneless cytoplasmic protein granules recruit RAS-activating complex GRB2/SOS1/GAB1 in situ (A) Live-cell imaging of Beas2B cells with endogenous mNG2-tagging of signaling proteins ± mTagBFP2::EML4-ALK. (B) Signaling protein colocalization with EML4-ALK granules. 100 total cells per condition n = 3. (C) Fold-enrichment of signaling proteins at EML4-ALK granules ±24 h treatment with 1 μM crizotinib (criz). ∗∗p < 0.01, paired t test. Orange line denotes zero enrichment. (D) Anti-ALK IF images in H3122 cells with endogenous mNG2-tagging of GRB2 representative of 20+ cells, n = 3. Scale bar, 5 μM. For (A) and (D), arrows indicate a representative EML4-ALK granule with local enrichment of signaling proteins (multiple non-highlighted granules also show colocalization). For all panels, error bars represent ±SEM. See also Figure S2.
Figure S2
Figure S2
RAS adaptor protein GRB2 is recruited to EML4-ALK cytoplasmic protein granules, related to Figure 2 (A) Live-cell confocal imaging of mTagBFP2::EGFR L858R (oncogenic EGFR) expressed in human epithelial cell lines (Beas2B) with endogenous mNeonGreen2-tagging of GRB2, GAB1, and SOS1. Arrows denote plasma membrane enrichment of GRB2, GAB1, and SOS1. Representative images from at least 30 cells analyzed per condition in 3 independent experiments. (B) Live-cell confocal imaging of mTagBFP2::EML4-ALK and mEGFP::GRB2 upon dual expression in Beas2B cells. White arrows indicate a representative EML4-ALK cytoplasmic protein granule with local enrichment of GRB2 (multiple non-highlighted granules also show colocalization between EML4-ALK and GRB2). Images are representative of 100 analyzed cells in total over 3 independent experiments. (C) FRAP experiments performed in human epithelial cells (Beas2B) with endogenous mNeonGreen2-tagging of GRB2, upon expression of mTagBFP2::EML4-ALK. Graph displays individual recovery of fluorescence intensity after photobleaching of GRB2 enriched at EML4-ALK granules, t denotes time in seconds, intensity in arbitrary units (a.u.) normalized to 1. N = 30 cells.
Figure S3
Figure S3
EML4-ALK-specific activation of cytosolic RAS, related to Figure 3 (A) Live-cell confocal imaging of human epithelial cell lines (Beas2B) with endogenous mNeonGreen2-tagging of KRAS, HRAS, and NRAS. Images are representative of at least 20 analyzed cells per condition in 3 independent experiments. (B) Live-cell confocal imaging of human epithelial cell line Beas2B expressing mEGFP-tagged cytosolic RAS mutants (KRAS-C185S, HRAS-C186S, NRAS-C186S). Images are representative of at least 25 analyzed cells per condition in 3 independent experiments. (C, D) KRAS wild-type (WT) or cytosolic KRAS-C185S were stably expressed in 293T cells and then transfected with either empty vector (EV), EML4-ALK, or oncogenic EGFR-L858R (mutEGFR). Western blotting images are representative of at least 3 independent experiments and RAS-GTP levels are quantified in Main Figures 3A and 3B. (E-L) HRAS/NRAS wild-type or cytosolic mutants (HRAS C186S, NRAS C186S) were stably expressed in 293T cells and then transfected with either empty vector (EV), EML4-ALK, or oncogenic EGFR-L858R (mutEGFR). RAS-GTP levels were normalized to the relevant total RAS protein level (H/NRAS wild-type or C186S). n = 4. Error bars represent ± SEM, denotes p value < 0.05, n.s. denotes non-significant comparison, one-way ANOVA with post hoc Tukey’s HSD test. Western blotting images are representative of 4 independent experiments. (M, N) EML4-ALK expressing H3122 cancer cell line with stable expression of KRAS wild-type or cytosolic KRAS C185S mutant ± 2 hours of 100 nM crizotinib. Western blotting images are representative of 3 independent experiments and RAS-GTP levels are quantified in Main Figures 3C and 3D. (O-R) Patient-derived oncogenic EGFR expressing cell line (HCC827) with stable expression of either wild-type KRAS or cytosolic mutant (KRAS C185S). RAS-GTP levels determined ± 2 hours of 100 nM erlotinib treatment and normalized to the relevant total RAS protein level (KRAS wild-type or C185S). n = 4. Error bars represent ± SEM, denotes p value < 0.05, n.s. denotes non-significant comparison, paired t test. Western blotting images are representative of 4 independent experiments. (S) Live-cell confocal imaging of human epithelial cell line Beas2B with GFP-labeled RAS-GTP reporter (tandem GFP-RBD). Left column demonstrates baseline RAS-GTP reporter localization to cytosol and nucleoplasm, right three panels show plasma membrane re-localization of RAS-GTP reporter upon expression of mTagBFP2::KRAS G12V (oncogenic KRAS). Images are representative of 15-25 cells analyzed per condition in 3 independent experiments.
Figure 3
Figure 3
Cytoplasmic EML4-ALK protein granules locally activate RAS (A–D) RAS-GTP levels of KRAS wild-type (A and C) or C185S cytosolic mutant (B and D) stably expressed in 293T or H3122 cells, followed by transfection of empty vector (EV), EML4-ALK, or oncogenic EGFR (A and B) or ±2 h of 100 nM crizotinib (C and D). n = 3. See STAR Methods for normalization details. (E) Live-cell imaging of RAS-GTP reporter in Beas2B cells ± mTagBFP2::EML4-ALK. Arrow indicates a representative EML4-ALK granule with local enrichment of RAS-GTP (multiple non-highlighted granules also show colocalization). (F) Per cell quantification of EML4-ALK granule/RAS-GTP reporter colocalization. WT denotes unmodified GFP-RBD reporter, RBD mutant (R59A/N64D) displays diminished RAS-GTP binding. n = 3, 30+ cells per replicate. For all panels, error bars represent ± SEM, p < 0.05, ∗∗p < 0.01, n.s., non-significant comparison, one-way ANOVA with post hoc Tukey’s HSD test (A, B, and F) or paired t test (C and D). See also Figure S3.
Figure 4
Figure 4
Protein granule formation by EML4-ALK is critical for RAS/MAPK signaling (A) Domain structure schematic of EML4-ALK. (B) Live-cell imaging of mTagBFP2::EML4-ALK wild-type (WT) or mutant forms in Beas2B cells. (C) Quantification of % cells with granules (6 or greater). 75 cells per condition, n = 3. (D) Anti-FLAG co-IP of FLAG-tagged WT or mutant EML4-ALK forms in 293T cells, followed by GRB2 western blotting. n = 3. (E and F) Endogenous RAS-GTP levels (E) and ERK activation (F) by western blotting upon expression of EML4-ALK WT or mutant forms in 293T cells. n = 4. See STAR Methods for normalization details. (G and H) Live-cell imaging of mTagBFP2::EML4-ALK in Beas2B cells after small interfering RNA (siRNA) treatment (72 h). Quantification of % cells with granules, 100 total cells, n = 3 (G). Representative images in Figure S4D. Western blotting for siRNA knockdown, n = 3 (H). (I) Structure schematic of adaptor protein GRB2. (J) Live-cell imaging of mTagBFP2::EML4-ALK and mEGFP-labeled GRB2 mutants in Beas2B cells after 72 h siRNA against endogenous GRB2. SH2 only denotes the GRB2 SH2 domain. Arrows indicate representative EML4-ALK granules with local enrichment of GRB2 mutants (multiple non-highlighted granules also show colocalization). (K) Quantification of % cells with EML4-ALK granules (6 or greater). 75 total cells per condition, n = 3. (L) Western blotting upon co-expression of EML4-ALK and mEGFP-labeled GRB2 mutants in 293T cells after 72 h of siRNA against endogenous GRB2. For all panels, error bars represent ±SEM, p < 0.05, ∗∗p < 0.01, one-way ANOVA with post hoc Tukey’s HSD test.
Figure S4
Figure S4
Non-granule-forming mutants of EML4-ALK disrupt RAS/MAPK signaling, related to Figure 4 (A) Western blotting upon expression of wild-type EML4-ALK or EML4-ALK kinase-deficient (K589M), ΔTD or ΔHELP mutants in human epithelial cell line Beas2B. Representative images and quantification of percentage of cells with granules shown in Main Figures 4B and 4C. (B) Anti-FLAG immunofluorescence of human epithelial cell line Beas2B expressing either FLAG-tagged EML4-ALK wild-type (WT) or EML4-ALK kinase-deficient (K589M), ΔTD or ΔHELP mutants. EML4-ALK (FLAG) staining in pink, DAPI in blue. Images are representative of at least 35 cells analyzed per condition in 2 independent replicates. Scale bar = 5 μM. (C) Western blotting and immunoprecipitation (IP) for levels of endogenous RAS activation (GTP-bound RAS) upon expression of wild-type EML4-ALK or EML4-ALK kinase-deficient (K589M), ΔTD or ΔHELP mutants in 293T cells. Images are representative of at least 5 independent experiments. RAS-GTP and pERK levels are quantified in Main Figures 4E and 4F. (D) Live-cell confocal imaging upon expression of mTagBFP2::EML4-ALK in Beas2B cells after 72 hours of siRNA treatment. Images are representative of at least 4 independent experiments and percent granule formation is quantified in Main Figure 4G.
Figure S5
Figure S5
Higher-order granule formation is critical for RAS/MAPK signaling, related to Figure 5 (A) Forced clustering of proteins achieved by N-terminal hexameric and C-terminal tetrameric tags that form higher-order clustered assemblies upon expression in cells. (B, C) Quantification of endogenous RAS-GTP levels and representative western blots from 293T cells expressing an empty vector (EV), EML4-ALK wild-type (WT), or the diffusely cytosolic EML4-ALK mutants (kinase deficient K589M, ΔTD, or ΔHELP) +/– forced clustering (HOtag). EML4-ALK K589M, ΔTD and ΔHELP mutants (blue bars) display significantly reduced RAS-GTP levels compared to wild-type EML4-ALK (black bar), ∗∗ denotes p < 0.01 by one-way ANOVA with post hoc Tukey’s HSD test. Forced clustering (HOtag, red bars) of EML4-ALK ΔTD and ΔHELP mutants, but not EML4-ALK K589M, significantly increases RAS-GTP levels compared to the respective non-clustered EML4-ALK mutants (blue bars), denotes p < 0.05, n.s. denotes non-significant comparison, paired t test. RAS-GTP levels normalized to total RAS protein levels and then internally normalized to EML4-ALK mutant expression levels. n = 4. Error bars represent ± SEM. (D, E) Stable expression of cytosolic KRAS mutant (KRAS C185S) in 293T cells, followed by transfection of empty vector (EV), EML4-ALK wild-type (WT) or diffusely cytosolic EML4-ALK ΔTD mutant ± forced clustering (HOtag). Levels of GTP-bound KRAS C185S were normalized to total KRAS C185S protein levels and then internally normalized to expression level of EML4-ALK form. Western blot images representative of n = 4 independent experiments. Error bars represent ± SEM, denotes p < 0.05 by paired t test. (F) Live-cell confocal imaging of mTagBFP2::EML4-ALK variant 3 expressed in human epithelial cell line Beas2B with endogenous mNG2-tagging of GRB2. White arrows indicate a representative EML4-ALK variant 3 cytoplasmic protein granule with local enrichment of GRB2 (multiple non-highlighted granules also show colocalization between EML4-ALK variant 3 and GRB2). Images are representative of at least 25 analyzed cells in 3 independent experiments. (G, H) Western blot analysis upon expression of empty vector (EV) or EML4-ALK variant 3 in 293T cells to assess levels of EML4-ALK activation (phosphorylation), ERK activation, and in immunoprecipitation (IP) panel (H), levels of RAS activation (GTP-bound RAS). Representative images from at least 4 independent experiments. (I) Western blot analysis upon expression of empty vector (EV) or EML4-ALK variants 1, 3, or 5 in 293T cells to assess levels of ERK activation. Images are representative of at least 4 independent experiments and pERK levels are quantified in Main Figure 5J. (J) Live-cell confocal imaging of YFP::EML4-ALK variant 5 ± forced clustering (HOtag) in human epithelial cell line Beas2B. Images are representative of at least 20 analyzed cells in 3 independent experiments. (K) Western blot analysis upon expression of empty vector (EV) or EML4-ALK variant 5 ± HOtag in 293T cells. Images are representative of at least 4 independent experiments. (L) YFP- and HA-tagged versions of EML4-ALK variants 1, 3, and 5 were expressed in 293T cells as indicated. Western blot analysis of input and immunoprecipitation (IP) with anti-HA beads. Images are representative of 3 independent experiments. (M, N) Violin plot of EML4-ALK granule number and representative live-cell confocal images of Beas2B cells expressing YFP::EML4-ALK treated with DMSO, 20 μM chloroquine (CQ), or 20 nM bafilomycin (Bafilo) for 24 hours. At least 50 cells were analyzed per condition over 3 independent experiments. Median diameter of granules calculated from analysis of 20 cells. denotes p < 0.05 by one-way ANOVA with post hoc Tukey’s HSD test. (O, P) Violin plot of number of LC3B puncta and representative live-cell confocal images of Beas2B cells expressing mEGFP::LC3B treated with DMSO, 20 μM chloroquine (CQ), or 20 nM bafilomycin (Bafilo) for 24 hours. At least 50 cells were analyzed per condition over 3 independent experiments. ∗∗ denotes p < 0.01 by one-way ANOVA with post hoc Tukey’s HSD test. (Q, R, S) Western blot analysis in EML4-ALK expressing H3122 cancer cell line treated with listed doses of chloroquine or bafilomycin for 24 hours. 500 nM ceritinib was added 1 hour prior to harvesting lysates (S). Images are representative of 4 independent experiments. (T) Live-cell confocal images of Beas2B cells expressing mTagBFP2::EML4-ALK and mEGFP-tagged LC3/ATG8 family proteins. Images are representative of 3 independent experiments. Percent colocalization calculated from at least 60 cells in a total of 3 independent experiments. Standard error for percent colocalization: p62 (2.1), Ubiquitin (4.0), LC3B (0.9), and LC3C (2.6).
Figure 5
Figure 5
Forced higher-order assembly of EML4-ALK cytosolic mutants drives RAS/MAPK signaling (A) Live-cell imaging of HOtag-mTagBFP2::EML4-ALK mutants in Beas2B cells with endogenous mNG2-tagging of GRB2. (B) Quantification of GRB2 colocalization with HOtag-EML4-ALK mutant granules. 130 total cells per condition, n = 3. (C and D) Western blotting upon expression of WT or mutant EML4-ALK forms ± HOtag in 293T cells, n = 5. pERK levels normalized to WT EML4-ALK, set at 100. (E) Live-cell imaging of mTagBFP2::iEGFR ± HOtag in Beas2B cells with endogenous mNG2-tagging of GRB2. (F) Quantification of western blotting upon expression of EV, iEGFR, or iEGFR kinase-deficient (K78A) mutant ± HOtag in 293T cells, n = 6. (G) Structure schematic of EML4-ALK variants 1, 3, and 5. (H and I) Live-cell imaging of YFP::EML4-ALK variants in Beas2B cells (H). Quantification of % cells with granules (6 or greater) (I). 100+ total cells per condition, n = 3. (J) Quantification of western blotting upon expression of EML4-ALK variants in 293T cells. n = 3. (K) Quantification of FRAP for YFP::EML4-ALK variants in Beas2B cells. Mobile fraction refers to % recovery at 1 min. EML4-ALK variant 1 (N = 25 cells) and variant 3 (N = 24 cells), conducted over 3 replicates. (L) FRAP analysis of YFP::EML4-ALK variant 3 granules in Beas2B cells. N = 24 cells. For (A) and (E), arrows indicate representative HOtag granules with local enrichment of GRB2 (multiple non-highlighted granules also show colocalization). For all panels, error bars represent ±SEM, p < 0.05. n.s., non-significant comparison, one-way ANOVA with post hoc Tukey’s HSD test (B, I, and J) or paired t test (D and F). See also Figure S5.
Figure 6
Figure 6
Cytoplasmic granule formation is a general mechanism for RTK-mediated RAS/MAPK pathway activation in cancer (A) Domain structure schematic of CCDC6-RET. (B) Live-cell imaging of mTagBFP2::CCDC6-RET in Beas2B cells with endogenous mNG2-tagging of GRB2. (C) Live-cell imaging of Beas2B cells expressing mTagBFP2::CCDC6-RET and RAS-GTP reporter. (D and E) Quantification of endogenous RAS-GTP levels (D) and ERK phosphorylation (E) by western blotting in 293T cells expressing EV, CCDC6-RET WT, or mutant forms. n = 4. (F and G) Live-cell imaging of mEGFP-tagged CCDC6-ALK WT or kinase-deficient K194M mutant in Beas2B cells. Quantification of % cells with granules (6 or greater) from 75 total cells, n = 3. (H) Western blotting upon expression of EV, CCDC6-ALK WT or K194M mutant in 293T cells. (I and J) Live-cell imaging of mEGFP-tagged EML4-RET WT or kinase-deficient K542M mutant in Beas2B cells. Quantification of % cells with granules from 75 total cells, n = 3. (K) Western blotting upon expression of EV, EML4-RET WT, or K542M mutant in 293T cells. (L) Simplified threshold model for RTK protein granule formation based on cumulative valency of protein interactions contributed by N-terminal RTK fusion partner and kinase-dependent GRB2 binding in each protein assembly context. For (B) and (C), arrows indicate a representative CCDC6-RET cytoplasmic protein granule with local enrichment of GRB2 (B) or RAS-GTP reporter (C) (multiple non-highlighted granules also show colocalization). For all panels, microscopy images representative of at least 75 cells analyzed over 3 replicates. Error bars represent ±SEM, ∗∗p < 0.01, p < 0.05. n.s., non-significant comparison, one-way ANOVA with post hoc Tukey’s HSD test (D and E) or paired t test (G and J). See also Figure S6.
Figure S6
Figure S6
CCDC6-RET forms membraneless cytoplasmic protein granules that are critical for RAS/MAPK pathway activation, related to Figure 6 (A) Live-cell confocal imaging of human epithelial cell line Beas2B upon expression of mTagBFP2::CCDC6-RET and mEGFP-tagged organelle markers as listed. Membrane dye experiments were conducted using live cells incubated with CellTracker CM-DiI Dye (Invitrogen) according to manufacturer’s recommended protocol. Each panel is a representative image of at least 20 analyzed cells per condition with at least 3 independent replicates. (B) Western blotting and immunoprecipitation (IP) for levels of endogenous RAS activation (RAS-GTP) upon expression of an empty vector (EV), CCDC6-RET wild-type (WT) or CCDC6-RET mutants (coiled-coiled domain deletion mutant, ΔCC, and kinase-deficient mutant K147M) in 293T cells. Western blot images are representative of 4 independent experiments. RAS-GTP levels and pERK levels are quantified in Main Figures 6D and 6E. (C) Live-cell confocal imaging of human epithelial cell line Beas2B expressing mTagBFP2-labeled CCDC6-RET wild-type(WT), the coiled-coiled domain deletion mutant (ΔCC), CCDC6-RET K147M (kinase-deficient mutant), or Amino Acids 1-101 of CCDC6. Quantification of cells with 6 or more granules shown as a fraction ± SEM based on 3 independent experiments of at least 25 cells analyzed per condition. Scale bar = 5 μM. (D) Live-cell confocal imaging of mTagBFP2::CCDC6-RET K147M (kinase-deficient mutant) expressed in the human epithelial cell line Beas2B with endogenous mNG2-tagging of GRB2. Images are representative of 60 analyzed cells in total over 3 independent experiments with no observed local enrichment of GRB2 at CCDC6-RET K147M granules.
Figure 7
Figure 7
Signaling architecture of membraneless RTK protein granules (A) List of EML4-ALK granule components. (B) Anti-FLAG co-IP of FLAG-tagged EML4-ALK WT or ΔTD mutant expressed in 293T cells, followed by western blotting. (C) Live-cell imaging of mTagBFP2::EML4-ALK and mEGFP-tagged signaling proteins expressed in Beas2B cells. (D) List of CCDC6-RET granule components. (E) Anti-FLAG co-IP of FLAG-tagged CCDC6-RET WT or ΔCC mutant expressed in 293T cells, followed by western blotting. (F) Live-cell imaging of mTagBFP2::CCDC6-RET and mEGFP-tagged signaling proteins expressed in Beas2B cells. (G) Western blotting upon expression in 293T cells of EML4-ALK variants or oncogenic full-length ALK (F1174L) found in neuroblastoma (NB). n = 4. (H) Model for membraneless cytoplasmic protein granule-based oncogenic RTK/RAS/MAPK signaling. KD denotes the kinase domain of the RTK fusion oncoprotein. For (A), (B), (D), and (E), starred proteins both co-precipitate and locally enrich by imaging, non-starred proteins only enrich at granules by imaging. WCL denotes whole cell lysates. Images representative of at least 4 replicates. For (C) and (F), arrows indicate a representative EML4-ALK or CCDC6-RET protein granule with local enrichment of respective signaling proteins (multiple non-highlighted granules also show colocalization). All listed signaling proteins showed greater than 85% colocalization with EML4-ALK or CCDC6-RET granules. n = 3. See also Figure S7.
Figure S7
Figure S7
Signaling components of membraneless RTK protein granules, related to Figure 7 (A) Live-cell confocal imaging of mTagBFP2::EML4-ALK and mEGFP-tagged signaling proteins expressed in Beas2B cells. White arrows indicate a representative EML4-ALK protein granule with local enrichment of respective signaling proteins (multiple non-highlighted granules also show colocalization between EML4-ALK and signaling proteins). Images are representative of at least 20 cells analyzed in 3 independent experiments with greater than 80% colocalization observed for all signaling proteins. (B, C) List of proteins that were mEGFP-tagged and did not enrich at mTagBFP2::EML4-ALK or mTagBFP2::CCDC6-RET protein granules upon expression in Beas2B cells. RAS GTPase activating proteins (GAPs) are displayed in red, proteins with differential localization between EML4-ALK and CCDC6-RET are displayed in blue. (D) Live-cell confocal imaging of mEGFP::p110β and mTagBFP2::EML4-ALK or mTagBFP2::CCDC6-RET expressed in Beas2B cells. White arrows indicate a representative RTK protein granule with local enrichment of p110β (multiple non-highlighted granules also show enrichment of p110β). (E) Live-cell confocal imaging of PI3K activity reporter (mCherry-tagged AKT2-PH domain, which functions as a PIP3 sensor) alone or with mTagBFP2::EML4-ALK or mTagBFP2::CCDC6-RET expression in Beas2B cells. White arrows indicate plasma membrane enrichment of the PI3K activity reporter. (F) Western blotting upon expression of wild-type CCDC6-RET or non-granule-forming, coiled-coil domain deletion mutant ΔCC in 293T cells. EV denotes empty vector. Images are representative of at least 5 independent experiments.

Comment in

References

    1. Aizer A., Brody Y., Ler L.W., Sonenberg N., Singer R.H., Shav-Tal Y. The dynamics of mammalian P body transport, assembly, and disassembly in vivo. Mol. Biol. Cell. 2008;19:4154–4166. - PMC - PubMed
    1. Alberti S., Gladfelter A., Mittag T. Considerations and Challenges in Studying Liquid-Liquid Phase Separation and Biomolecular Condensates. Cell. 2019;176:419–434. - PMC - PubMed
    1. Banani S.F., Lee H.O., Hyman A.A., Rosen M.K. Biomolecular condensates: organizers of cellular biochemistry. Nat. Rev. Mol. Cell Biol. 2017;18:285–298. - PMC - PubMed
    1. Bell E.S., Coelho P.P., Ratcliffe C.D.H., Rajadurai C.V., Peschard P., Vaillancourt R., Zuo D., Park M. LC3C-Mediated Autophagy Selectively Regulates the Met RTK and HGF-Stimulated Migration and Invasion. Cell Rep. 2019;29:4053–4068.e6. - PubMed
    1. Belyy V., Tran N.-H., Walter P. Quantitative microscopy reveals dynamics and fate of clustered IRE1α. Proc. Natl. Acad. Sci. USA. 2020;117:1533–1542. - PMC - PubMed

Publication types

MeSH terms