. 2021 May 6;28(5):955-966.e7.
doi: 10.1016/j.stem.2021.03.018. Epub 2021 Apr 12.

Early stem cell aging in the mature brain

Affiliations

Early stem cell aging in the mature brain

Albina Ibrayeva et al. Cell Stem Cell. .

Abstract

Stem cell dysfunction drives many age-related disorders. Identifying mechanisms that initially compromise stem cell behavior represent early targets to promote tissue function later in life. Here, we pinpoint multiple factors that disrupt neural stem cell (NSC) behavior in the adult hippocampus. Clonal tracing showed that NSCs exhibit asynchronous depletion by identifying short-term NSCs (ST-NSCs) and long-term NSCs (LT-NSCs). ST-NSCs divide rapidly to generate neurons and deplete in the young brain. Meanwhile, multipotent LT-NSCs are maintained for months but are pushed out of homeostasis by lengthening quiescence. Single-cell transcriptome analysis of deep NSC quiescence revealed several hallmarks of molecular aging in the mature brain and identified tyrosine-protein kinase Abl1 as an NSC aging factor. Treatment with the Abl inhibitor imatinib increased NSC activation without impairing NSC maintenance in the middle-aged brain. Our study indicates that hippocampal NSCs are particularly vulnerable and adaptable to cellular aging.

Keywords: Abl; Imatinib; adult neurogenesis; aging; bioinformatics; cell fate; clonal analysis; hippocampus; intervention; proliferation; quiescence; single cell RNA-seq; stem cell.


Conflict of interest statement

Declaration of interests The authors declare no competing interests.

Figures

Figure 1.
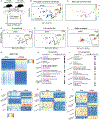
Figure 1.. Asynchronous neural stem cell (NSC) decline during aging. (See also Figure S1 and S2)
(A) Confocal immunofluorescence images showing NSCs (Nestin+) and cell proliferation (Mcm2+) in the 3 mo and 12mo mouse hippocampus. Arrow - Nestin+Mcm2+ aNSC, Arrowhead - Nestin+Mcm2+ qNSC. (B) Quantification of total NSC number across ages. N=4–6 mice; Mean± SEM. ANOVA with Bonferroni post-hoc test (B-C). (C) Quantification of quiescent NSC (Nestin+ MCM2) percentage among total NSCs across ages. (D) Cartoon of NSC subpopulations in the adult hippocampus. (left) Nestin#-labeled multipotential NSCs. (right) Developmental-like NSCs labeled by Ascl1#. A=astroglial lineage, IPC=intermediate progenitor cell, N=neuronal lineage, G0=quiescent state, G1->M=active state. (E) Experimental design of in vivo single cell clonal lineage tracing for Nestin#-NSC and Ascl1#-NSC subpopulations (Table S1–2). (F) Confocal images of distinct RGL and IPC morphologies from Nestin# and Ascl1# clones acquired from 6mo mouse. Arrow - GFP+GFAP+ NSCs (RGLs); arrowhead - GFP+GFAP- IPC/NB (neuroblast). (G) NSC clone maintenance (the time until 50% of clones exhibit NSC depletion) in 2, 6, 12mo mice. Model fits of clonal data from N=29–104 clones (Table S2). Data is derived from modeling (Figure S2). Error bars show variability in the inferred values due to model sensitivity; derived by varying all real-valued model parameters by ±5% for all possible combinations. (H) Cartoon depicting clonal maintenance and depletion. (I) Confocal images of a maintained clone containing NSC (1) and IPCs (2); and a depleted clone containing neurons (1) and (2). (J) Quantification of NSC homeostasis duration. Mean± SEM. (N = 29–104 clones, Table S2). ANOVA with Tukey’s multiple comparisons test. Scale bar, 100µm stitched images [boxed 25µm] (A), 20µm (F), 10µm (I) .*p<0.05, **p<0.01, ***p<0.001, n.s - not significant.
Figure 2.
Figure 2.. Increased quiescence drives NSC loss of homeostasis. (See also Figure S1 and S2)
(A) Cartoon illustrating NSC homeostasis and its imbalance by changes in NSC expansion or depletion. (B) Quantification of NSC clone maintenance. Statistics for predicted values use a nonlinear second order polynomial regression (curve fit), GraphPad. (N = 30–69 clones, Table S2). (C) Quantification of NSC self-renewal in the mature hippocampus, Nestin#-NSCs slow their expansion in approximately 4mo mice indicating homeostatic imbalance. PV=predicted value to maintain NSC homeostasis (N = 30–69 clones, Table S2). (D) Quantification of average cell number per NSC-containing clones across 2- and 6mo animals at multiple days post tamoxifen injection (Table S2). (N = 30–69 clones, Table S2). ANOVA with Bonferroni post-hoc test. (E) Cartoon of time to the first and second NSC divisions. (G0 = quiescence; G1 -> M = activation). (F) Quantification of Nestin#-NSC cell cycle entry based on lineage analysis from 2 and 6mo mice. Mean± SEM. (N = 30–69 clones, Table S2). ANOVA with Bonferroni post-hoc test (F-G). (G) Quantification of Nestin#-NSC cell cycle re-entry based on lineage analysis from 2- and 6mo mice. Mean± SEM (N = 30–69 clones, Table S2). (H) Schematic illustration of NSC fate choices. NSC=neural stem cell; A=astroglial lineage; IPC=intermediate progenitor cell; N=neuronal lineage. (I) Representative confocal images of clonal NSC self-renewing fate choices. 1 – NSC; 2 – N; 3 – A. (J) Quantification of self-renewing cell fate choices outcome from Nestin#, at 2, 6 and 12mo animals at 60 days post tamoxifen injection (Table S1). 0 – no observed phenotype. Mean± SEM. ANOVA with Bonferroni post-hoc test. (K) Cartoon summary of the cellular mechanisms driving age-related NSC dysfunction. Scale bar 10µm (I). *p<0.05, **p<0.01, ***p<0.001, n.s - not significant.
Figure 3.
Figure 3.. Quiescent NSC molecular aging in the mature hippocampus. (See also Figure S3 and S4)
(A) Schematic illustration of the single cell RNA-Seq. (B) Principal component analysis of NSC transcriptomes from 2mo (N = 3), 4.5mo mice (N = 3, pooled, single biological replicate), a total of 89 cells were used, colors are represented k-means clusters. (C) NSCs identified by gene enrichment analysis using Nestin+, Vimentin+, Fabp7+, Aldoc+, Apoe+ markers. (D) RNA velocity defines single cell future states (arrows) identified in quiescent NSCs (qNSC), active NSCs (aNSCs) and IPCs from 2mo. (E) RNA velocity in qNSCs, active aNSCs and IPCs from 4.5mo. (F) RNA velocity analysis reveals NSCs more resistant to activate in 4.5mo mice, whereas some qNSCs from 2mo mice will enter cell cycle. (G) Quiescent NSC differential expression heat map between 2 and 4.5mo mice. (H) Top upregulated gene ontology (GO) terms between qNSCs derived from 2- and 4.5mo mice identify molecular aging. FDR-corrected p-values are shown (H-I). (I) Top downregulated GO terms between qNSCs derived from 2 and 4.5mo mice also reveal molecular aging. (J) Heat map of Neurogenesis, Gliogenesis and Cell cycle transcript changes between qNSCs derived from 2 and 4.5mo mice. (K) Heat map of Semaphorin, Ras and Rho signaling and signaling transcript changes between qNSCs derived from 2 and 4.5mo mice. (L) Heat map of Histone Demethylation, Transcription, NIK/NF kappaB signaling, DNA recombination, DNA repair and Double strand break repair transcript changes between qNSCs derived from 2 and 4.5mo mice.
Figure 4.
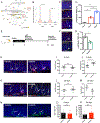
Figure 4.. Imatinib partially restores NSC function in the middle-aged brain. (See also Figure S4)
(A) String network graph depicting age-related changes downregulated in 4.5mo qNSCs. Shown genes have 3+ connections to biological processes. (B) Violin plot of Abl1, Abl2 expression in qNSCs in 2 and 4.5mo mice. edgeR (quasi-likelihood F-test), FDR-corrected p-values are shown. (C) Confocal images of c-Abl and Nestin co-expression across multiple ages (2, 6, 10 mo). Arrowhead - Nestin+c-Abl+ NSCs. (D) Quantification of double positive NSCs (Nestin+ c-Abl+) fraction among total Nestin+ NSCs in 2, 6, 10mo mice. Mean ± SEM. (N = 2–3 animals per group). ANOVA with Bonferroni post-hoc test. (E) Schematic illustration of the experimental design for intracranial drug infusion. (F) Confocal images of c-Abl and Nestin co-expression in Vehicle-Control and Imatinib-treated brains. Arrowhead - Nestin+c-Abl+ NSC. (G) Quantification of double positive NSC (Nestin+ c-Abl+) fraction among total Nestin+ NSCs in the 10mo Vehicle-Control and Imatinib-treated animals. Values represent ± SEM. N = 3 animals per group. ANOVA with Bonferroni post-hoc test. (H) Confocal immunofluorescence images for NSCs (Nestin+) and cell proliferation (Mcm2+) in 10mo Vehicle-Control and Imatinib-treated mice for 6 days. Arrow - Nestin+ NSC, Arrowhead - Nestin+MCM2+ NSC. (I) Quantification of total NSC number (Nestin+) in 10mo Vehicle-Control and Imatinib-treated mice for 6 days. Mean± SEM. N = 9 mice (Vehicle), N = 8 mice (Imatinib – treated). Man-Whitney U-test. (J) Quantification of the aNSC (Nestin+ MCM2+) fraction among total Nestin+ NSCs in 10mo Vehicle-Control and Imatinib-treated mice for 6 days. Mean± SEM. N = 9 mice (Vehicle), N = 8 mice (Imatinib – treated). Man-Whitney U-test. (K) Confocal immunofluorescence images for NSCs (Nestin+) and cell proliferation (Mcm2+) in 10mo Vehicle-Control and Imatinib-treated mice for 6 days and sacrificed at day 28. Arrow - Nestin+ NSC, Arrowhead - Nestin+MCM2+ NSC. (L) Quantification of total NSC number (Nestin+) in 10mo Vehicle-Control and Imatinib-treated mice for 6 days and sacrificed at day 28. Mean± SEM. N = 7 mice per group. Man-Whitney U-test. (M) Quantification of the active NSC (Nestin+ MCM2+) fraction among total Nestin+ NSCs in 10mo Vehicle-Control and Imatinib-treated mice for 6 days and sacrificed at day 28. Mean ± SEM. N = 7 mice per group. Man-Whitney U-test. (N) Confocal immunofluorescence images for newborn neurons (DCX+) in 10mo Vehicle-Control and Imatinib-treated mice. Arrow – DCX+. (O) Quantification of newborn neuron (DCX+) number in 10mo Vehicle-Control and Imatinib-treated mice for 6 days. Mean ± SEM. N = 9 mice (Vehicle), N = 8 mice (Imatinib – treated). Man-Whitney U-test. (P) Quantification of newborn neuron (DCX+) number in 10mo Vehicle-Control and Imatinib-treated mice for 6 days and sacrificed at day 28. Mean ± SEM. N = 7 mice per group. Man-Whitney U-test. Scale bar, 20µm (C, F, H, K, N) *p<0.05, **p<0.01, ***p<0.001, n.s - not significant.

Comment in

References

    1. Ahn S, and Joyner AL (2005). In vivo analysis of quiescent adult neural stem cells responding to Sonic hedgehog. Nature 437, 1–4. - PubMed
    1. Alexa A, Rahnenfuhrer J, and Lengauer T (2006). Improved scoring of functional groups from gene expression data by decorrelating GO graph structure. Bioinformatics 22, 1600–1607. - PubMed
    1. Almanzar N, Antony J, Baghel AS, Bakerman I, Bansal I, Barres BA, Beachy PA, Berdnik D, Bilen B, Brownfield D, et al. (2020). A single-cell transcriptomic atlas characterizes ageing tissues in the mouse. Nature 583, 590–595. - PMC - PubMed
    1. Anacker C, and Hen R (2017). Adult hippocampal neurogenesis and cognitive flexibility — linking memory and mood. Nat. Rev. Neurosci. 18, 335–346. - PMC - PubMed
    1. Balordi F., and Fishell G. (2007). Mosaic Removal of Hedgehog Signaling in the Adult SVZ Reveals That the Residual Wild-Type Stem Cells Have a Limited Capacity for Self-Renewal. J. Neurosci. 27, 14248–14259. - PMC - PubMed

Publication types