. 2021 Apr 12;39(4):566-579.e7.
doi: 10.1016/j.ccell.2021.02.014.

Therapeutic targeting of ATR yields durable regressions in small cell lung cancers with high replication stress

Affiliations

Therapeutic targeting of ATR yields durable regressions in small cell lung cancers with high replication stress

Anish Thomas et al. Cancer Cell. .

Abstract

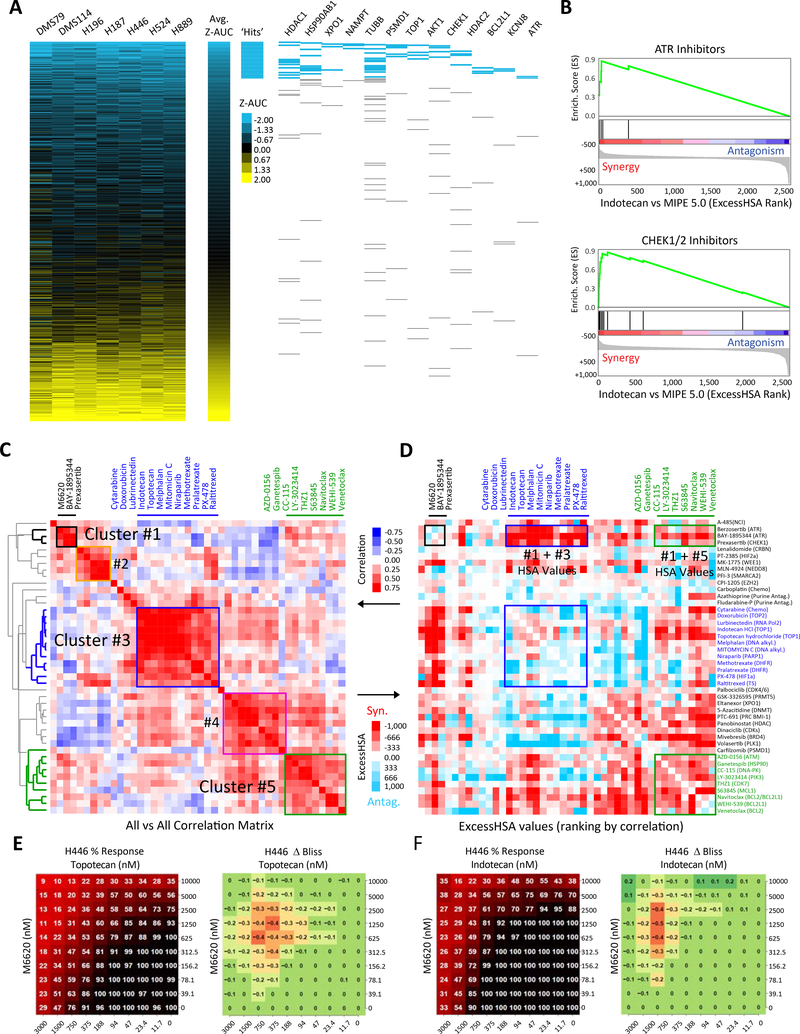
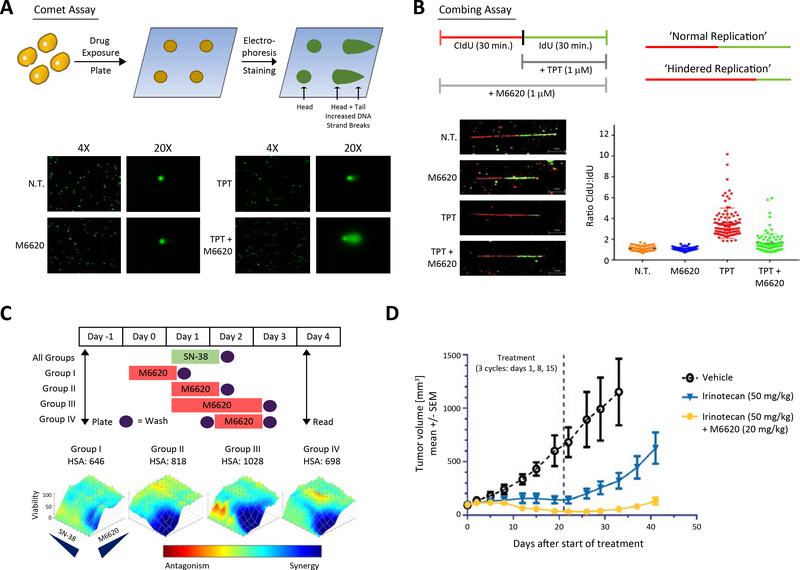
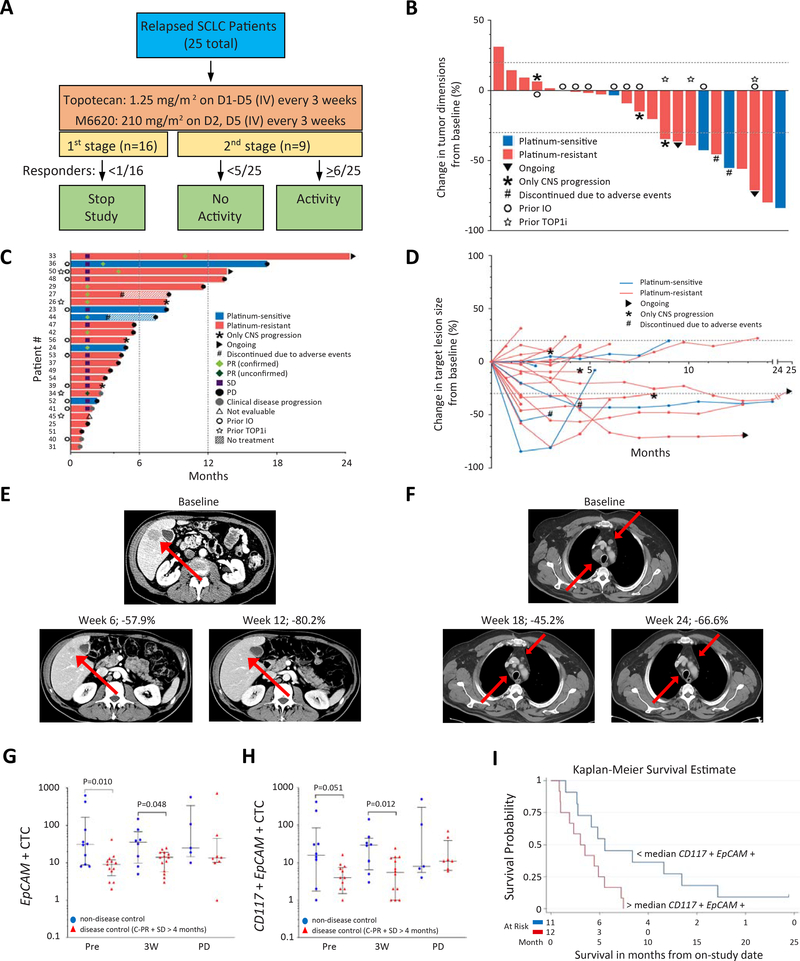
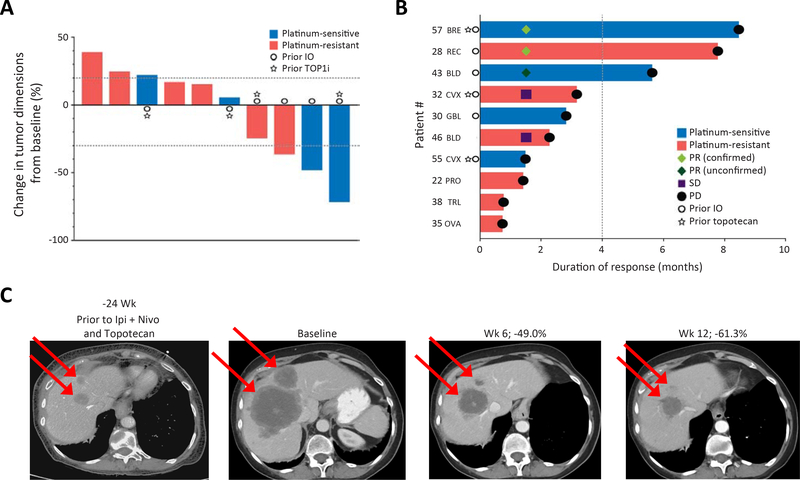
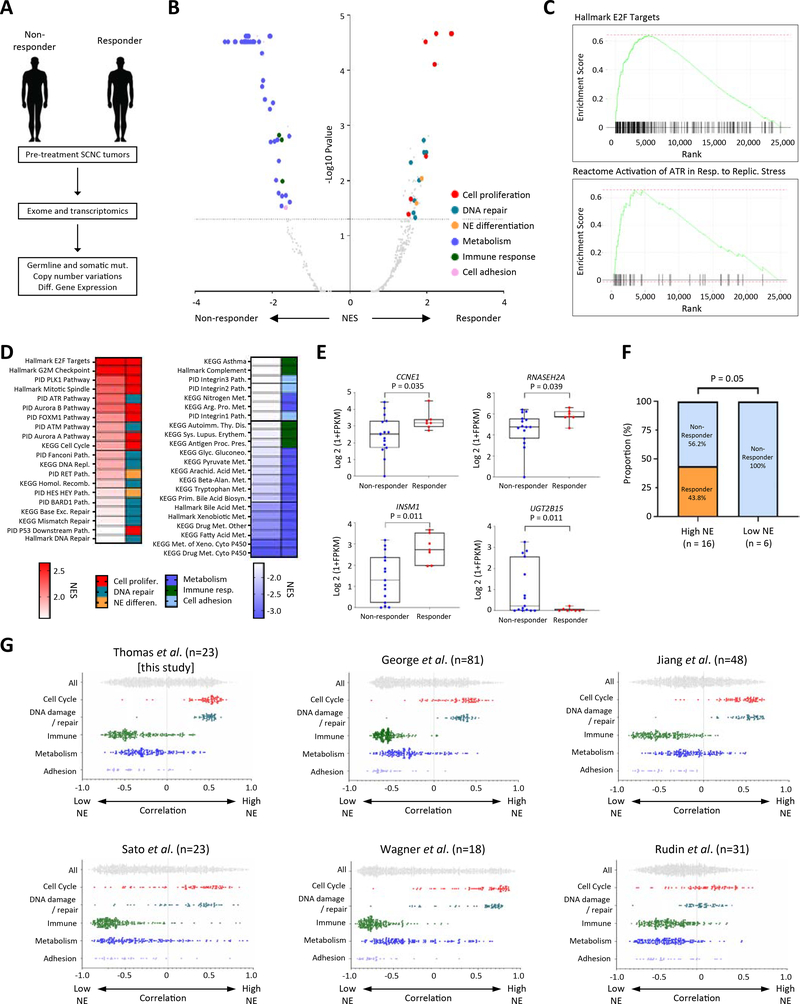
Small cell neuroendocrine cancers (SCNCs) are recalcitrant cancers arising from diverse primary sites that lack effective treatments. Using chemical genetic screens, we identified inhibition of ataxia telangiectasia and rad3 related (ATR), the primary activator of the replication stress response, and topoisomerase I (TOP1), nuclear enzyme that suppresses genomic instability, as synergistically cytotoxic in small cell lung cancer (SCLC). In a proof-of-concept study, we combined M6620 (berzosertib), first-in-class ATR inhibitor, and TOP1 inhibitor topotecan in patients with relapsed SCNCs. Objective response rate among patients with SCLC was 36% (9/25), achieving the primary efficacy endpoint. Durable tumor regressions were observed in patients with platinum-resistant SCNCs, typically fatal within weeks of recurrence. SCNCs with high neuroendocrine differentiation, characterized by enhanced replication stress, were more likely to respond. These findings highlight replication stress as a potentially transformative vulnerability of SCNCs, paving the way for rational patient selection in these cancers, now treated as a single disease.

Keywords: DNA damage response; DNA topoisomerases; SCLC; ataxia telangiectasia mutated and rad3 related; cell-cycle checkpoints; replication stress; small cell neuroendocrine cancers; translational research.


Conflict of interest statement

Declaration of interests H.D., A.Z., and F.T.Z. are employees of Merck KGaA, Darmstadt, Germany. B.E. is an employee of the EMD Serono Research & Development Institute Inc., Billerica, MA, USA; a business of Merck KGaA, Darmstadt, Germany. J.P. was an employee of the EMD Serono Research & Development Institute Inc., Billerica, MA, USA at the time of study. A.T., and Y.P. report research funding to the institution from the following entities: EMD Serono Research & Development Institute Inc., Billerica, MA, USA, AstraZeneca, Tarveda Therapeutics, and Prolynx Inc.

Figures

Figure 1:
Figure 1:. In vitro drug response profiles of SCLC reveal DNA damage response-related vulnerabilities.
A) Heatmap of ranked drug activities for seven SCLC cell lines (DMS114, DMS79, H187, H196, H446, H524 and H889) screened using the MIPE 5.0 library of approved and investigational drugs (n=2480). Activity scores based on Z-transformed area under the curve values. Mechanistic classes enriched among highly active agents are shown on the right panel. B) Drug-target enrichment analysis plots highlighting synergy of TOP1 inhibitors with CHK1 and ATR inhibitors. TOP1-inhibitor combinations examined in combination with MIPE 5.0 library using indotecan (LMP400), a next-generation clinical TOP1 inhibitor. TOP1 inhibitor-drug pairs ranked using the ExcessHSA metric. C) Unsupervised hierarchical clustering based on the correlation of the ExcessHSA showing drug-clusters with similar combination profiles. In this screen, 44 drugs selected based on single-drug activities, synergies from indotecan-combinations, and mechanistic interest were tested in combination (n=946 combinations). D) Correlation heatmap of the 44-drug all-versus-all combination screen highlighting synergistic clusters. 10 × 10 % response and ΔBliss heat maps for the combination of E) topotecan and M6620, and F) indotecan and M6620 across defined concentration ranges in H446 SCLC cell line. SCLC: small cell lung cancer; TOP1: topoisomerase 1; ExcessHSA: Excess over the Highest Single Agent. See also Table S1 and Fig. S1.
Figure 2:
Figure 2:. Concurrent inhibition of ATR and TOP1 exacerbates replication stress and DNA damage.
A) Schematic illustrating the comet assay (single cell gel electrophoresis) for the detection of DNA damage and specified imaging outcomes, highlighting increased DNA strand breaks caused by the combination of M6620 and topotecan. B) Schematic illustrating the combing assay (spatiotemporal analysis of DNA replication) for the detection of replication stress and specified imaging outcomes (mid line is mean+/− standard deviation, n = 100), highlighting the re-establishment of normal replication when M6620 is added to topotecan in the SCLC cell model DMS114. C) Cell viability with SN-38 and M6620 across different treatment schedules in the SCLC cell line H446. M6620 followed by SN-38 does not yield a synergistic effect on cell viability, SN-38 followed by M6620 and co-administration of both drugs creates a synergistic effect. Group I: M6620 for 24 hours followed by 24 hours of SN-38; Group II: concurrent M6620 and SN-38 (24 hours); Group III: concurrent M6620 and SN-38 (24 hours) followed by an additional 24 hours of M6620; Group IV: SN-38 for 24 hours followed by 24 hours of M6620. D) In vivo assessment (mean tumor volume +/− standard deviation, n = 5) of irinotecan (50 mg/kg, IP) alone and combination of irinotecan (50 mg/kg, IP) and M6620 (20 mg/kg, IV) in SCLC PDX LXFS573 model using a 3-cycle schedule with treatments on days 1, 8 and 15. Vertical dashed line marks end of third treatment cycle after 21-days. See also Table S2, Fig. S2.
Figure 3:
Figure 3:. Trial design and efficacy of topotecan and M6620 in relapsed SCLC.
A) Study schema. B) Tumor responses to the combination of M6620 and topotecan in SCLC patients based on maximum change in tumor dimensions from baseline. Each bar represents a patient’s tumor response. C) Efficacy of the combination based on duration of response, and D) change in target lesion size from baseline. E) CT abdomen showing tumor regression in a patient (patient # 42) with platinum-resistant SCLC and liver metastasis (red arrows). F) CT chest showing tumor regression in a patient (patient #50) with platinum-resistant SCLC and hilar lymph node metastases (red arrows). G) Differences of EpCAM+ CTCs in patients with disease control (PR + SD ≥4 months, red triangles) vs. those without (blue circles). The number of samples (non-disease control vs. disease control): 10 vs. 13, 8 vs. 14, 5 vs. 8 pre-treatment, 3 weeks after treatment, and at disease progression, respectively. Median and interquartile ranges are shown. Statistical differences are evaluated by Mann-Whitney U test. H) Differences of CD117+ EpCAM+ CTCs in patients with disease control (PR + SD ≥4 months, red triangles) vs. those without (blue circles). Median and interquartile ranges are shown. I) Kaplan-Meier curve of PFS in patients with < median level of CD117+ EpCAM+ CTCs at pretreatment vs. those with ≥median CD117+ EpCAM+ CTCs. CTCs: circulating tumor cells; PR: partial response; SD: stable disease; PFS: progression-free survival. See also Table S3, Fig. S3.
Figure 4:
Figure 4:. Efficacy of M6620 and topotecan in SCNCs regardless of tissue of origin.
A) Responses to the combination in EP-SCNCs based on change in tumor dimensions from baseline. Each bar represents a patient’s tumor response. The top and bottom dotted lines indicate the cutoffs of disease progression and partial response per RECIST criteria, respectively. B) Efficacy in EP-SCNCs based on duration of response. The dotted line indicates the 4-month timepoint after treatment. C) CT abdomen showing tumor regression in a patient with breast SCNC and liver metastases (patient #57). The patient had undergone extensive previous treatments including topotecan. REC, rectal; BLD, bladder; TRL, transformed lung cancer; BRE: breast; CVX, cervix; GBL, gall bladder; PRO, prostate; OVA, ovarian. See also Table S3.
Figure 5:
Figure 5:. Association of high replication stress and high NE differentiation with responses to M6620 plus topotecan; co-enrichment of high NE differentiation and replication stress among SCLCs.
A) Schema illustrating exomic and transcriptomic profiling of pre-treatment tumors among responding and non-responding SCNCs. B) Volcano plot showing gene set enrichments among SCNC responders and non-responders. Gene sets in the upper left and right quadrants are significantly enriched in non-responders and responders, respectively. Selected gene sets related to cell proliferation, DNA repair, NE differentiation, metabolism, immune response and adhesion are highlighted. C) Relative RNA expression-based enrichment of hallmark E2F targets and Reactome activation of ATR in response to replication stress pathways in responders compared with non-responders. The y-axis represents enrichment score and the x-axis indicates differential expression rank for all genes, with gene set-specific genes marked by vertical black lines. Rank positions toward the left indicate increased expression in responders. D) Hallmark, KEGG and PID gene sets differentially upregulated and downregulated among responders. Color gradation is based on GSEA normalized enrichment score. E) Box plot expression summaries for selected genes upregulated or downregulated among 7 responders (P <0.05) and 16 non-responders. The boxes and error bars indicate median with interquartile range and maximum/minimum ranges, respectively. Statistical differences are evaluated by Mann-Whitney U test. F) Response proportions among SCNCs with high and low NE differentiation. The statistical difference is evaluated by chi-square test. G) Scatter plots showing the distribution of correlations between NE signature scores (ranging from low NE to high NE correlation on the x-axis) and cell cycle, DNA damage, immune, metabolism, and adhesion signature scores (assessed by ssGSEA) in this study and five published, independent SCLC datasets. Within each study, the category-associated correlation distributions were significantly different based on pairwise Kolmogorov-Smirnov tests (P < 0.0001). See also Table S4, Figs. S4–6.

Comment in

Similar articles

Cited by

References

    1. Alcala N, Leblay N, Gabriel AAG, Mangiante L, Hervas D, Giffon T, Sertier AS, Ferrari A, Derks J, Ghantous A, et al. (2019). Integrative and comparative genomic analyses identify clinically relevant pulmonary carcinoid groups and unveil the supra-carcinoids. Nat Commun 10, 3407. - PMC - PubMed
    1. Anand J, Sun Y, Zhao Y, Nitiss KC, and Nitiss JL (2018). Detection of Topoisomerase Covalent Complexes in Eukaryotic Cells. Methods Mol Biol 1703, 283–299. - PubMed
    1. Balanis NG, Sheu KM, Esedebe FN, Patel SJ, Smith BA, Park JW, Alhani S, Gomperts BN, Huang J, Witte ON, and Graeber TG (2019). Pan-cancer Convergence to a Small-Cell Neuroendocrine Phenotype that Shares Susceptibilities with Hematological Malignancies. Cancer Cell 36, 17–+. - PMC - PubMed
    1. Bartkova J, Horejsi Z, Koed K, Kramer A, Tort F, Zieger K, Guldberg P, Sehested M, Nesland JM, Lukas C, et al. (2005). DNA damage response as a candidate anti-cancer barrier in early human tumorigenesis. Nature 434, 864–870. - PubMed
    1. Bartkova J, Rezaei N, Liontos M, Karakaidos P, Kletsas D, Issaeva N, Vassiliou LVF, Kolettas E, Niforou K, Zoumpourlis VC, et al. (2006). Oncogene-induced senescence is part of the tumorigenesis barrier imposed by DNA damage checkpoints. Nature 444, 633–637. - PubMed

Publication types

MeSH terms