. 2021 Aug 1:236:118050.
doi: 10.1016/j.neuroimage.2021.118050. Epub 2021 Apr 19.

Coupling between the phase of a neural oscillation or bodily rhythm with behavior: Evaluation of different statistical procedures

Affiliations

Coupling between the phase of a neural oscillation or bodily rhythm with behavior: Evaluation of different statistical procedures

Nicolai Wolpert et al. Neuroimage. .

Abstract

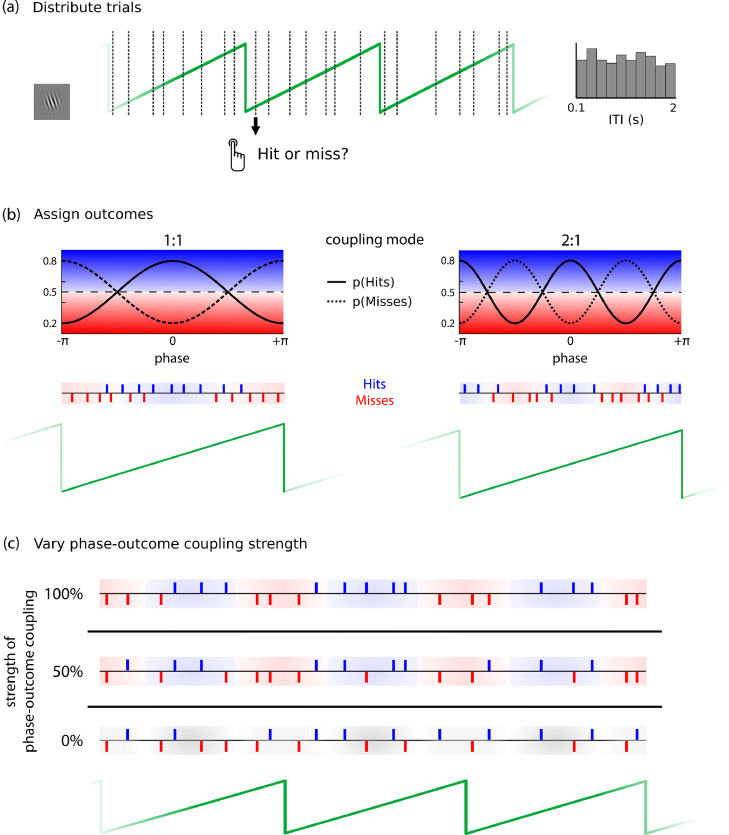
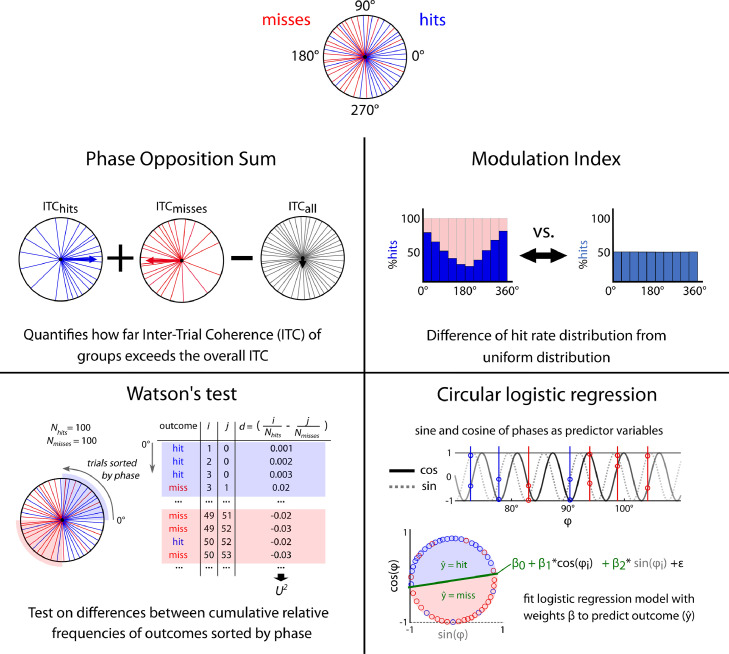
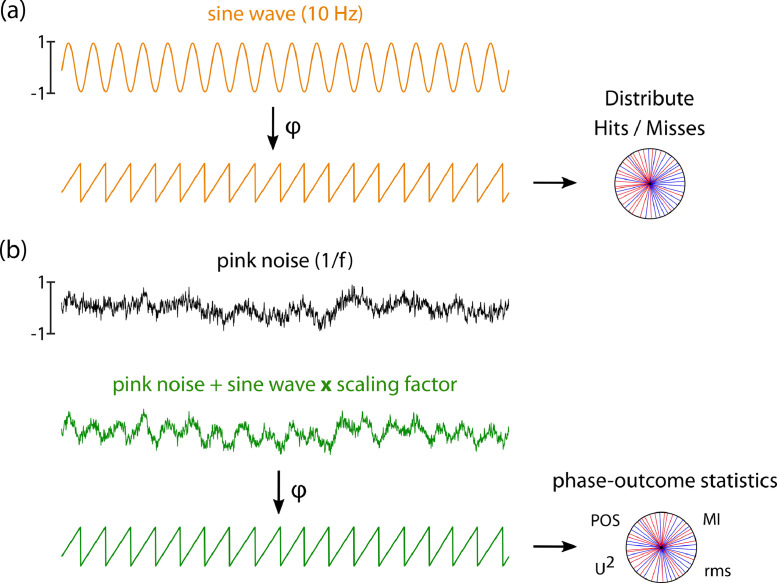
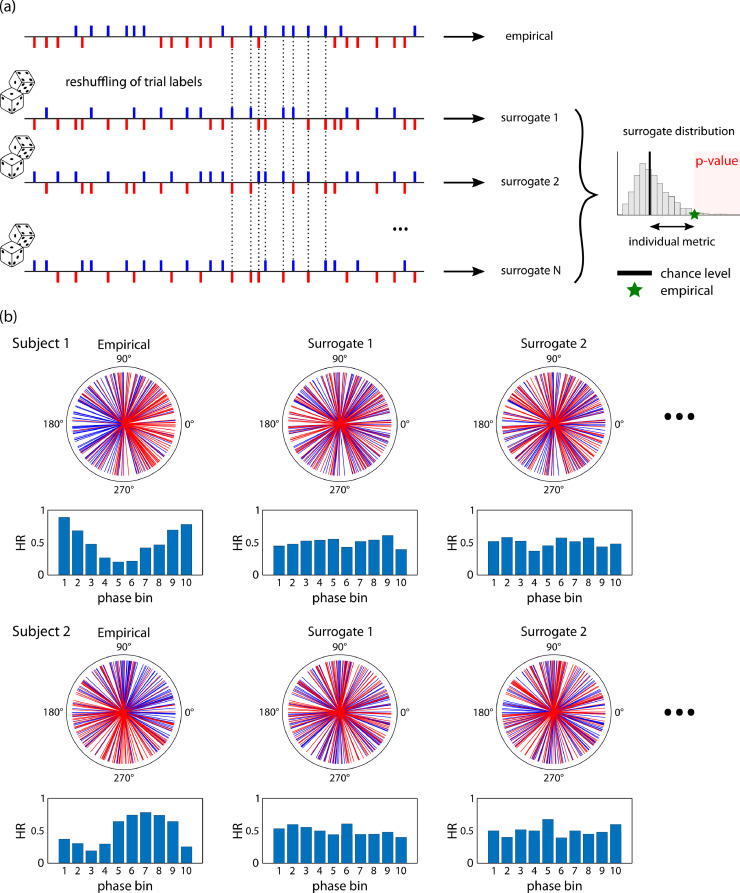
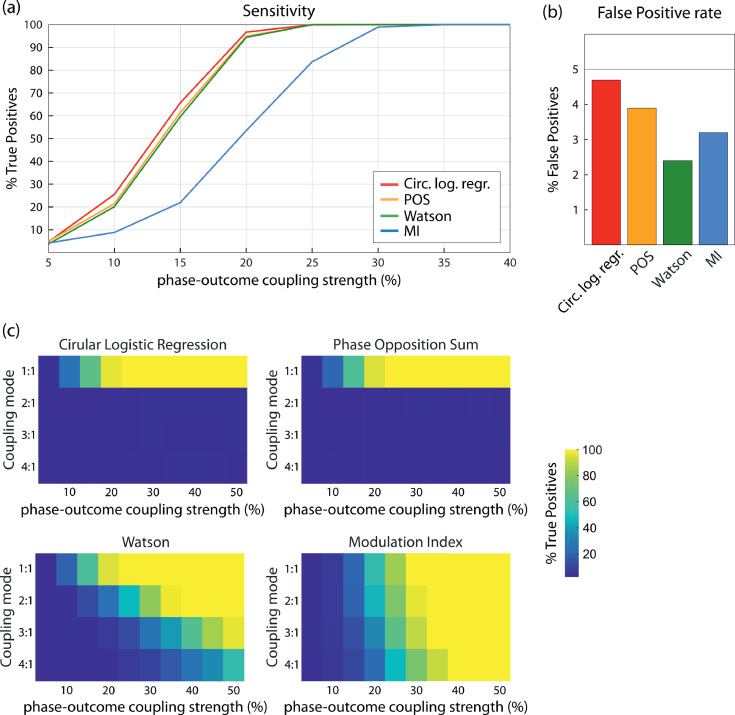
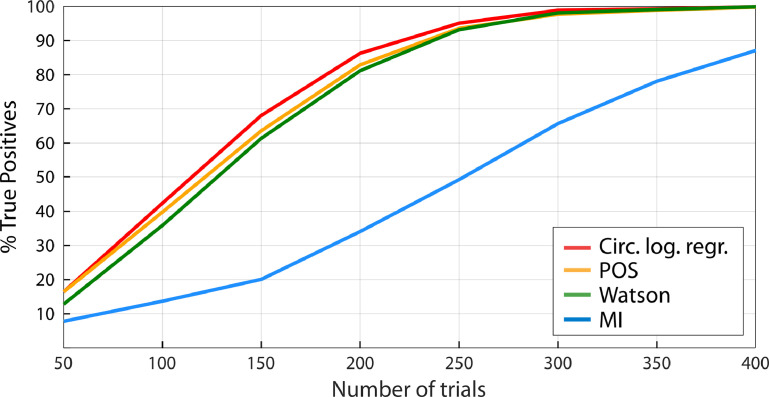
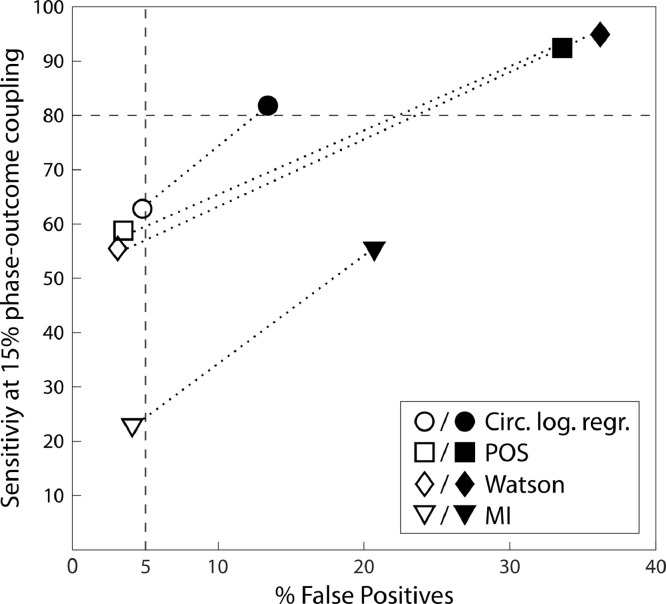
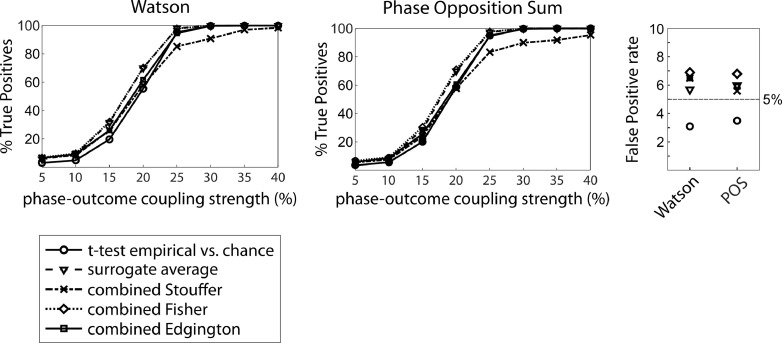
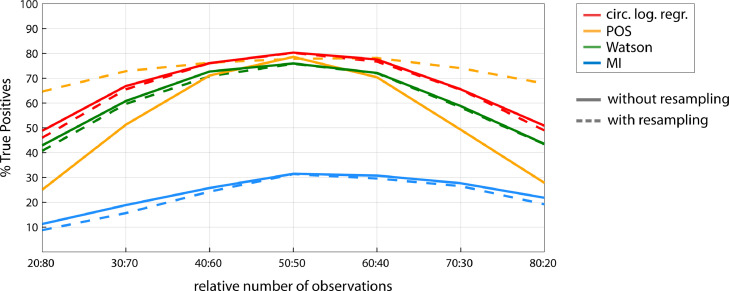
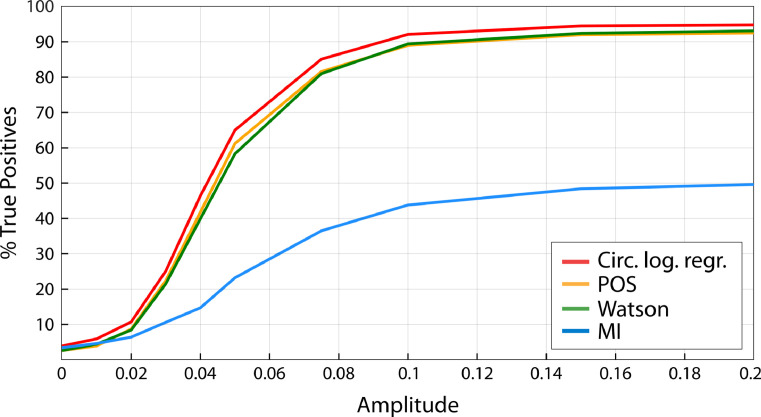
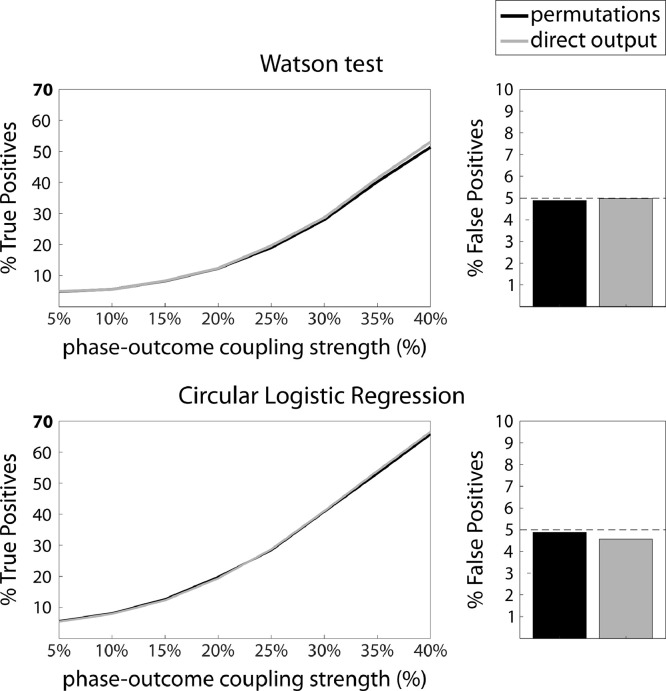
Growing experimental evidence points at relationships between the phase of a cortical or bodily oscillation and behavior, using various circular statistical tests. Here, we systematically compare the performance (sensitivity, False Positive rate) of four circular statistical tests (some commonly used, i.e. Phase Opposition Sum, Circular Logistic Regression, others less common, i.e., Watson test, Modulation Index). We created semi-artificial datasets mimicking real two-alternative forced choice experiments with 30 participants, where we imposed a link between a simulated binary behavioral outcome with the phase of a physiological oscillation. We systematically varied the strength of phase-outcome coupling, the coupling mode (1:1 to 4:1), the overall number of trials and the relative number of trials in the two outcome conditions. We evaluated different strategies to estimate phase-outcome coupling chance level, as well as significance at the individual or group level. The results show that the Watson test, although seldom used in the experimental literature, is an excellent first intention test, with a good sensitivity and low False Positive rate, some sensitivity to 2:1 coupling mode and low computational load. Modulation Index, initially designed for continuous variables but that we find useful to estimate coupling between phase and a binary outcome, should be preferred if coupling mode is higher than 2:1. Phase Opposition Sum, coupled with a resampling procedure, is the only test retaining a good sensitivity in the case of a large unbalance in the number of occurrences of the two behavioral outcomes.

Keywords: Behavior; Circular statistics; Oscillations; Phase; Rhythms; Simulations.


Conflict of interest statement

Declaration of Competing Interest The authors declare that no competing interests exist.

Figures

Fig. 1
Fig. 1
Procedure for simulating behavior. (a) In a first step, a series of “trials” was distributed with a random Inter-Trial-Interval (ITI) selected from a flat distribution between 100 and 2000 ms, mimicking button presses uniformly distributed over time (b) Next, mutually exclusive behavioral outcomes, as in two-alternative forced choice experiments (hits and misses) were determined for each trial as a function of phase. A hit was assigned with mean probability of 0.5 (dashed lines), which was modulated over a cycle of the carrier frequency by a cosine function, such that hit probability (solid lines) ranged between 0.2 and 0.8. For a 1:1 coupling mode (left), pHit contained a single peak. For a 2:1 coupling mode (right), the probability function was rescaled to contain two peaks. The probability function for misses (dotted line) was defined as 1-pHit. By design, hits and misses where therefore distributed to occur at opposite phases. Middle rows show an example of resulting occurrences of hits and misses. Of note, the phase range at which a given outcome was more likely was fixed within a participant, but could vary between participants. (c) Phase-outcome coupling strength was varied by randomly reassigning labels (hits or misses) to a proportion of behavioral outcome. Top row: time series with 100% phase-outcome coupling, no label reassignment. Middle row: time series at 50% phase-outcome coupling strength (random label reassignment in 50% of the trials). Bottom row: time series with 0% phase-outcome coupling (random label reassignment in 100% of trials). Hits and misses are distributed randomly.
Fig. 2
Fig. 2
Illustration of statistical tests compared in this paper. The aim is to assess whether hits (blue) and misses (red) are occurring at different oscillatory phases (polar circle, top). Phase Opposition Sum (VanRullen, 2016): This measure is based on the Inter-Trial Coherence (ITC), which quantifies the extent of phase concentration for a set of trials. Phase Opposition Sum combines the ITCs by subtracting the overall ITC from the separate ITC from each group. It thus becomes positive if the phases separated into hits and misses result in a higher ITC than the overall ITC. Modulation Index (Tort et al., 2010): The phase is binned into N phase bins of equal width, and the hit rate per phase bin computed, yielding a hit rate distribution. Note that the hit rate distribution is the mirror image of the miss rate distribution. If hits and misses occur at different portions of the cycle, the distribution will deviate from uniformity. MI measures the extent to which the empirical hit rate distribution deviates from a flat uniform distribution. Watson's test: Phases from hits and misses are sorted in ascending order, and for each trial, index i counts the cumulative number of hits and index j the cumulative number of misses. At each trial (row), the difference between the respective cumulative relative frequencies (i/#hits and j/#misses) is then computed. These differences are combined into a test statistic U2 (for formula see 2.3). Circular logistic regression: The sine and cosine of phases for hits and misses are used as predictors in a circular logistic regression model with coefficients β1 and β2 and the intercept term β0. To quantify the performance of the fit, a root-mean square is then computed using true outcomes and predictor coefficients.) (For interpretation of the references to color in this figure legend, the reader is referred to the web version of this article.)
Fig. 3
Fig. 3
Simulations on oscillatory amplitude. (a) A pure sine wave at 10 Hz was generated with an amplitude between −1 and 1, and hits and misses were distributed based on its instantaneous phase. (b) Background activity was simulated as pink noise with an amplitude between −1 and 1. The sine wave was multiplied with a scaling factor and added to background activity, and instantaneous phase retrieved. Phases for hits and misses based on the phase time series of this combined signal were then retrieved and the phase-outcome statistics computed for each amplitude.
Fig. 4
Fig. 4
(a) Permutation approach to estimate null distributions of no phase-outcome relationships. Top row: From the original time series of hits and misses, an empirical phase-outcome statistic is computed. The trial outcomes are then reshuffled (lower rows), with hit and miss labels randomly permuted, resulting in a new time series of hits and misses where the phase-outcome link is abolished while keeping the balance of relative number of observations and inter-stimulus intervals. This is repeated N times, and for each reshuffling, the phase-outcome statistic is computed. This results in a surrogate distribution (right). Chance level (black vertical line) is then defined as the mean of this distribution. The difference between the empirical phase-outcome statistic (green star) and chance level provides an individual metric of the strength of the phase-outcome effect. Additionally, an individual p-value can be computed as the proportion of surrogate values higher than empirical. (b) Example of empirical (left column) and surrogate (middle and right columns) phase distributions, for a phase-outcome coupling strength of 100% and 250 trials. Upper row: Polar representation, lower row: distributions of hit rate per phase bin.(For interpretation of the references to color in this figure legend, the reader is referred to the web version of this article.)
Fig. 5
Fig. 5
Sensitivity of different tests to a 1:1 coupling mode (250 trials, 50% hits & misses). (a) Detection rate of True Positives as a function of phase locking strength. Circular logistic regression, POS and Watson's test clearly outperform MI. (b) False Positive rate computed based on outcomes randomly assigned, independently of phase. Red: Circular logistic regression, yellow: POS, green: Watson's test, blue: MI. (c) Sensitivity of the four tests as function of phase-outcome coupling strength and coupling mode. Color codes represent the percentage of True Positives. (For interpretation of the references to color in this figure legend, the reader is referred to the web version of this article.)
Fig. 6
Fig. 6
Sensitivity by number of trials (1:1 coupling mode, 50% hits & misses). Phase-outcome coupling strength is kept constant at 20%, and the number of trials (hits & misses) is gradually increased. Sensitivity increases with number of trials. Circular logistic regression, POS and Watson outperform MI.
Fig. 7
Fig. 7
False Positive rate at 0% phase-outcome coupling strength and sensitivity at 15% phase-outcome coupling strength (1:1 coupling mode, 300 trials, 50% hits & misses), when estimating chance level as the mean (open symbols) vs. the median (filled symbols) of surrogate distributions. Estimating chance level as the median of surrogate distributions increases sensitivity but also False Positive rate for all tests, especially for POS and the Watson test. False Positive rate remains below 5% for all tests when chance level is estimated as the mean of surrogate distributions.
Fig. 8
Fig. 8
Comparison of sensitivity and False Positive rate for the four different methods to test for significance at the group-level, with the examples of the Watson test and POS and for a 1:1 coupling mode (250 trials, 50% hits & misses). Circles: t-test on empirical vs. chance; triangles: surrogate average; stars: p-value combination using the Stouffer method; diamonds: p-value combination using the Fisher-method; squares: p-value combination using Edgington's method. Left and middle panel: Sensitivity; right panel: False Positive rate. Most methods perform very similarly, although the p-value combination using Stouffer's method performs comparably poorly for high strength of phase-outcome coupling, which was consistent across statistical tests. Using the paired t-test on empirical vs. chance resulted in the lowest False Positive rate for all the tests.
Fig. 9
Fig. 9
Sensitivity of the different phase-outcome tests as a function of the relative number of observations for hits vs. misses (1:1 coupling mode, 300 trials, 15% phase-outcome coupling strength). Solid lines: without resampling; dotted lines: with resampling.
Fig. 10
Fig. 10
Sensitivity of the different phase-outcome tests as a function of the amplitude of the 10 Hz oscillation relative to pink noise (1:1 coupling mode, 250 trials, 20% phase-outcome coupling strength).
Fig. 11
Fig. 11
Computing p-value based on permutations or on the direct output of the statistical test, for the Watson test and circular logistic regression, all for a 1:1 coupling mode (250 trials, 50% hits & misses). Left: Sensitivity (%True Positives), right: False Positive rate. Black: Permutation approach; gray: direct output. Both the Watson test and circular logistic regression are equally sensitive with either approach.

Similar articles

Cited by

References

    1. Ai L., Ro T. The phase of prestimulus alpha oscillations affects tactile perception. J. Neurophysiol. 2013;111:1300–1307. doi: 10.1152/jn.00125.2013. - DOI - PubMed
    1. Al-Daffaie K., Khan S. Logistic regression for circular data. AIP Conf. Proc. 2017;1842 doi: 10.1063/1.4982860. - DOI
    1. Alves G., Yu Y.-.K. Accuracy evaluation of the unified P-value from combining correlated P-values. PLoS ONE. 2014;9:e91225. doi: 10.1371/journal.pone.0091225. - DOI - PMC - PubMed
    1. Azzalini D., Rebollo I., Tallon-Baudry C. Visceral signals shape brain dynamics and cognition. Trends Cogn. Sci. 2019;23:488–509. doi: 10.1016/j.tics.2019.03.007. - DOI - PubMed
    1. Bahramisharif A., Gerven M.A.J.van, Aarnoutse E.J., Mercier M.R., Schwartz T.H., Foxe J.J., Ramsey N.F., Jensen O. Propagating neocortical gamma bursts are coordinated by traveling alpha waves. J. Neurosci. 2013;33:18849–18854. doi: 10.1523/JNEUROSCI.2455-13.2013. - DOI - PMC - PubMed

Publication types