. 2021 Jul:71:102026.
doi: 10.1016/j.media.2021.102026. Epub 2021 Mar 4.

A structural enriched functional network: An application to predict brain cognitive performance

Affiliations

A structural enriched functional network: An application to predict brain cognitive performance

Mansu Kim et al. Med Image Anal. 2021 Jul.

Abstract

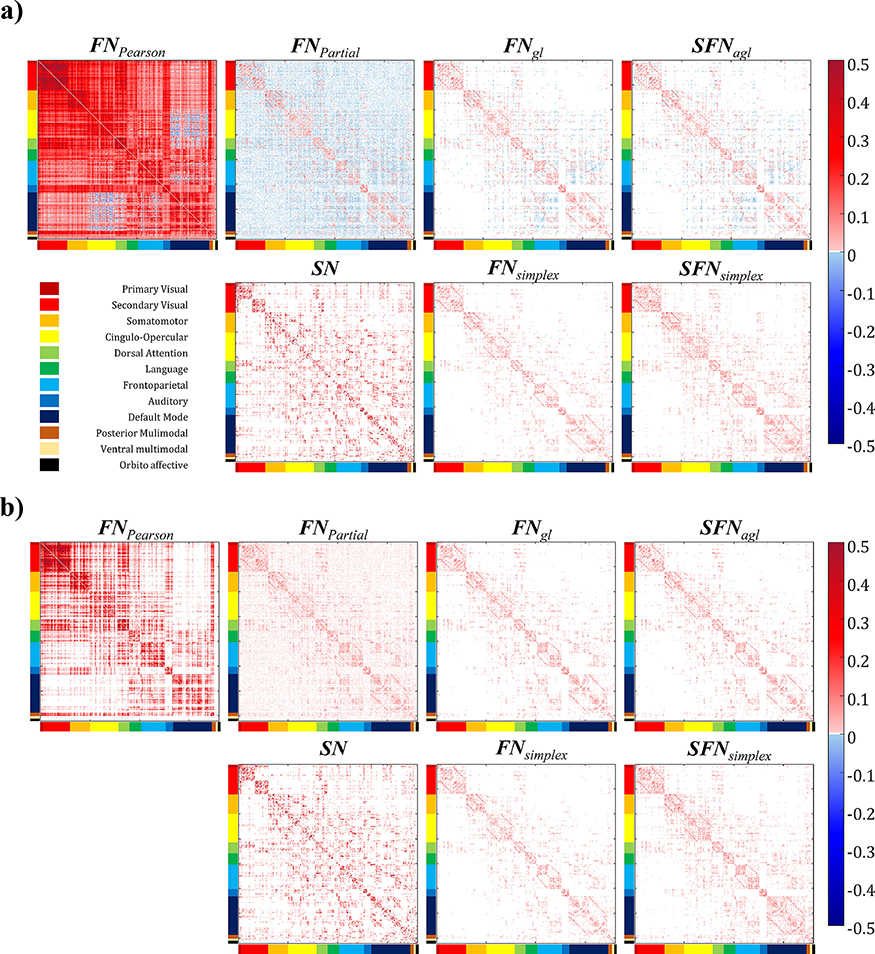
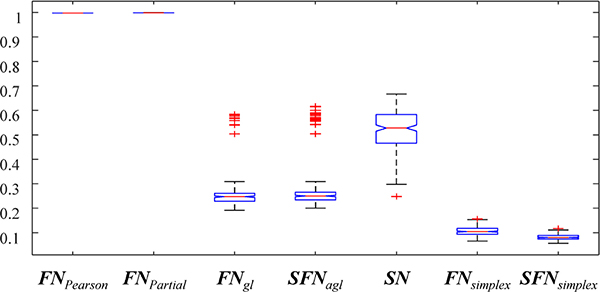
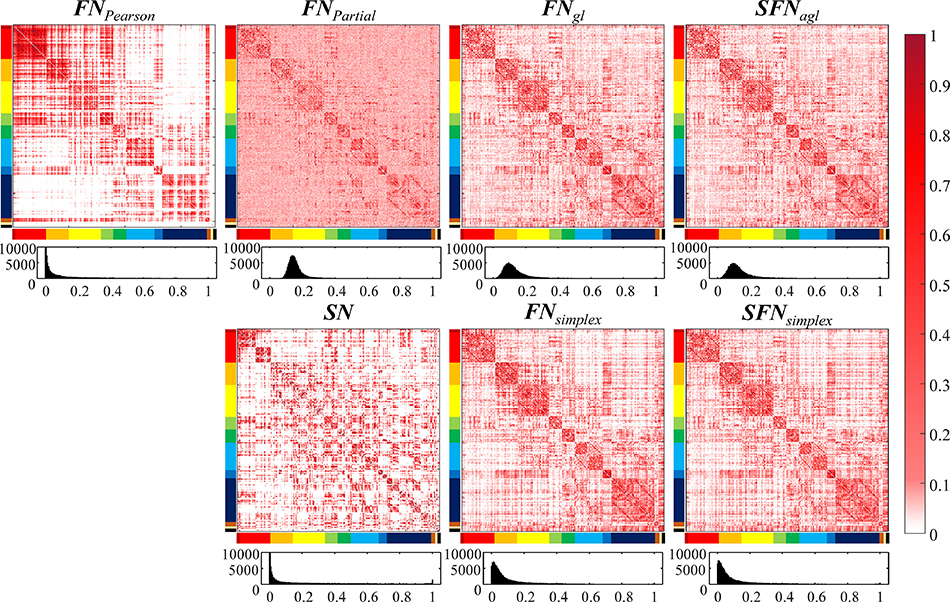
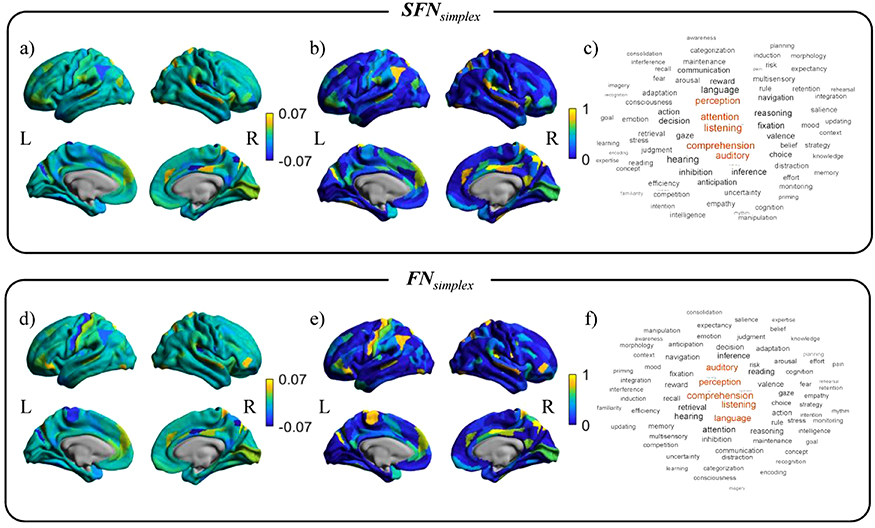
The structure-function coupling in brain networks has emerged as an important research topic in modern neuroscience. The structural network could provide the backbone of the functional network. The integration of the functional network with structural information can help us better understand functional communication in the brain. This paper proposed a method to accurately estimate the brain functional network enriched by the structural network from diffusion magnetic resonance imaging. First, we adopted a simplex regression model with graph-constrained Elastic Net to construct the functional networks enriched by the structural network. Then, we compared the constructed network characteristics of this approach with several state-of-the-art competing functional network models. Furthermore, we evaluated whether the structural enriched functional network model improves the performance for predicting the cognitive-behavioral outcomes. The experiments have been performed on 218 participants from the Human Connectome Project database. The results demonstrated that our network model improves network consistency and its predictive performance compared with several state-of-the-art competing functional network models.

Keywords: Functional network; Graph-constrained elastic net; Simplex regression; Structure-function coupling.


Conflict of interest statement

Declaration of Competing Interest All Authors declare that we have no conflicts of interest.

Figures

Figure 1.
Figure 1.. Visualizing the average network pattern across subjects.
Sub-figures (a) and (b) visualized the average network pattern before thresholding and after thresholding, respectively. The brain regions were ordered according to the Cole-Anticevic Brain-side Network (Ji et al., 2019).
Figure 2.
Figure 2.. Boxplots of density values for seven different brain network approaches.
Boxplots of density values for seven different brain network approaches.
Figure 3.
Figure 3.. The comparison of proportion of common connection (POC) for seven different approaches for building the networks.
The POC was computed after thresholding the networks. Each subfigure has two rows, where the first row visualized the heatmap of the POC, and the second row visualized the histogram of the POC. The histogram distribution following the power law denoted lower inter-subject variability.
Figure 4.
Figure 4.. The activation pattern maps and the related cognitive topics for predicting WM-2bk-acc score.
Top row: the mean standardized regression coefficients from the prediction model and their decoding results using SFNsimplex. Bottom row: the mean standardized regression coefficients from the prediction model and their decoding results using FNsimplex. For each sub-figure, left column: mean standardized regression coefficients map. Center column: selection probability map. Right column: word clouds plot related to cognitive function in the Neurosynth database.
Figure 5.
Figure 5.. The activation pattern maps and the related cognitive topics for predicting the gF score.
Top row: the mean standardized regression coefficients from the prediction model and their decoding results using SFNsimplex. Bottom row: the mean standardized regression coefficients from the prediction model and their decoding results using FNsimplex. For each sub-figure, left column: mean standardized regression coefficients map. Center column: selection probability map. Right column: word clouds plot related to cognitive function in the Neurosynth database.

References

    1. Andersson JLR, Xu J, Yacoub E, Auerbach E, Moeller S, Ugurbil K, 2012. A comprehensive Gaussian process framework for correcting distortions and movements in diffusion images, in: Proceedings of the 20th Annual Meeting of ISMRM. p. 2426.
    1. Baddeley A, 2003. Working memory: looking back and looking forward. Nat. Rev. Neurosci 4, 829–839. - PubMed
    1. Batista-Garc\’\ia-Ramó K, Fernández-Verdecia CI, 2018. What we know about the brain structure--function relationship. Behav. Sci. (Basel) 8, 39. - PMC - PubMed
    1. Baum GL, Cui Z, Roalf DR, Ciric R, Betzel RF, Larsen B, Cieslak M, Cook PA, Xia CH, Moore TM, others, 2020. Development of structure--function coupling in human brain networks during youth. Proc. Natl. Acad. Sci 117, 771–778. - PMC - PubMed
    1. Beaty RE, Kenett YN, Christensen AP, Rosenberg MD, Benedek M, Chen Q, Fink A, Qiu J, Kwapil TR, Kane MJ, others, 2018. Robust prediction of individual creative ability from brain functional connectivity. Proc. Natl. Acad. Sci 115, 1087–1092. - PMC - PubMed

Publication types