. 2021 May 7;49(8):4564-4573.
doi: 10.1093/nar/gkab079.

Nanomechanics of G-quadruplexes within the promoter of the KIT oncogene

Affiliations

Nanomechanics of G-quadruplexes within the promoter of the KIT oncogene

Enrico Buglione et al. Nucleic Acids Res. .

Abstract

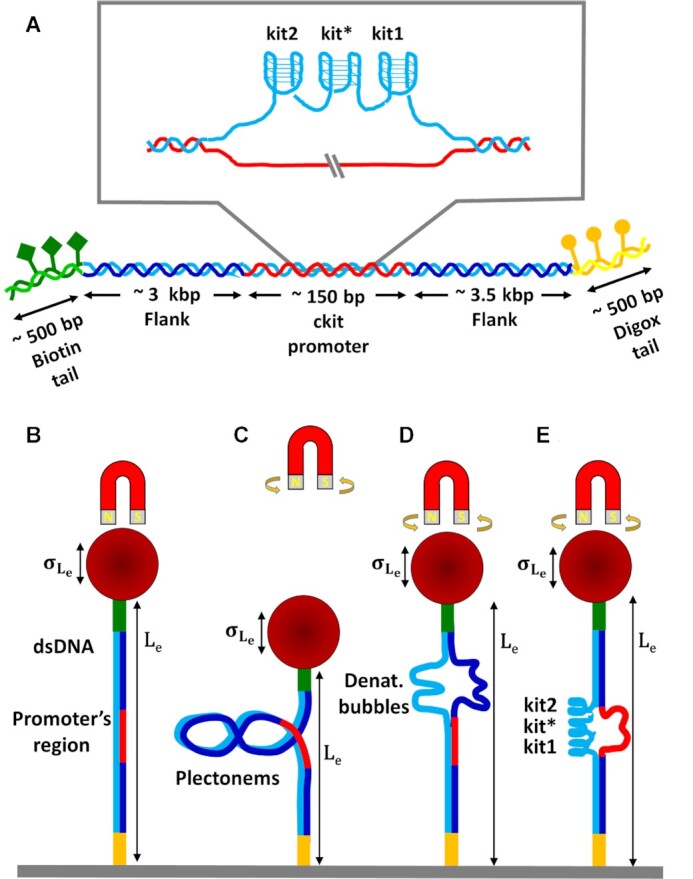
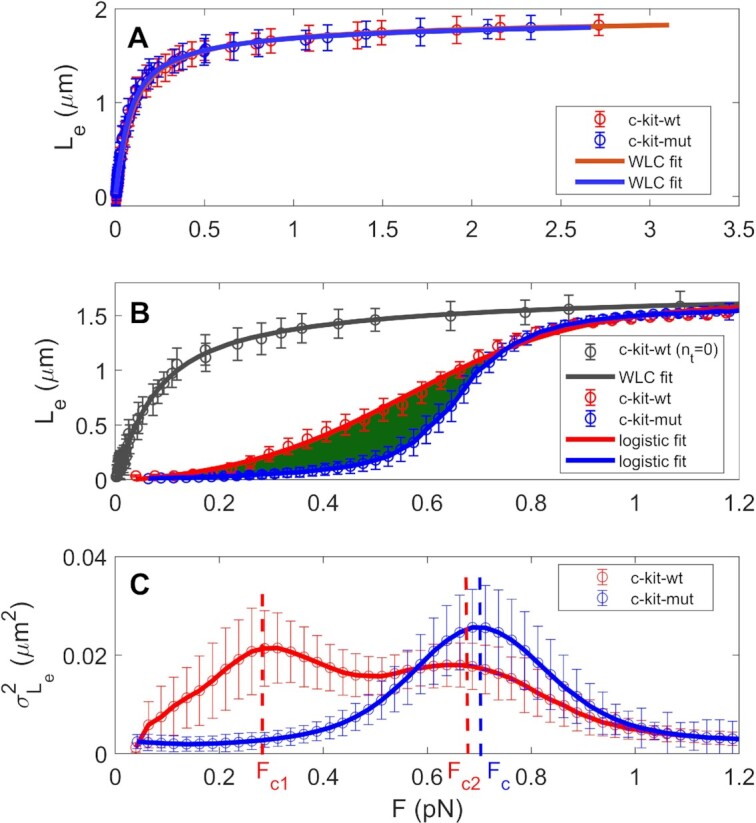
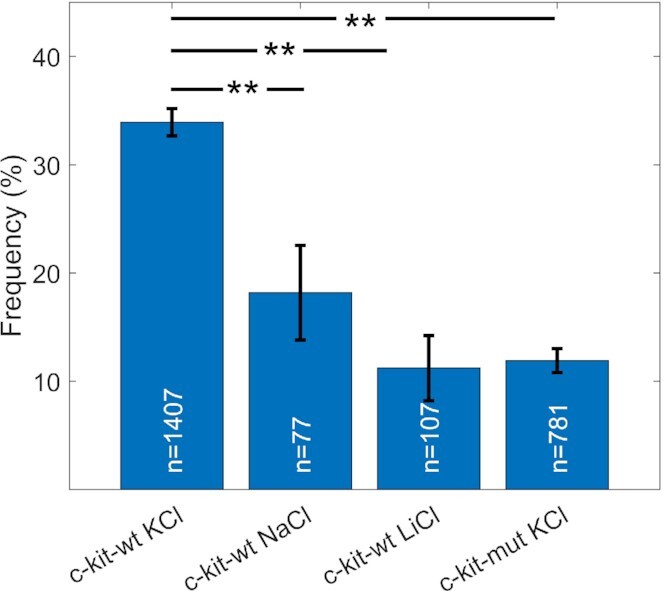
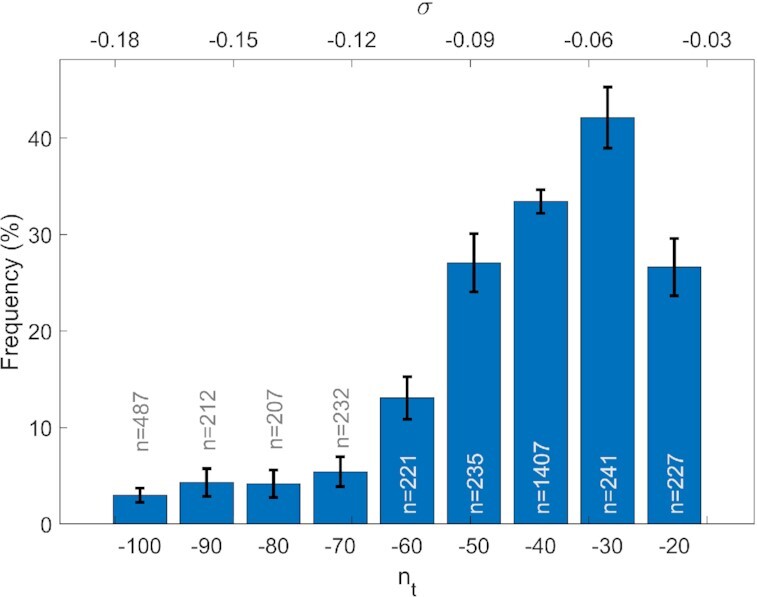
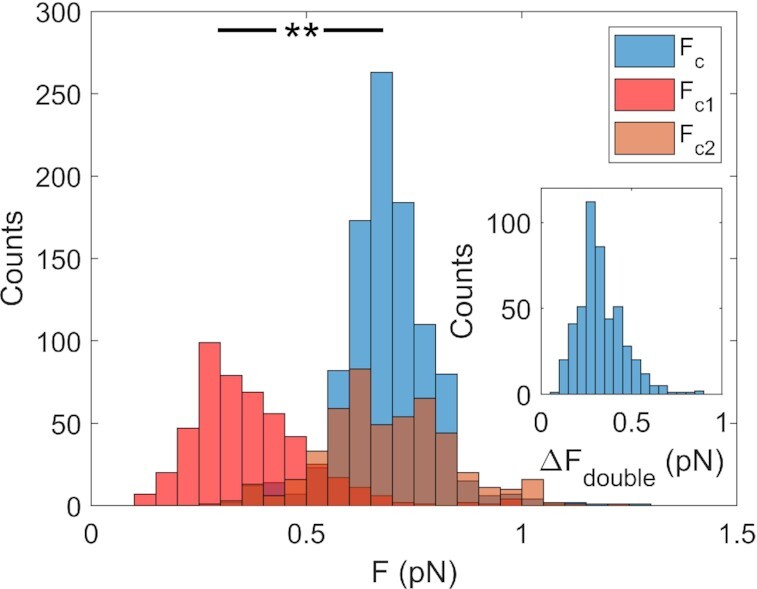
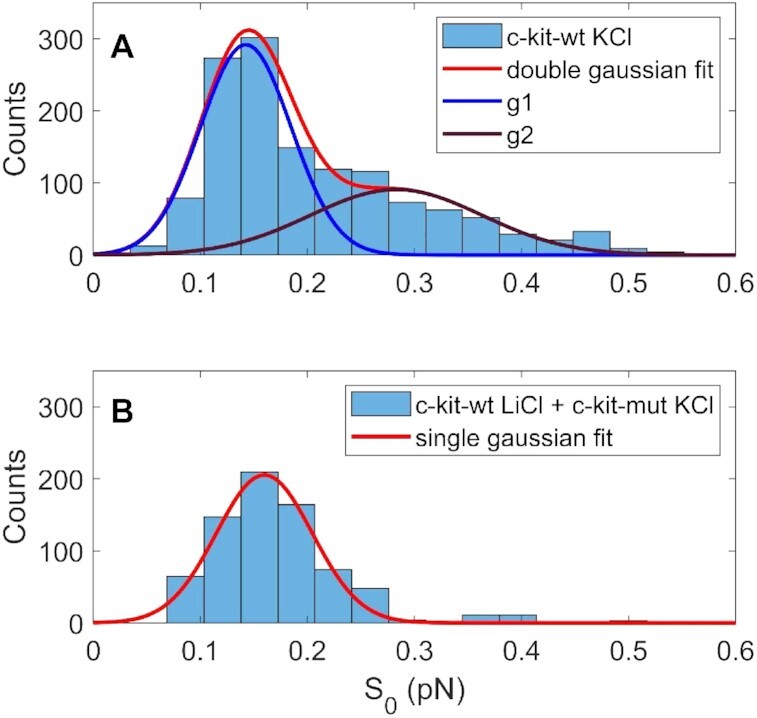
G-quadruplexes (G4s) are tetrahelical DNA structures stabilized by four guanines paired via Hoogsteen hydrogen bonds into quartets. While their presence within eukaryotic DNA is known to play a key role in regulatory processes, their functional mechanisms are still under investigation. In the present work, we analysed the nanomechanical properties of three G4s present within the promoter of the KIT proto-oncogene from a single-molecule point of view through the use of magnetic tweezers (MTs). The study of DNA extension fluctuations under negative supercoiling allowed us to identify a characteristic fingerprint of G4 folding. We further analysed the energetic contribution of G4 to the double-strand denaturation process in the presence of negative supercoiling, and we observed a reduction in the energy required for strands separation.


Figures

Figure 1.
Figure 1.
Simplified sketches of the investigated c-kit-wt construct and the MTs experiment strategy. (A) In the central core fragment (red and light blue filaments) containing the human KIT proximal promoter, three distinct G4s are embedded: kit2, kit* and kit1. This core fragment was flanked by two ∼3 kb flanking regions (dark and light blue filaments), which were enclosed by 5′ biotin- and 3′ digoxigenin-modified tails (green diamonds and yellow circles, respectively) to bind streptavidin-coated beads and an anti-digoxigenin functionalized microfluidic cell, respectively. (BE) A para-magnetic bead (red sphere) is connected via dsDNA to the inner part of a microfluidic cell (grey stripe). By rotating the magnets, torque is applied to the DNA. By raising the magnets, the force applied to the DNA through the bead decreases, since the magnetic field decreases with the distance. In this condition, the formation of plectonemes instead of denaturation bubbles is favoured and the extension is reduced. In different states of torsion and force, the initial (B) DNA extension (Le) and its standard deviation (formula image) are modified as a consequence of plectonemes formation (C), the presence of denaturation bubbles (D) and G4 folding (E).
Figure 2.
Figure 2.
MTs-based nanomechanical characterization of the c-kit-wt (red) and c-kit-mut (blue) constructs at zero or negative supercoiling in 150 mM KCl. (A) Average force extension curves at nt = 0, the standard deviations corresponding to every measurement are also reported. The continuous lines represent the best fit of the data to the WLC model (resulting free parameters: L0 = 2.0 ± 0.12 μm, LP = 46 ± 4 nm for c-kit-wt and L0 = 1.97 ± 0.14 μm, LP = 51 ± 5 nm for c-kit-mut). (B) Average force extension curves at nt = –40. The error bars represent the standard deviations measured in hundreds of different force–extension curves. The continuous blue and red lines represent a fit to the logistic curve (Equation 1) of the data with fitting parameter values of S0 = 0.52 for c-kit-wt and S0 = 0.64 for c-kit-mut. The green area between the two curves corresponds to the energy difference between the two extension paths. (Cformula image variance of DNA extension measured as a function of the applied force (F) for a representative force extension curve at nt = –40. The vertical dashed lines indicate the maximum value of formula image and the corresponding characteristic forces (FC in the case of a single peak or FC1 and FC2 in the case of a double peak.
Figure 3.
Figure 3.
Percentage of double peaks in the formula image versus F curves obtained at nt = −40 under different buffer conditions with two constructs: c-kit-wt in 150 mM KCl, 150 mM NaCl and 150 mM LiCl (first three columns); and c-kit-mut in 150 mM KCl (last column). The numbers (n) on the histogram bars indicate the total number of measurements acquired under the specific conditions. The error bars represent the corresponding standard deviations calculated assuming pure stochastic behaviour and considering the column height as the expected value and n as the sample size. The statistical analysis was performed with the ANOVA test. ** P< 0.001.
Figure 4.
Figure 4.
Percentage of double peaks in the fluctuations of DNA extension as a function of the imposed turns nt (lower axes) or supercoiling density σ (upper axes). Data acquired for c-kit-wt in 150 mM KCl buffer. For each nt, the reported percentage was calculated for a number (n) of measurements, as indicated by the labels on the histogram columns. The error bars represent the corresponding standard deviations, calculated assuming purely stochastic behaviour and considering the column height as the expected value and n as the sample size.
Figure 5.
Figure 5.
Characteristic force analysis. Statistical distribution of the measured values of the characteristic forces (FC, FC1, FC2) for c-kit-wt in 150 mM KCl. Single-peak characteristic force (FC) is indicated in blue, double peak characteristic forces in red (FC1) and orange (FC2). Data taken for nt = –40, i.e. for supercoiling density σ = –0.070. Inset: statistical distribution of the force difference, ΔFdouble = FC1FC2. The statistical analysis was performed with the T test. ** P< 0.001.
Figure 6.
Figure 6.
Statistical distribution of the steepness parameter (S0) derived from the fitting of the Le versus F curves with the logistic function (Equation 1). Data acquired nt = –40 for c-kit-wt in KCl (A) and for c-kit-wt in LiCl and c-kit-mut in KCl (B). The continuous lines represent the fit of the reported data to a single Gaussian (red line in panel (B)) or to a double Gaussian (red line of panel (A) resulting from the sum of the single Gaussians described by the blue (g1) and purple (g2) curves). The Wilcoxon test shows P< 0.001, confirming the significant difference between the two distributions described in panels (A) and (B).

Similar articles

Cited by

References

    1. Bochman M., Paeschke K., Zakian V.. DNA secondary structures: stability and function of G-quadruplex structures. Nat. Rev. Genet. 2012; 13:770–780. - PMC - PubMed
    1. Lightfoot H.L., Hagen T., Tatum N.J., Hall J.. The diverse structural landscape of quadruplexes. FEBS Lett. 2019; 593:2083–2102. - PubMed
    1. Rhodes D., Lipps H.J.. G-quadruplexes and their regulatory roles in biology. Nucleic Acids Res. 2015; 43:8627–8637. - PMC - PubMed
    1. Zhang X., Zhang Y., Zhang W.. Dynamic topology of double-stranded telomeric DNA studied by single-molecule manipulation in vitro. Nucleic Acids Res. 2020; 48:6458–6470. - PMC - PubMed
    1. Maizels N., Gray L.T.. The G4 genome. PLos Genet. 2013; 9:e1003468. - PMC - PubMed

Publication types

LinkOut - more resources