. 2021 May 7;49(8):4308-4324.
doi: 10.1093/nar/gkab224.

Genome-wide characterization of human minisatellite VNTRs: population-specific alleles and gene expression differences

Affiliations

Genome-wide characterization of human minisatellite VNTRs: population-specific alleles and gene expression differences

Marzieh Eslami Rasekh et al. Nucleic Acids Res. .

Abstract

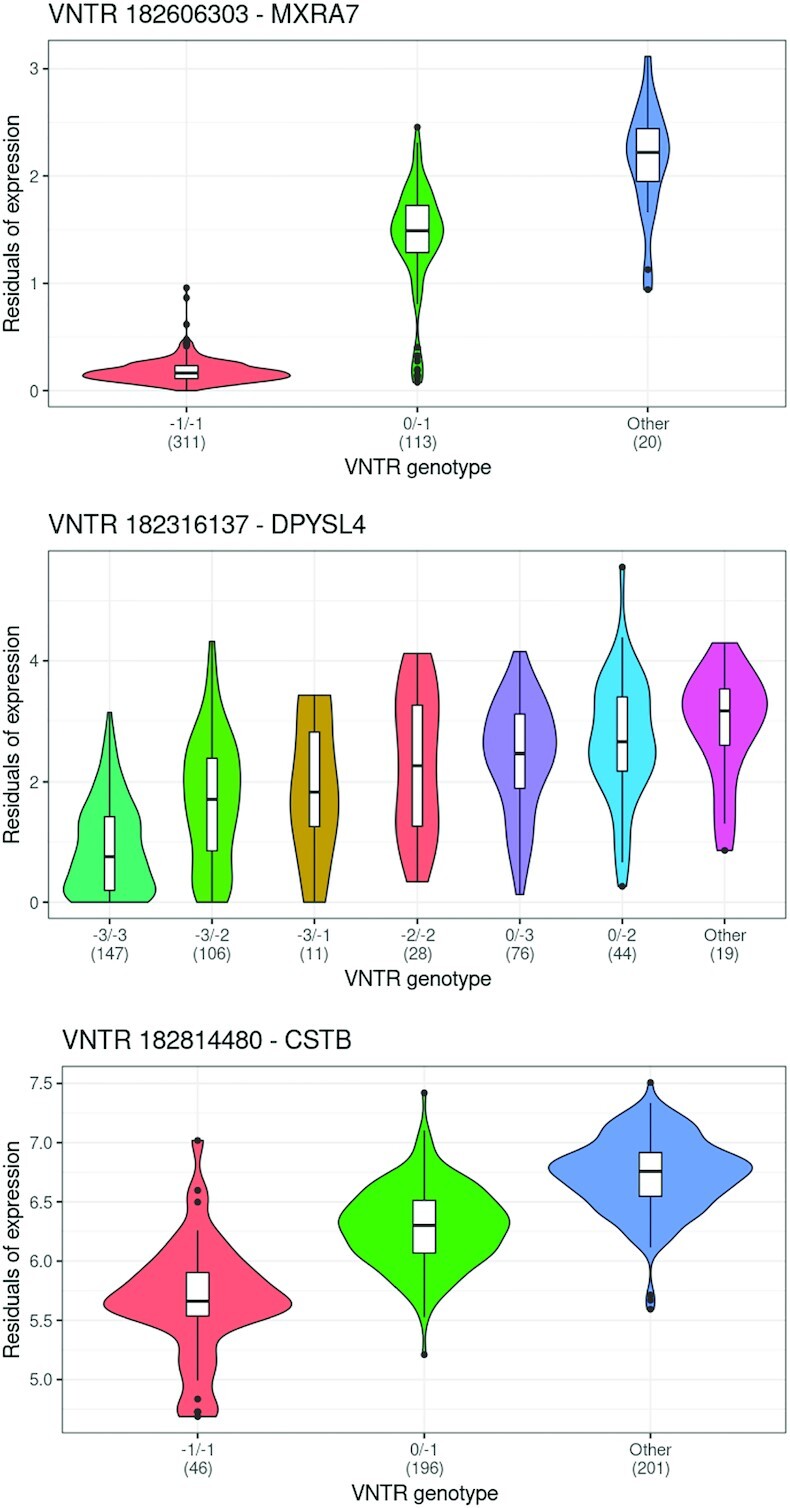
Variable Number Tandem Repeats (VNTRs) are tandem repeat (TR) loci that vary in copy number across a population. Using our program, VNTRseek, we analyzed human whole genome sequencing datasets from 2770 individuals in order to detect minisatellite VNTRs, i.e., those with pattern sizes ≥7 bp. We detected 35 638 VNTR loci and classified 5676 as commonly polymorphic (i.e. with non-reference alleles occurring in >5% of the population). Commonly polymorphic VNTR loci were found to be enriched in genomic regions with regulatory function, i.e. transcription start sites and enhancers. Investigation of the commonly polymorphic VNTRs in the context of population ancestry revealed that 1096 loci contained population-specific alleles and that those could be used to classify individuals into super-populations with near-perfect accuracy. Search for quantitative trait loci (eQTLs), among the VNTRs proximal to genes, indicated that in 187 genes expression differences correlated with VNTR genotype. We validated our predictions in several ways, including experimentally, through the identification of predicted alleles in long reads, and by comparisons showing consistency between sequencing platforms. This study is the most comprehensive analysis of minisatellite VNTRs in the human population to date.


Figures

Figure 1.
Figure 1.
(A) TR Genotyping sensitivity. Graph shows the relationship between coverage, read length, and the percentage of TRs in the reference set that were genotyped. Each symbol represents a single sample and specific samples are labeled. Increasing read length had the largest effect on sensitivity because many reference TR alleles could not be detected at the shorter read lengths (see Supplementary Table S1). (B) VNTRs detected. Graph shows the relationship between coverage, read length, and the number of VNTR loci detected. Read length and coverage both had large effects. Coloring of symbols shows that population also had a strong effect, reflecting distance from the reference, which is primarily European. Note the reduced numbers for CHM1 (150 bp) and CHM13 (250 bp). Because they are ‘haploid’ genomes, parental heterozygous loci with one reference allele would appear to be VNTRs, on average, only about half the time. (C) Alleles detected per locus. Each bar represents a specific number of alleles detected across all datasets. Coloring shows that proportion of loci where the reference allele was or was not observed. (D) Copies gained or lost. Each bar represents a specific number of copies gained or lost in non-reference VNTR alleles relative to the reference allele. Loss was always more frequently encountered. (E) VNTR locus sample support. Data shown are the common loci from the 2504 sample NYGC dataset. Each bar represents the number of samples calling a locus as a VNTR. Bin size is 100. Bar height is number of loci with that sample support. Red line indicates the 5% cutoff for common loci (126 samples).
Figure 2.
Figure 2.
Gene expression differences and VNTR genotype. Shown are violin plots of gene expression values (log2 normalized TPM) for three genes which displayed significant differential expression when samples were partitioned by VNTR allele genotype. Additional examples are shown in Supplementary Figures S26–S30. Genotype is indicated in labels on the X-axis and numbers refer to copies gained or lost relative to the reference allele. ‘Other’ indicates a partition with undetected alleles presumed outside the range of VNTRseek detection (see text). Number of samples in each partition is shown in parenthesis. In these examples, the effect size for at least one genotype class was significant. Top: VNTR 182606303 is upstream of MXRA7 and partially overlaps the 5’ UTR exon. Middle: VNTR 182316137 occurs inside the first intron of DPYSL4. Bottom: VNTR 182814480 occurs upstream of CSTB.
Figure 3.
Figure 3.
Principal Component Analysis (PCA) of common VNTR alleles in the NYGC population (150 bp). PCA was performed to reduce the dimensions of the data. Left: PC1 captured ∼5% of the variation and separated Africans from the other super-populations, suggesting that they had the greatest distance from the others. PC2 separated East Asian and European populations but left individuals from the Americas and South Asia mixed. Right: PC4 separated the South Asian population and PC5 separated the American populations. PC3 (not shown) captured batch effects due to differences in coverage. Some American sub-populations proved hardest to separate, likely due to ancestry mixing.
Figure 4.
Figure 4.
‘Virtual gel’ representation of seven population-specific VNTR alleles. Each dot represents an allele in one sample. Samples are separated vertically by super-population. Dots are jiggered in a rectangular area to reduce overlap. Population-specific alleles show up as bands over-represented in one population. Numbers and labels at bottom are VNTR locus ids with nearby genes indicated and the population-specific allele expressed as copy number change (+1, −2, etc.) from the reference. For example, in the leftmost column, the +1 allele was over-represented in the African population. Note that the allele bias towards pattern copy loss relative to the reference allele is apparent and that at one locus (second from left) the reference allele was the population-specific allele since almost no reference alleles were observed in the four other populations. The details of these seven loci are given in Supplementary Table S11.

Similar articles

Cited by

References

    1. Treangen T.J., Salzberg S.L.. Repetitive DNA and next-generation sequencing: computational challenges and solutions. Nat. Rev. Genet. 2012; 13:36. - PMC - PubMed
    1. de Koning A.J., Gu W., Castoe T.A., Batzer M.A., Pollock D.D.. Repetitive elements may comprise over two-thirds of the human genome. PLoS Genet. 2011; 7:e1002384. - PMC - PubMed
    1. Lim K.G., Kwoh C.K., Hsu L.Y., Wirawan A.. Review of tandem repeat search tools: a systematic approach to evaluating algorithmic performance. Brief. Bioinform. 2013; 14:67–81. - PubMed
    1. Richard G.-F., Kerrest A., Dujon B.. Comparative genomics and molecular dynamics of DNA repeats in eukaryotes. Microbiol. Mol. Biol. R. 2008; 72:686–727. - PMC - PubMed
    1. Taylor J.S., Breden F.. Slipped-strand mispairing at noncontiguous repeats in Poecilia reticulata: a model for minisatellite birth. Genetics. 2000; 155:1313–1320. - PMC - PubMed

Publication types

LinkOut - more resources