. 2021 May 7;49(8):4421-4440.
doi: 10.1093/nar/gkab209.

Bimodal regulation of the PRC2 complex by USP7 underlies tumorigenesis

Affiliations

Bimodal regulation of the PRC2 complex by USP7 underlies tumorigenesis

Dongxue Su et al. Nucleic Acids Res. .

Abstract

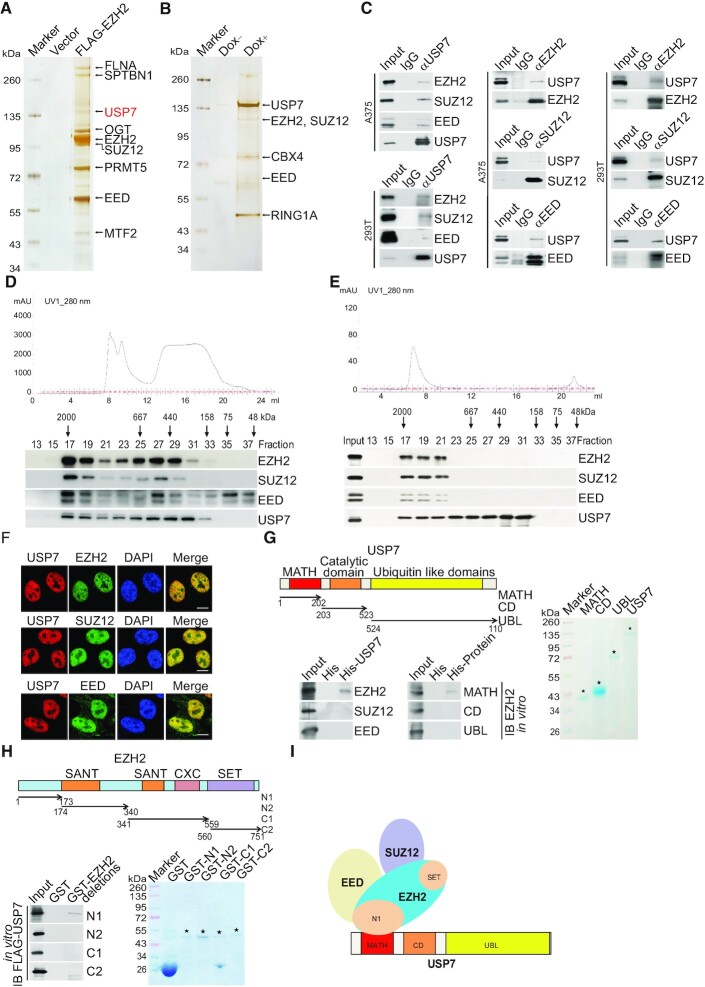
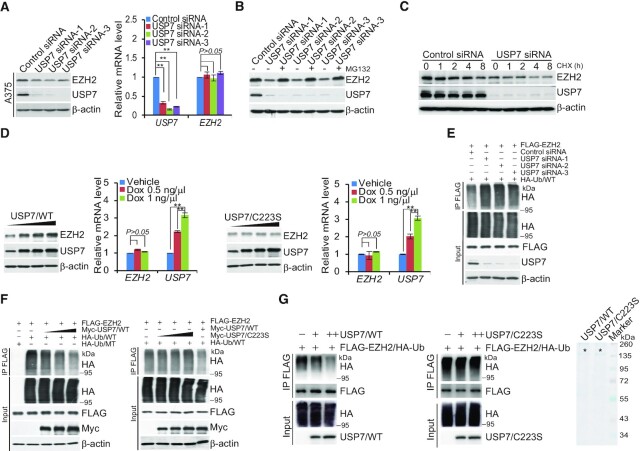
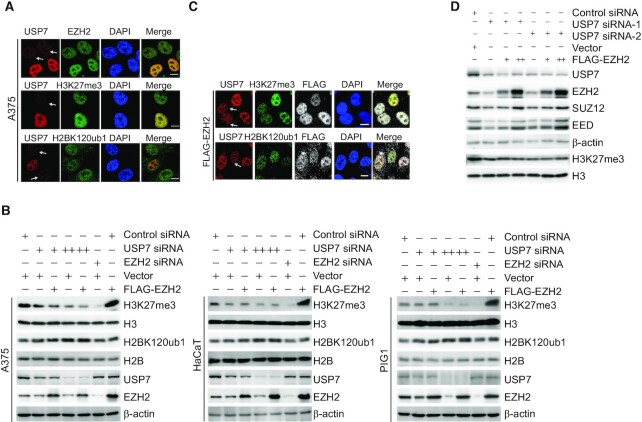
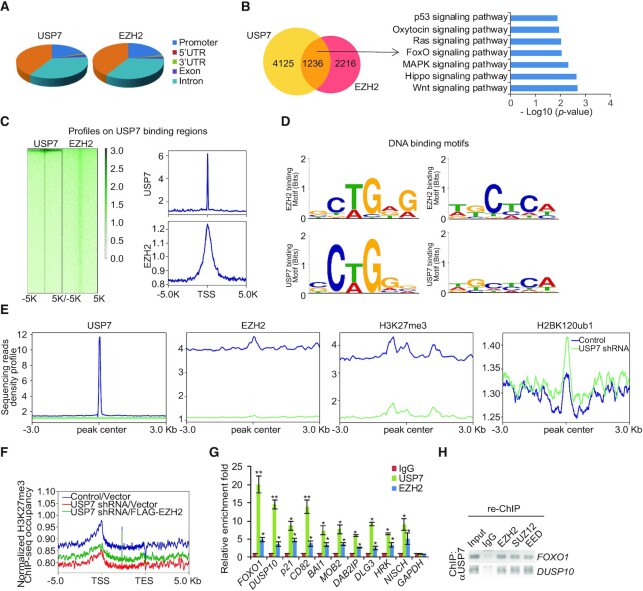
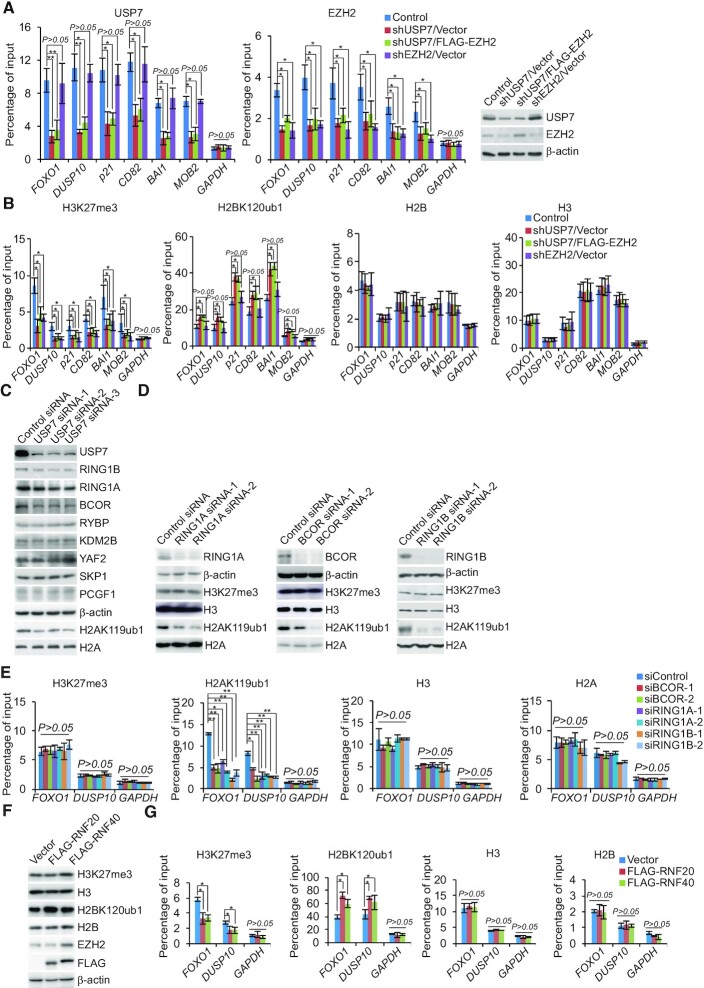
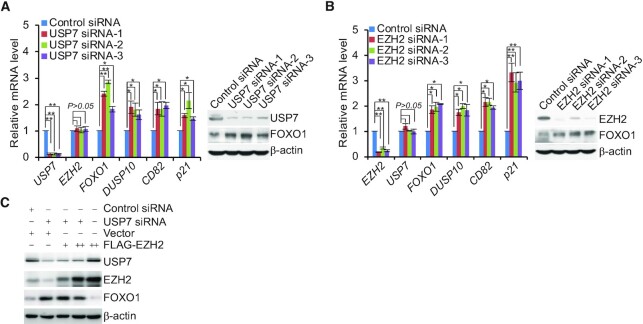
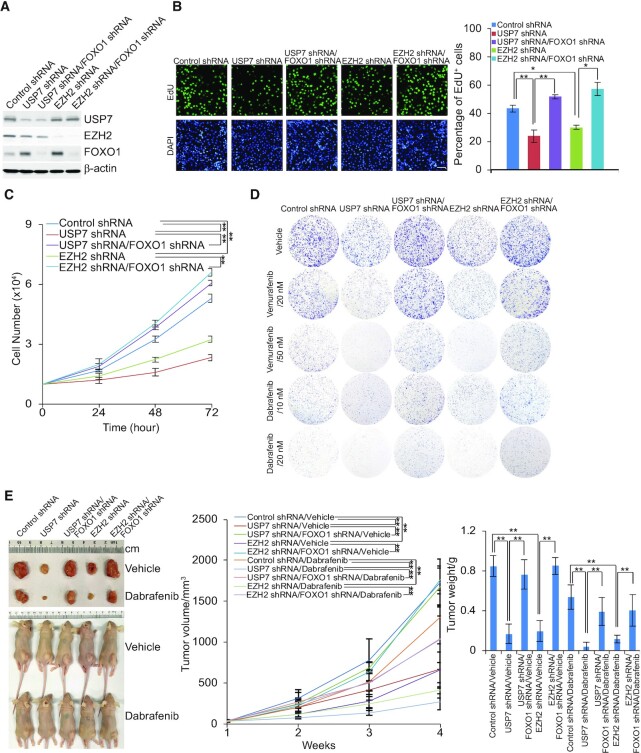
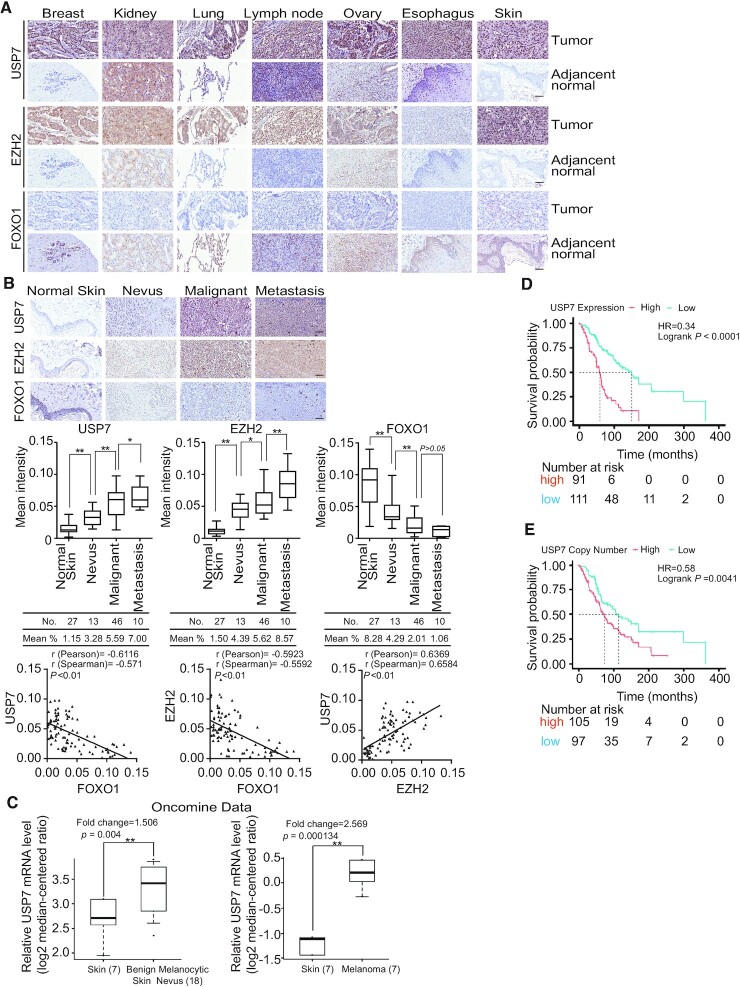
Although overexpression of EZH2, a catalytic subunit of the polycomb repressive complex 2 (PRC2), is an eminent feature of various cancers, the regulation of its abundance and function remains insufficiently understood. We report here that the PRC2 complex is physically associated with ubiquitin-specific protease USP7 in cancer cells where USP7 acts to deubiquitinate and stabilize EZH2. Interestingly, we found that USP7-catalyzed H2BK120ub1 deubiquitination is a prerequisite for chromatin loading of PRC2 thus H3K27 trimethylation, and this process is not affected by H2AK119 ubiquitination catalyzed by PRC1. Genome-wide analysis of the transcriptional targets of the USP7/PRC2 complex identified a cohort of genes including FOXO1 that are involved in cell growth and proliferation. We demonstrated that the USP7/PRC2 complex drives cancer cell proliferation and tumorigenesis in vitro and in vivo. We showed that the expression of both USP7 and EZH2 elevates during tumor progression, corresponding to a diminished FOXO1 expression, and the level of the expression of USP7 and EZH2 strongly correlates with histological grades and prognosis of tumor patients. These results reveal a dual role for USP7 in the regulation of the abundance and function of EZH2, supporting the pursuit of USP7 as a therapeutic target for cancer intervention.


Figures

Figure 1.
Figure 1.
USP7 is physically associated with the PRC2 complex. (A) Immunopurification and mass spectrometry analysis of EZH2-containing protein complex. (B) Immunopurification and mass spectrometry analysis of USP7-containing protein complex. (C) Co-IP analysis of the association between USP7 and PRC2 complex. Whole cell lysates from A375 cells and HEK293T cells were immunoprecipitated (IP) then immunoblotted (IB) with antibodies against the indicated proteins. (D) Fast protein liquid chromatography analysis of the native protein complex. Chromatographic elution profiles (upper panel) and western blotting analysis (lower panel) of the chromatographic fractions with antibodies against the indicated proteins are shown. Equal volumes from each fraction were analyzed and the elution positions of calibration proteins with known molecular masses (kDa) are indicated. (E) Experiments analogous to (D) were performed with the USP7-containing protein complex purified from FLAG-USP7-expressing A375 cells. (F) Confocal microscopy analysis of USP7 and PRC2 complex subcellular localization. A375 cells were fixed and immunostained with antibodies against the indicated proteins; scale bar: 10 μm. (G) His-pull down assays with full-length or deletion mutants of USP7 purified from Sf9 insect cells and in vitro-transcribed/translated proteins as indicated. The asterisks indicate the recombinant proteins stained by Commassie Blue. (H) GST pull-down assays with bacterially expressed GST-fused deletion mutants of EZH2 and in vitro-transcribed/translated FLAG-USP7. The asterisks indicate the recombinant proteins stained by Commassie Blue. (I) Illustration of the molecular interfaces required for the association of USP7 with the PRC2 complex.
Figure 2.
Figure 2.
USP7 promotes deubiquitination and stabilization of EZH2. (A) A375 cells transfected with control siRNA or different sets of USP7 siRNAs were collected and analyzed by western blotting and quantitative reverse transcription (qRT)-PCR. Each bar represents the mean ± SD from biological triplicate experiments. **P < 0.01, by one-way ANOVA. (B) A375 cells transfected with Control siRNA or USP7 siRNAs were treated with DMSO or proteasome inhibitor MG132 (10 μM). Cellular extracts were prepared and analyzed by western blotting. (C) A375 cells were transfected with Control siRNA or USP7 siRNA followed by treatment with cycloheximide (CHX, 50 μg/ml), and harvested at the indicated time points followed by western blotting analysis. (D) A375 cells with Dox-inducible expression of FLAG-USP7/WT or FLAG-USP7/C223S cultured in the absence or presence of increasing amounts of Dox. Cellular extracts and total RNA were collected for western blotting and qRT-PCR analysis, respectively. Each bar represents the mean ± SD from biological triplicate experiments. **P < 0.01, one-way ANOVA. (E) A375 cells stably expressing FLAG-EZH2 co-transfected with Control siRNA or USP7 siRNAs and HA-Ub/WT. Cellular extracts were immunoprecipitated with anti-FLAG followed by immunoblotting with anti-HA. (F) A375 cells stably expressing FLAG-EZH2 were co-transfected with HA-Ub/WT or HA-Ub/MT and different amounts of Myc-USP7 or Myc-USP7/C223S as indicated. Cellular extracts were immunoprecipitated with anti-FLAG followed by immunoblotting with anti-HA. (G) In vitro deubiquitination assays were performed with HA-Ub-conjugated EZH2 purified from A375 cells using high-salt and detergent buffer and USP7/WT or USP7/C223S purified from baculovirus-infected insect cells. The asterisks indicate the recombinant proteins stained by Commassie Blue.
Figure 3.
Figure 3.
USP7 deubiquitinating H2BK120ub1 regulates the trimethylation of H3K27. (A) A375 cells transfected with USP7 siRNA were fixed and immunostained with the indicated antibodies followed by confocal microscopy analysis. The white arrows indicate cells with USP7 depletion to different extents; scale bar: 10 μm. (B) A375, HaCaT and PIG1 cells were co-transfected with Control siRNA, EZH2 siRNA, Vector or FLAG-EZH2 and different amounts of USP7 siRNA as indicated. Cellular extracts were collected and analyzed by western blotting. (C) A375 cells stably expressing FLAG-EZH2 transfected with USP7 siRNA, then fixed, and immunostained with the indicated antibodies followed by confocal microscopy analysis. The white arrows indicate cells with USP7 depletion to different extents; scale bar: 10 μm. (D) A375 cells were co-transfected with Control siRNA or different sets of USP7 siRNAs and different amounts of FLAG-EZH2 as indicated. Cellular extracts were collected and analyzed by western blotting.
Figure 4.
Figure 4.
Genome-wide the transcription target analysis for the USP7/PRC2 complex. (A) Genomic distribution of USP7 and EZH2 determined by ChIP-seq analysis. (B) Venn diagram of overlapping promoters bound by USP7 and EZH2 in A375 cells. The numbers represent the number of promoters targeted by the indicated proteins. The clustering of the 1236 overlapping target genes of USP7/EZH2 into functional groups is shown. Detailed results of the ChIP-seq experiments are summarized in Supplementary Table S2. (C) ChIP-seq density heatmaps and profiles of EZH2 on USP7-binding sites. (D) The analysis of USP7-bound motifs and EZH2-bound motifs using MEME suite. (E) Visualization of those density profiles indicated the significant decrease of USP7, EZH2 and H3K27me3 densities and increase of H2BK120ub1 density around the USP7 specific peaks after knockdown of USP7. (F) Average occupancy of H3K27me3 of the USP7/EZH2-occupied genes in A375 cells expressed Control shRNA, USP7 shRNA or USP7 shRNA/FLAG-EZH2. (G) qChIP verification of the ChIP-seq results of the indicated genes with antibodies against the indicated proteins in A375 cells. Each bar represents the mean ± SD from biological triplicate experiments. *P < 0.05 and **P < 0.01, one-way ANOVA. (H) ChIP/Re-ChIP experiments on the promoters of the indicated genes with antibodies against the indicated proteins in A375 cells.
Figure 5.
Figure 5.
The assembly of the USP7/EZH2 complex on transcriptional targets. (A andB) qChIP analysis of selected promoters in the A375 cells after co-transfection with indicated shRNA and Vector or FLAG-EZH2 using the indicated antibodies. The knockdown efficiencies of USP7 and EZH2 were verified by western blotting. (C) Western blotting analysis of the expression of indicated proteins in A375 cells that transfected with different sets of USP7 siRNAs. (D) Western blotting analysis of the expression of H3K27me3 and H2AK119ub in A375 cells transfected with the indicated siRNAs. (E) A375 cells were transfected with indicated siRNAs for qChIP analysis on the selected promoters using antibodies against the indicated histone modification. (F) A375 cells transfected with FLAG-RNF20 or FLAG-RNF40 for the measurement of the indicated histone modification by western blotting. (G) A375 cells were transfected with the indicated expression vectors for qChIP analysis on the selected promoters using antibodies against the indicated histone modification. In A, B, E and G, data represent the mean ± SD from biological triplicate experiments. *P < 0.05 and **P < 0.01, one-way ANOVA.
Figure 6.
Figure 6.
USP7 is associated with EZH2 to co-suppress the transcription of targets. (A) A375 cells transfected with Control siRNA or different sets of USP7 siRNAs were collected and analyzed by quantitative reverse transcription (qRT)-PCR and western blotting, respectively. (B) A375 cells transfected with Control siRNA or different sets of EZH2 siRNAs were collected and analyzed by qRT-PCR and western blotting, respectively. (C) A375 cells were co-transfected with Control siRNA or USP7 siRNA and Vector or different amounts of FLAG-EZH2; cellular extracts were collected and analyzed by western blotting. In (A and B), data represent the mean ± SD from biological triplicate experiments. *P < 0.05, **P < 0.01, one-way ANOVA.
Figure 7.
Figure 7.
The USP7/EZH2-FOXO1 signaling pathway is required for cell proliferation and tumorigenesis. (A) A375 cells were infected with lentiviruses carrying the indicated shRNAs; the efficiency of knockdown was verified by western blotting. (B) EdU assays performed in A375 cells infected with lentiviruses carrying shRNA against the indicated targets. Representative images and statistical analysis are shown; scale bar: 50 μm. Each bar represents the mean ± SD from biological triplicate experiments. *P < 0.05, **P < 0.01, one-way ANOVA. (C) Growth curve assays in A375 cells were infected with lentiviruses carrying the indicated shRNAs. Each bar represents the mean ± SD from biological triplicate experiments. ** P < 0.01, two-way ANOVA. (D) A375 cells infected with lentiviruses carrying the indicated shRNAs were treated with different doses of dabrafenib or vemurafenib. Colony formation assays were performed, and the representative images are shown. (E) The above-described A375 cells were transplanted into athymic mice (n = 10); half of the mice in each group were randomly subjected to feed vehicle or dabrafenib daily one week post tumor injection. Representative tumors and sacrificed mice are shown (left panel). Tumor volumes were measured weekly and tumors were harvested and weighed when the mice were sacrificed. Error bars represent mean ± SEM, **P < 0.01, two-way ANOVA for tumor volume analysis and one-way ANOVA for tumor weight analysis (right panel).
Figure 8.
Figure 8.
USP7 is implicated in tumorigenesis and poor patient survival. (A) Expression profiles of USP7, EZH2 and FOXO1 in human tissue arrays, including series of paired normal and tumor samples. Representative images (200 × magnification) from three paired samples in each case are shown; scale bar, 50 μm. (B) Human tissues containing normal skin, benign nevus, malignant melanoma and metastatic melanoma samples were analyzed by immunohistochemical staining. Representative images (200 × magnification) are shown; scale bar: 50 μm. The staining intensity was determined by Image-Pro Plus software and presented as box plots. *P < 0.05; **P < 0.01; one-way ANOVA. The correlation coefficient and P values were analyzed. (C) Analysis of Talantov melanoma (left panel) or Haqq melanoma (right panel) from Oncomine for the expression of USP7 in normal human skin tissues and benign melanocytic skin nevus samples or in normal human skin tissues and melanoma samples. Data are presented as box plots (**P < 0.01). (D) Kaplan–Meier survival analysis for the relationship between survival time of melanoma patients and the mRNA expression level of USP7 with survival packages from https://tcga-data.nci.nih.gov/docs/publications/tcga/. (E) Kaplan–Meier survival analysis of the relationship between survival time of melanoma patients and gene copy number status of USP7 with survival packages from https://tcga-data.nci.nih.gov/docs/publications/tcga/.

Similar articles

Cited by

References

    1. Margueron R., Reinberg D.. The Polycomb complex PRC2 and its mark in life. Nature. 2011; 469:343–349. - PMC - PubMed
    1. Wiles E.T., Selker E.U.. H3K27 methylation: a promiscuous repressive chromatin mark. Curr. Opin. Genet. Dev. 2017; 43:31–37. - PMC - PubMed
    1. Varambally S., Dhanasekaran S.M., Zhou M., Barrette T.R., Kumar-Sinha C., Sanda M.G., Ghosh D., Pienta K.J., Sewalt R.G., Otte A.P.et al. .. The polycomb group protein EZH2 is involved in progression of prostate cancer. Nature. 2002; 419:624–629. - PubMed
    1. Knudsen E.S., Dervishaj O., Kleer C.G., Pajak T., Schwartz G.F., Witkiewicz A.K.. EZH2 and ALDH1 expression in ductal carcinoma in situ: complex association with recurrence and progression to invasive breast cancer. Cell Cycle. 2013; 12:2042–2050. - PMC - PubMed
    1. Eskander R.N., Ji T., Huynh B., Wardeh R., Randall L.M., Hoang B.. Inhibition of enhancer of zeste homolog 2 (EZH2) expression is associated with decreased tumor cell proliferation, migration, and invasion in endometrial cancer cell lines. Int. J. Gynecol. Cancer. 2013; 23:997–1005. - PMC - PubMed

Publication types

Substances