. 2021 Apr;11(4):200265.
doi: 10.1098/rsob.200265. Epub 2021 Apr 14.

Ageing genetic signature of hypersomatotropism

Affiliations

Ageing genetic signature of hypersomatotropism

Abdalla Elbialy. Open Biol. 2021 Apr.

Abstract

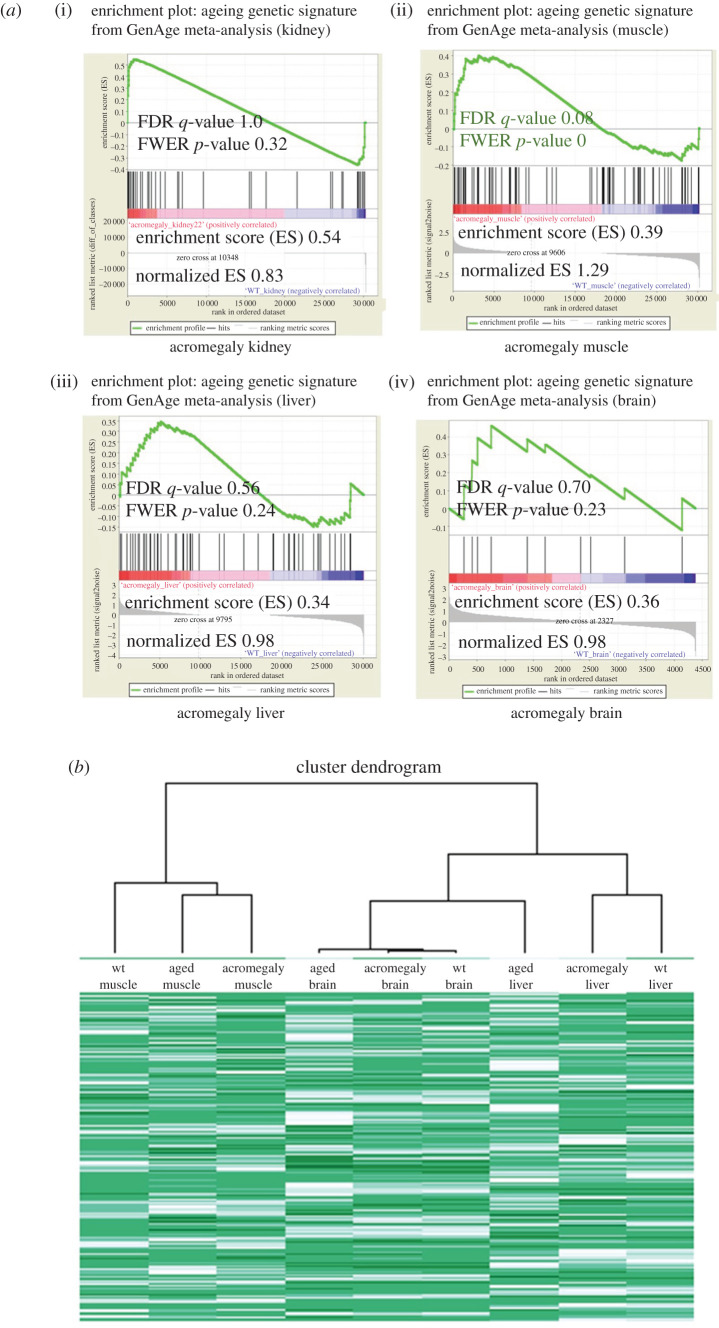
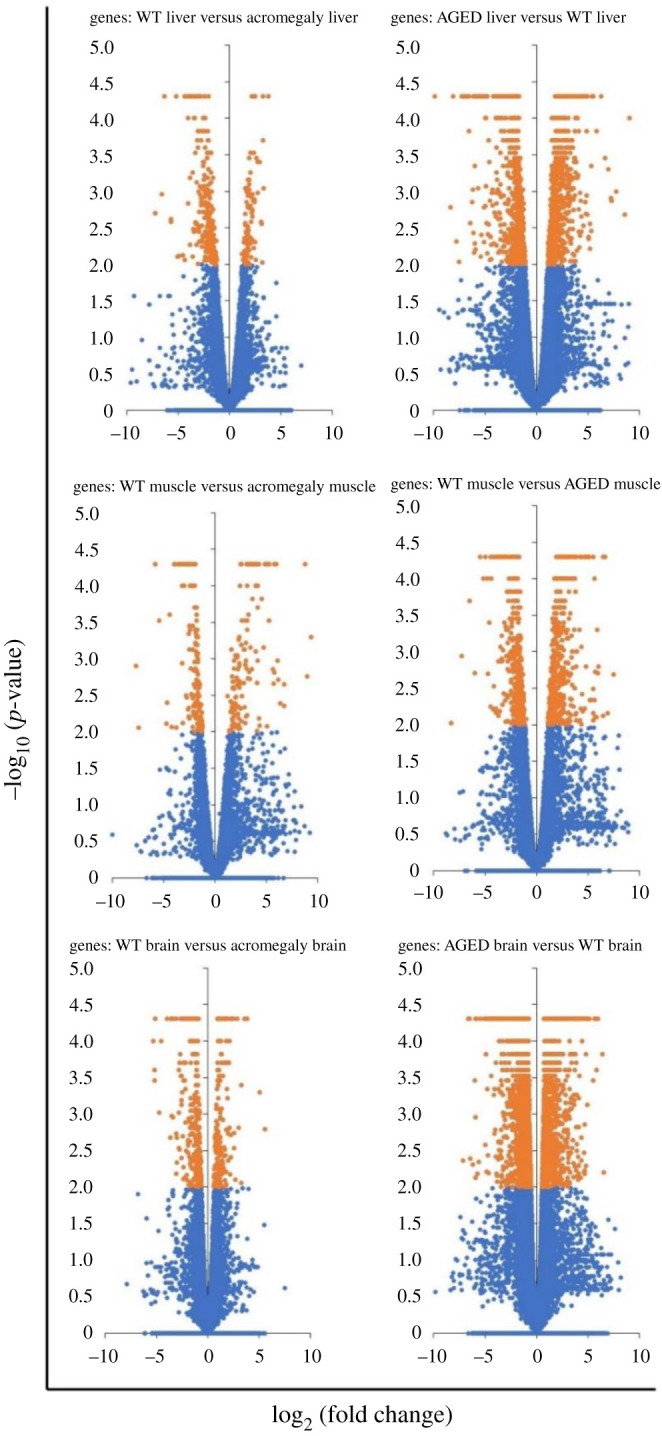
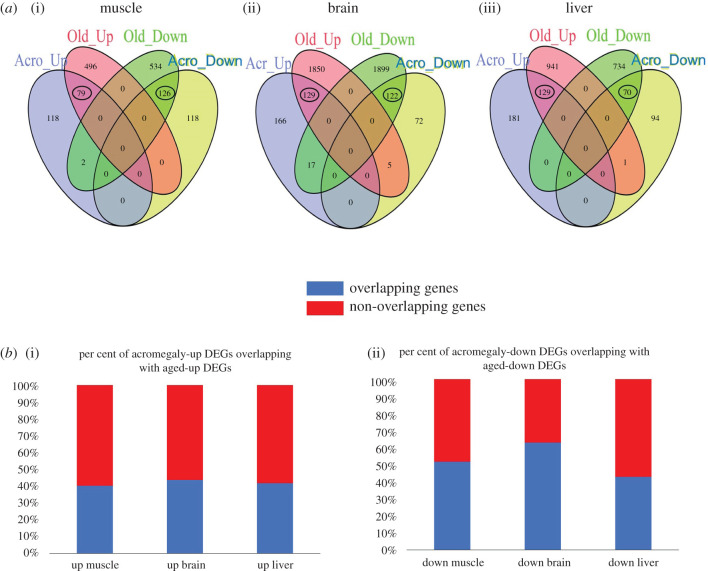
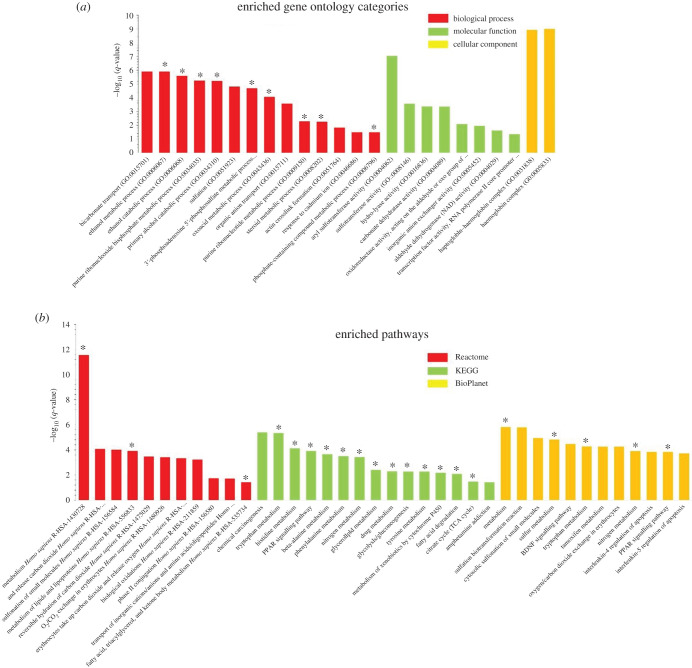
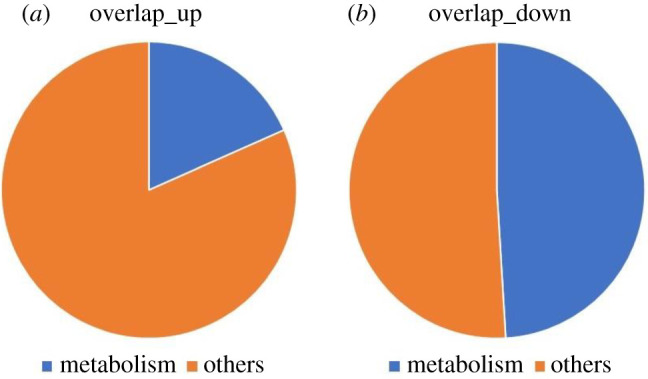
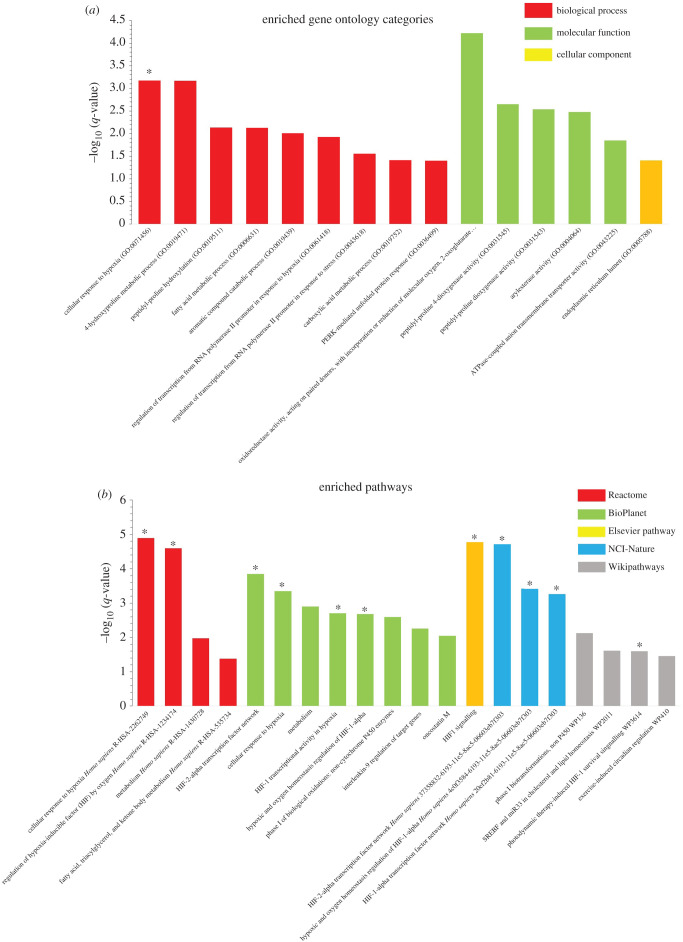
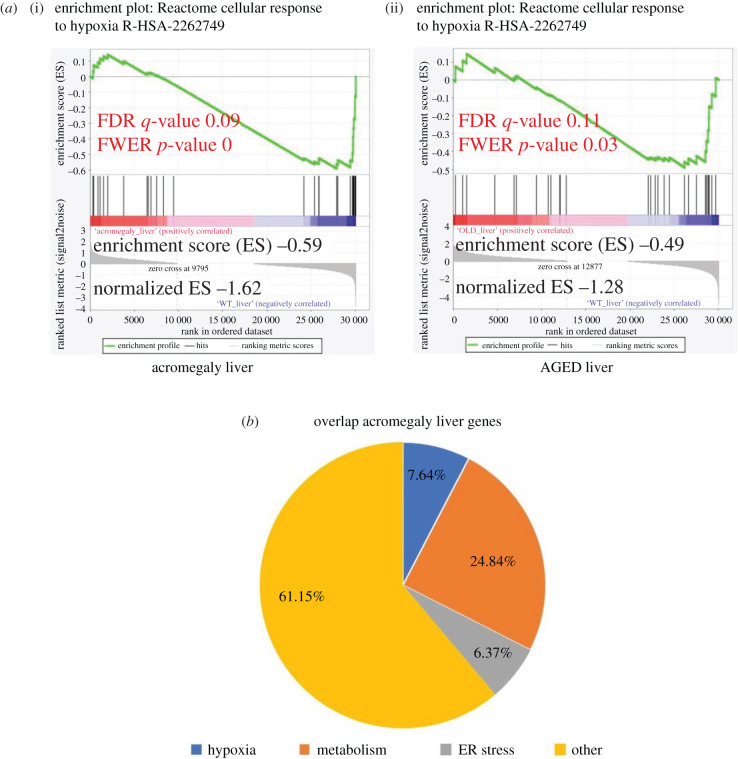
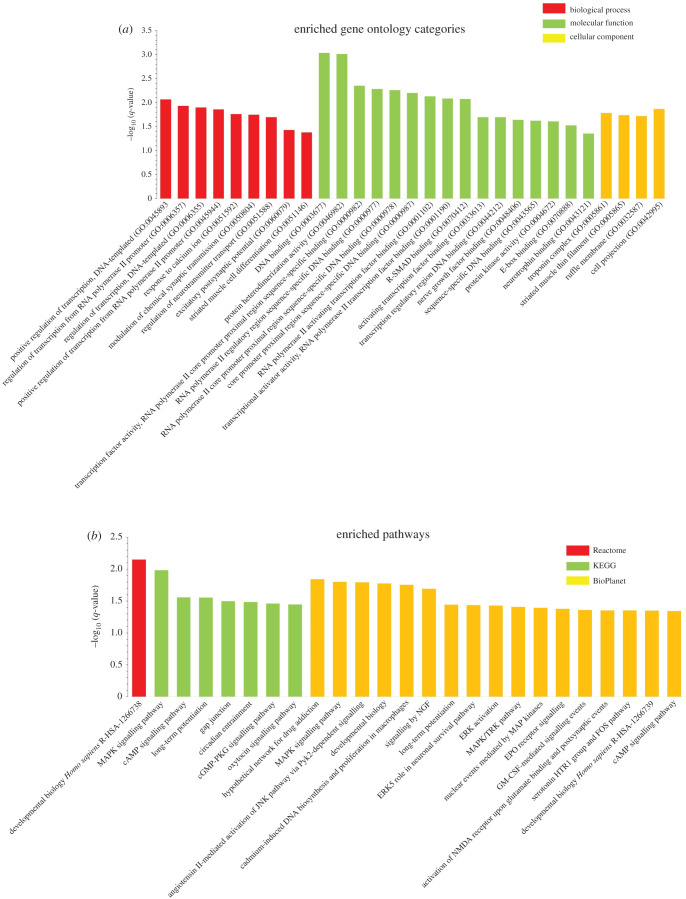
Acromegaly is a pathological condition that is caused by over-secretion of growth hormone (GH) and develops primarily from a pituitary adenoma. Excess GH exposure over a prolonged period of time leads to a wide range of systemic manifestations and comorbidities. Studying the effect of excess GH on the cellular level could help to understand the underlying causes of acromegaly health complications and comorbidities. In our previous publications, we have shown that excess GH reduces body side population (SP) stem cells and induces signs of premature ageing in an acromegaly zebrafish model. Here, we study acromegaly ageing in greater depth at the level of gene expression. We investigated whether acromegaly induces an ageing genetic signature in different organs. Using the GenAge database, our acromegaly model showed a significant enrichment of ageing genetic datasets in the muscle but not in other organs. Likewise, the hierarchical clustering of wild type (WT), acromegaly and aged RNA data from various organs revealed the similarity of gene expression profiles between the acromegaly and the aged muscles. We therefore identified overlapping differentially expressed genes (DEGs) in different organs between acromegaly and aged zebrafish. Importantly, about half of the muscle, liver and brain acromegaly DEGs overlapped with aged zebrafish DEGs. Interestingly, overlapping was observed in the same way; acromegaly-up DEGs overlapped with aged zebrafish up DEGs, not down DEGs, and vice versa. We then identified the biological functions of overlapping DEGs. Enrichment database analysis and gene ontology showed that most overlapping muscle genes were involved in ageing metabolism, while overlapping liver DEGs were involved in metabolic pathways, response to hypoxia and endoplasmic reticulum stress. Thus, this study provides a full ageing genetic signature of acromegaly at the gene expression level.

Keywords: acromegaly; ageing signature; growth hormone; zebrafish.


Figures

Figure 1.
Figure 1.
Acromegaly muscle ageing at gene expression level. (a) GSEA results of ageing signature genes from the GenAge database in the acromegaly kidney, muscle, liver and brain. Significant p-values less than 0.05 and FDR q-values less than 0.25 are shown in red. (b) Hierarchical cluster analysis dendrogram and heatmap of RNA seq data from the muscle, liver and brains of WT, acromegaly model (1-year-old) and aged zebrafish (3-year-old).
Figure 2.
Figure 2.
Volcano plots of acromegaly and aged muscle genes versus WT muscle. Y-axis, −log10 (p-value); X-axis, log2 (fold change). Orange coloured genes are considered significant (n = 3).
Figure 3.
Figure 3.
Acromegaly overlap DEGs. (a) Venn diagrams of up-and-down DEGs of acromegaly and aged zebrafish muscle, brain and liver. (b) Bar chart showing the percentage of up-and-down acromegaly DEGs overlapping with aged zebrafish.
Figure 4.
Figure 4.
Enriched GO and pathway analysis of muscle overlapping DEGs. (a) GO analysis showing enriched biological processes, molecular functions and cellular components of muscle overlapping DEGs. (b) Histogram for enriched signalling pathways of muscle overlapping DEGs from Reactome, KEGG and BioPlanet databases. Y-axis, the statistical significance of the enrichment; X-axis, pathway categories. Metabolism-related pathways and GO categories are denoted by asterisks. BDNF, brain-derived neurotrophic factor; PPAR, peroxisome proliferator-activated receptor.
Figure 5.
Figure 5.
Pie chart showing the percentage of up- and down-regulated overlapping DEGs that are related to metabolic processes in muscle.
Figure 6.
Figure 6.
Enriched GO and pathway analysis of liver overlapping DEGs. (a) GO analysis showing enriched biological processes, molecular functions and cellular components of liver overlapping DEGs. (b) Histogram for enriched signalling pathways of liver overlapping DEGs from Reactome, Elsevier pathway, Wikipathways, NCI-Nature and BioPlanet databases. Y-axis, the statistical significance of the enrichment; X-axis, pathway categories. Hypoxia-related pathways and GO categories are denoted by asterisks. HIF-1, hypoxia-inducible factor; miR33, micro RNA identifier; SREBF, sterol regulatory element–binding protein gene.
Figure 7.
Figure 7.
Hypoxia, metabolism and stress-related genes in overlapping liver DEGs. (a) Illustration of statistically significant GSEA results of cellular response to hypoxia. Significant p-values <0.05 and FDR q-values <0.25 are written in red. The reported p-value of 0.0 indicates an actual p-value of less than 0.01 (n = 3). (b) Pie chart showing the percentage of overlapping DEGs that are related to metabolism, hypoxia and ER stress in liver.
Figure 8.
Figure 8.
Enriched GO and pathway analysis of brain overlapping DEGs. (a) GO analysis showing enriched biological processes, molecular functions and cellular components of brain overlapping DEGs. (b) Histogram for enriched signalling pathways of brain overlapping DEGs from Reactome, KEGG and BioPlanet databases. Y-axis, the statistical significance of the enrichment; X-axis, pathway categories. cGMP-PKG, cyclic guanosine monophosphate-dependent protein kinase or protein kinase G; epo, erythropoietin; ERKs, extracellular signal-regulated kinases; FOS, Fos proto-oncogene; GM-CSF, granulocytemacrophage colony-stimulating factor; HTR1, 5-hydroxytryptamine receptor 1; JNK, c-Jun N-terminal kinase; MAPK, mitogen-activated protein kinase; NGF, nerve growth factor; NMDA, n-methyl-D-aspartate; R-SMADs, receptor-regulated SMADs; TRK, tropomyosin receptor kinase.
Figure 9.
Figure 9.
GH-cultured human oocytes showing ageing at gene expression level. (a) Illustration of statistically significant GSEA results against a geneset that consistently overexpressed with age, based on meta-analysis of microarray data (MSigDB no. M2144) and (b) premature ageing disorder dataset (Werner syndrome, MSigDB no. M1996). Significant p-values < 0.05 and FDR q-values < 0.25 are written in red. The reported p-value of 0.0 indicates an actual p-value of less than 0.01.

Similar articles

References

    1. Petrossians P, et al. 2017. Acromegaly at diagnosis in 3173 patients from the Liège Acromegaly Survey (LAS) database. Endocrine-Related Cancer 24, 505-518. (10.1530/ERC-17-0253) - DOI - PMC - PubMed
    1. Hannah-Shmouni F, Trivellin G, Stratakis CA. 2016. Genetics of gigantism and acromegaly. Growth Hor. IGF Res. 30, 37-41. (10.1016/j.ghir.2016.08.002) - DOI - PMC - PubMed
    1. Elbialy A, Asakawa S, Watabe S, Kinoshita S. 2018. A zebrafish acromegaly model elevates DNA damage and impairs DNA repair pathways. Biology 7, 47. (10.3390/biology7040047) - DOI - PMC - PubMed
    1. Colao A, Grasso LFS, Giustina A, Melmed S, Chanson P, Pereira AM, Pivonello R. 2019. Acromegaly. Nat. Rev. Dis. Primers 5, 20. (10.1038/s41572-019-0071-6) - DOI - PubMed
    1. Chanson P, Salenave S. 2008. Acromegaly. Orp. J. Rare Dis. 3, 17. (10.1186/1750-1172-3-17) - DOI - PMC - PubMed

Supplementary concepts