. 2021 Apr;18(177):20200970.
doi: 10.1098/rsif.2020.0970. Epub 2021 Apr 14.

School closures reduced social mixing of children during COVID-19 with implications for transmission risk and school reopening policies

Affiliations

School closures reduced social mixing of children during COVID-19 with implications for transmission risk and school reopening policies

Jennifer R Head et al. J R Soc Interface. 2021 Apr.

Abstract

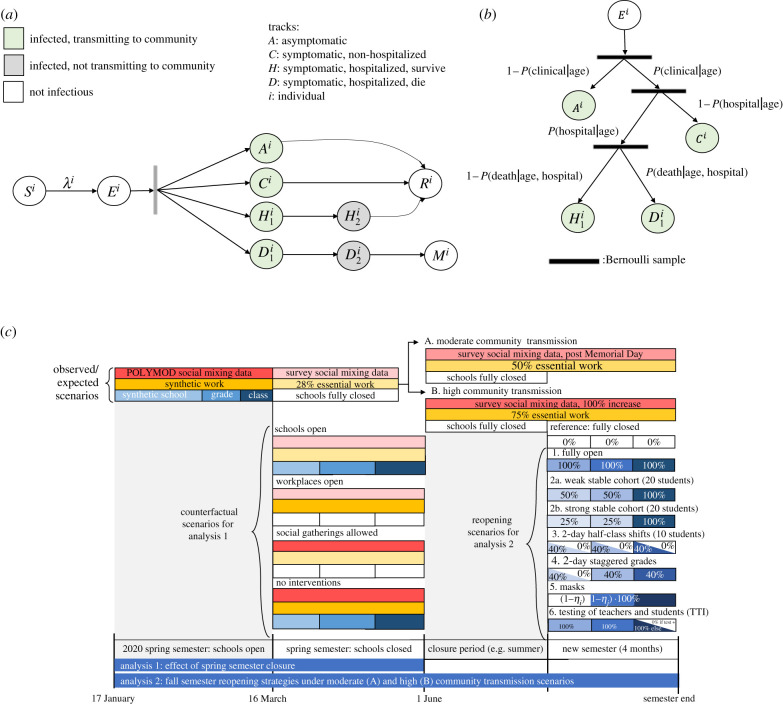
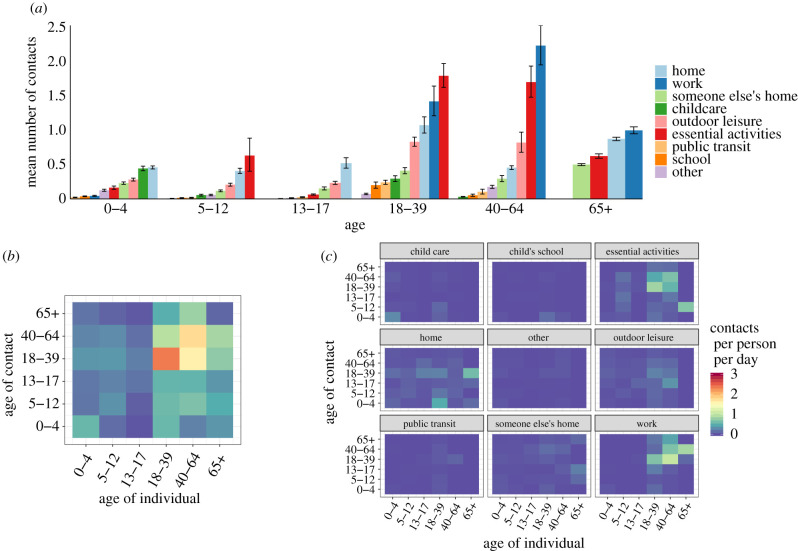
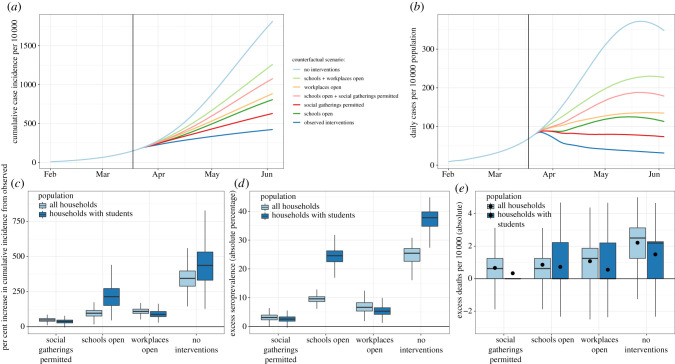
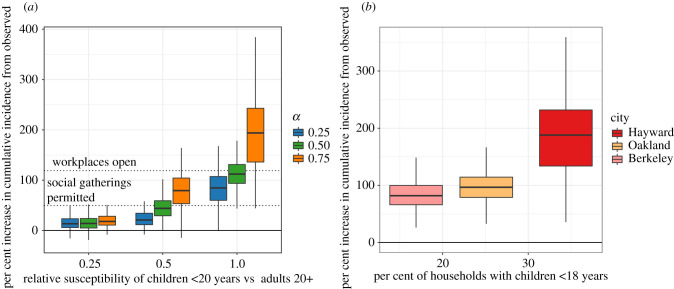
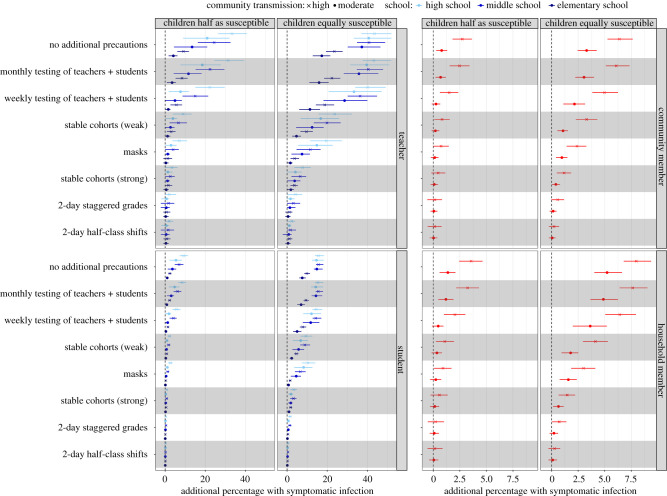
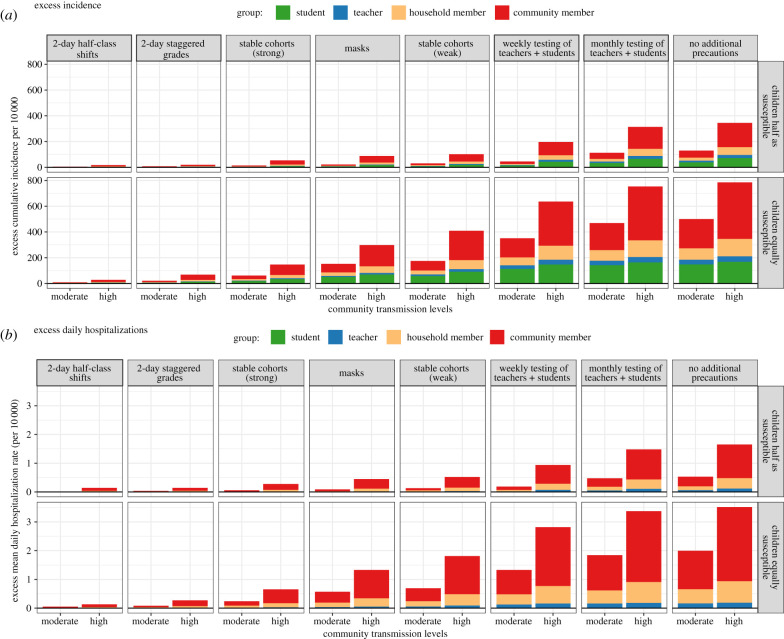
School closures may reduce the size of social networks among children, potentially limiting infectious disease transmission. To estimate the impact of K-12 closures and reopening policies on children's social interactions and COVID-19 incidence in California's Bay Area, we collected data on children's social contacts and assessed implications for transmission using an individual-based model. Elementary and Hispanic children had more contacts during closures than high school and non-Hispanic children, respectively. We estimated that spring 2020 closures of elementary schools averted 2167 cases in the Bay Area (95% CI: -985, 5572), fewer than middle (5884; 95% CI: 1478, 11.550), high school (8650; 95% CI: 3054, 15 940) and workplace (15 813; 95% CI: 9963, 22 617) closures. Under assumptions of moderate community transmission, we estimated that reopening for a four-month semester without any precautions will increase symptomatic illness among high school teachers (an additional 40.7% expected to experience symptomatic infection, 95% CI: 1.9, 61.1), middle school teachers (37.2%, 95% CI: 4.6, 58.1) and elementary school teachers (4.1%, 95% CI: -1.7, 12.0). However, we found that reopening policies for elementary schools that combine universal masking with classroom cohorts could result in few within-school transmissions, while high schools may require masking plus a staggered hybrid schedule. Stronger community interventions (e.g. remote work, social distancing) decreased the risk of within-school transmission across all measures studied, with the influence of community transmission minimized as the effectiveness of the within-school measures increased.

Keywords: COVID-19; SARS-CoV-2; children social networks; contact rate; school closures and reopening; transmission model.


Figures

Figure 1.
Figure 1.
Model schematic (a) Schematic of the agent-based susceptible–exposed–infected–recovered (SEIR) model. S, susceptible; E, exposed; A, asymptomatic; C, symptomatic, will recover; H1, symptomatic and will recover, not yet hospitalized; H2, hospitalized and will recover; D1, symptomatic, not yet hospitalized; D2, hospitalized and will die; R, recovered; M, dead; λ, force of infection defining movement from S to E. Superscript i refers to individual. After an agent enters the exposed class, they enter along their predetermined track, with waiting times between stage progression drawn from a Weibull distribution. (b) Schematic of the conditional probabilities by which agents are assigned a predetermined track. (c) Schematic of interventions simulated in the SEIR model. The first analysis examines transmission between 17 January and 1 June, and tests the effect of several counterfactual scenarios that took place between the enactment of shelter-in-place (16 March) and the original end of the spring semester (1 June). The second analysis examines transmission over a subsequent four-month semester, and tests the effect of several simulated reopening strategies for the semester, expected to occur under a high and moderate community transmission scenario. Boxes represent categories of social contacts, including community (red), work (yellow), school (light blue), grade (medium blue) and classroom (dark blue). Percentages in the boxes represent the percentage of the contact rate experienced under a given intervention or counterfactual scenario (e.g. 0% represents a full closure).
Figure 2.
Figure 2.
Social contact patterns between children and adult family members of Bay Area households, 4 May–1 June 2020. (a) Average daily contacts per age group at nine pre-specified locations. (b) Average daily contacts per person by age category of the survey respondent and reported contact, unweighted. (c) Average daily contacts per person at each of the nine locations. Panels (b,c) share a legend.
Figure 3.
Figure 3.
Effect of spring semester interventions. We simulated transmission between 17 February and 1 June assuming children less than 10 years are half as susceptible to infection as older children and adults. Between 16 March (enactment of shelter-in-place orders) and 1 June (the end of the spring school semester), we assessed potential outcomes under various counterfactual scenarios: (1) schools had remained open for the remainder of the school semester; (2) workplaces had remained open; (3) social gatherings were permitted; (4) no interventions were enacted. (a) Modelled cumulative incidence according to the counterfactual scenario examined. Modelled predictions are not adjusted for under-reporting, which is expected to be substantial. (b) Daily incidence per 10 000 per counterfactual scenario examined. (c) The per cent increase in cumulative incidence from observed incidence between 17 February and 1 June, stratified by counterfactual scenario and population sub-group. (d) The absolute difference in the per cent of the population seropositive for each counterfactual scenario compared with the modelled, observed seroprevalence between 17 February and 1 June, stratified by population sub-group. (e) The per cent increase in deaths per 10 000 from observed between 17 February and 1 June, stratified by counterfactual scenario and population sub-group. The distribution of estimated death rate across 1000 realizations was skewed, so black dots representing the mean number of excess deaths per 10 000 are added.
Figure 4.
Figure 4.
Influence of key epidemiological parameters on the effectiveness of school closures. The per cent increase in cumulative incidence from observed incidence over the period 17 February–1 June had schools remained open between 17 March and 1 June. (a) Results are reported for modelling scenarios that varied the ratio of the susceptibility of individuals under 20 years to adults 20 or older, and the ratio of the force of infection for asymptomatic infections to symptomatic infections (α). Dashed lines indicate the per cent increase in incidence from observed that would have been expected if workplaces had remained open, and if social gatherings were permitted. (b) Results are reported for synthetic populations with varying levels of the proportion of households with children under 18 years of age, reflecting three major Bay Area cities (Berkeley, Oakland, Hayward), assuming children under 10 are half as susceptible as older children and adults.
Figure 5.
Figure 5.
Excess risk by sub-group associated with school reopening strategies over a subsequent four-month semester. Points and horizontal lines show the additional proportion (mean and interquartile range) of each sub-group expected to experience clinical infection over the course of a four-month semester compared with if schools were closed under each reopening scenario and the four transmission contexts: children half and equally as susceptible as adults crossed with moderate and high community transmission. Colours indicate the transmission across levels of schooling (elementary, middle and high) while the shape of the mean point indicates the level of community transmission (circle, moderate; cross, high). ‘Teachers' includes teachers and all other school staff.
Figure 6.
Figure 6.
Population-level excess incidence and hospitalizations associated with reopening strategies over a four-month semester. Excess cumulative incidence per 10 000 (a) and excess daily hospitalization, on average, per 10 000 (b) that would be expected over a four-month semester for each reopening strategy compared with if schools were closed. Bars are stratified by the moderate and high community transmission scenario and coloured according to the sub-group contributing cases. ‘Teachers' includes teachers and all other school staff.

Update of

Similar articles

Cited by

References

    1. Yoshikawa H, Wuermli AJ, Britto PR, Dreyer B, Leckman JF, Lye SJ, Ponguta SJ, Richter LM, Stein A. 2020. Effects of the global coronavirus disease-2019 pandemic on early childhood development: short- and long-term risks and mitigating program and policy actions. J. Pediatr. 223, 188-193. (10.1016/j.jpeds.2020.05.020) - DOI - PMC - PubMed
    1. Levinson M, Cevik M, Lipsitch M. 2020. Reopening primary schools during the pandemic. N. Engl. J. Med. 383, 981-985. (10.1056/NEJMms2024920) - DOI - PubMed
    1. Armitage R, Nellums LB. 2020. Considering inequalities in the school closure response to COVID-19. Lancet Global Health 8, e644. (10.1016/S2214-109X(20)30116-9) - DOI - PMC - PubMed
    1. Van Lancker W, Parolin Z.. 2020. COVID-19, school closures, and child poverty: a social crisis in the making. Lancet Public Health 5, e243. (10.1016/S2468-2667(20)30084-0) - DOI - PMC - PubMed
    1. Dunn CG, Kenney E, Fleischhacker SE, Bleich SN. 2020. Feeding low-income children during the Covid-19 pandemic. N. Engl. J. Med. 382, e40. (10.1056/NEJMp2005638) - DOI - PubMed

Publication types