Meta-Analysis
. 2021 Apr 13;21(1):149.
doi: 10.1186/s12905-021-01286-5.

Effects of rural-urban residence and education on intimate partner violence among women in Sub-Saharan Africa: a meta-analysis of health survey data

Affiliations
Meta-Analysis

Effects of rural-urban residence and education on intimate partner violence among women in Sub-Saharan Africa: a meta-analysis of health survey data

Maria Sarah Nabaggala et al. BMC Womens Health. .

Abstract

Background: Intimate Partner Violence (IPV) against women is a major public health and human rights problem worldwide. Sub-Saharan Africa (SSA) has one of the highest prevalence of IPV against women in the world. This study used meta-analysis to obtain pooled rural-urban and education attainment differences in the prevalence of IPV among ever-partnered women in SSA, and assessed whether the differences in IPV depended on the SSA region or period or women's age.

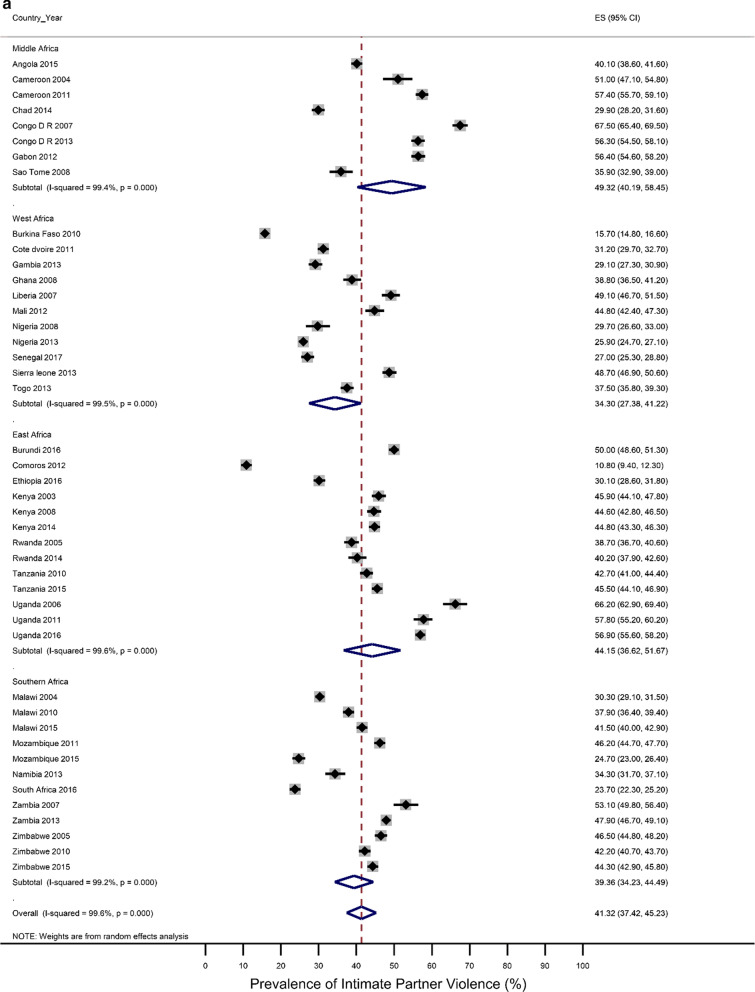
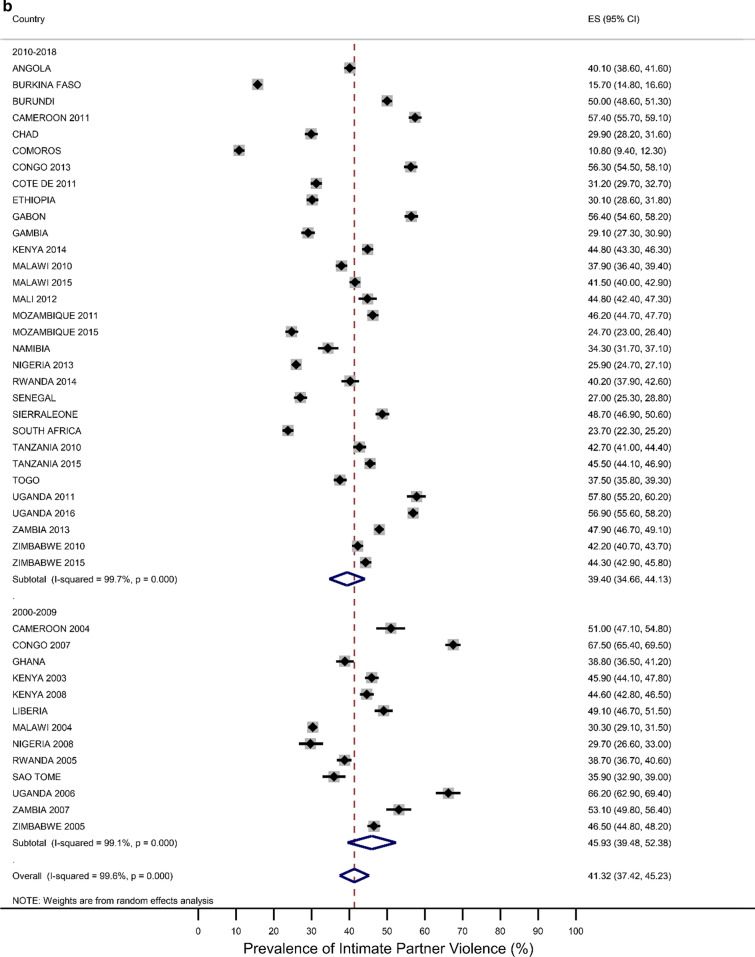
Methods: We analysed IPV data on 233,585 ever-partnered women aged 15-49 years from 44 demographic and health surveys conducted between 2000 and 2018 in 29 SSA countries. Random-effects meta-analyses were used to estimate overall rural-urban residence and educational differences in IPV rates among the women in SSA. Subgroup analyses were also done to investigate the sources of heterogeneity in the overall meta-analysis findings.

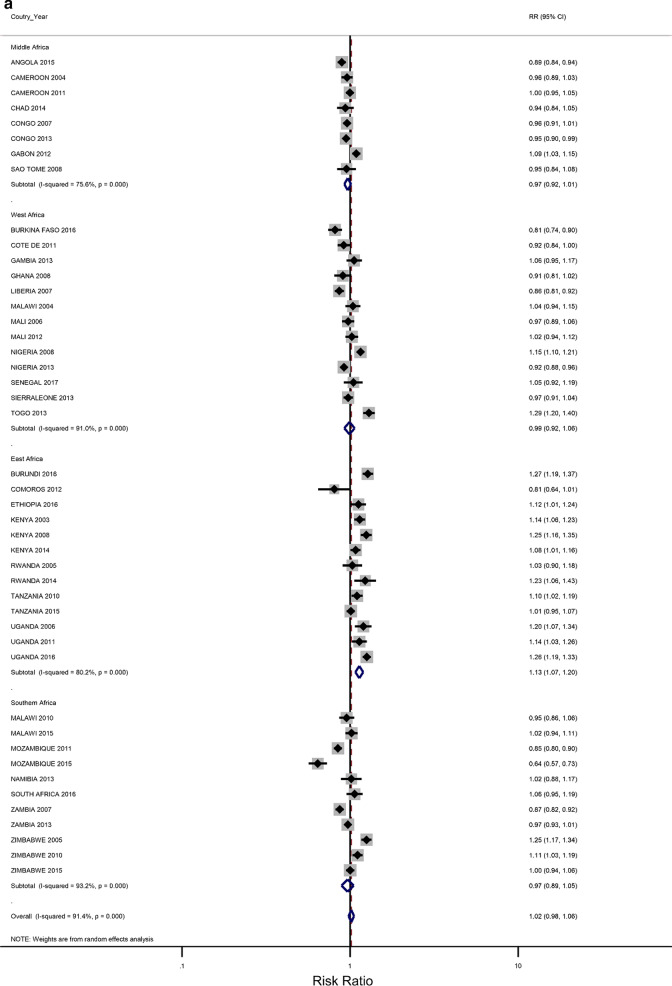
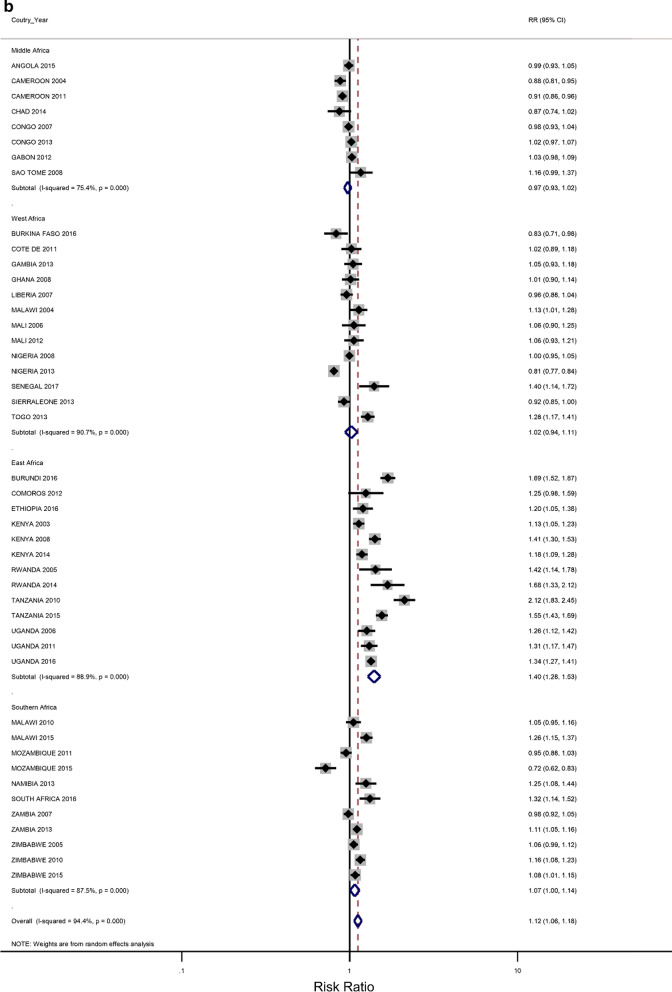
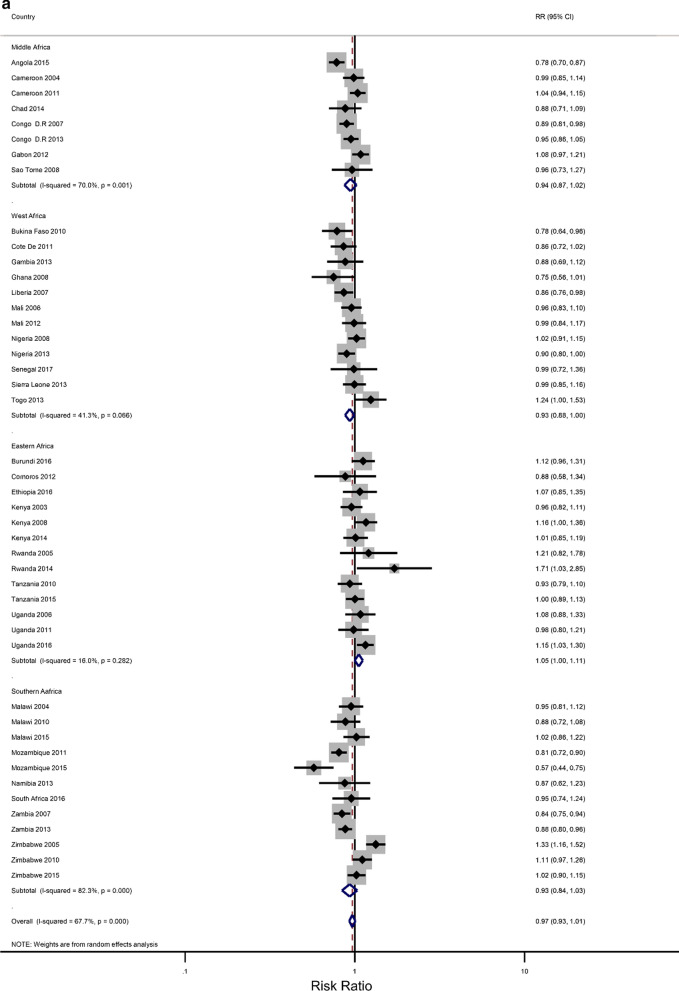
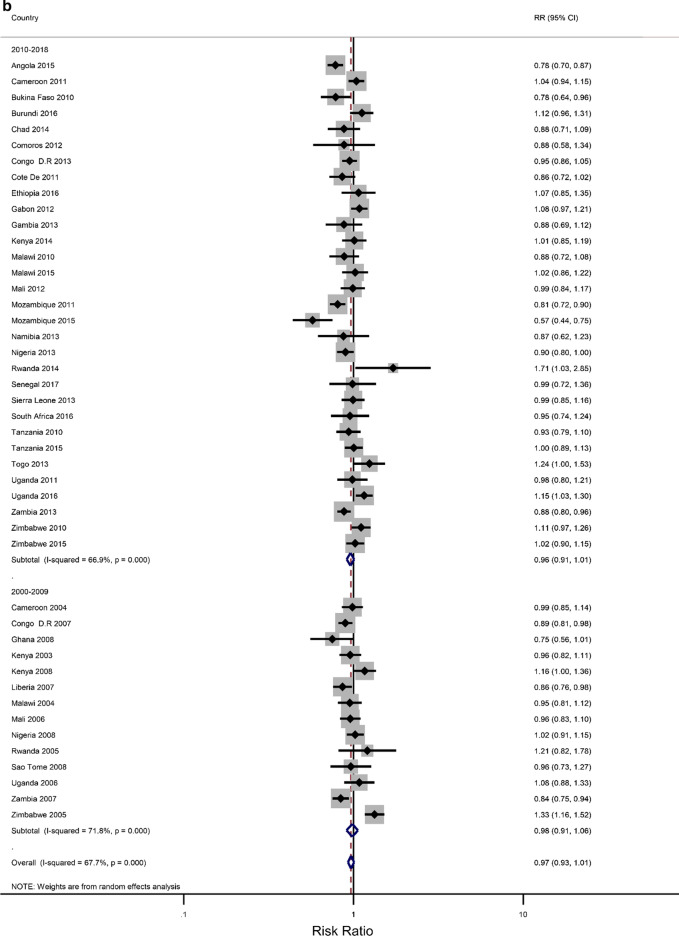
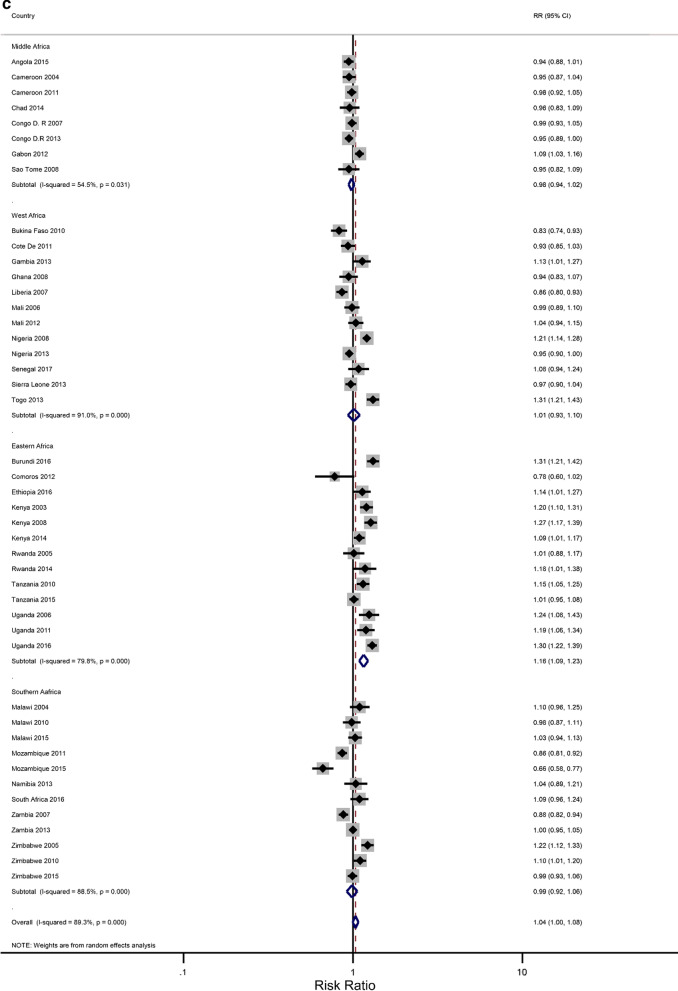
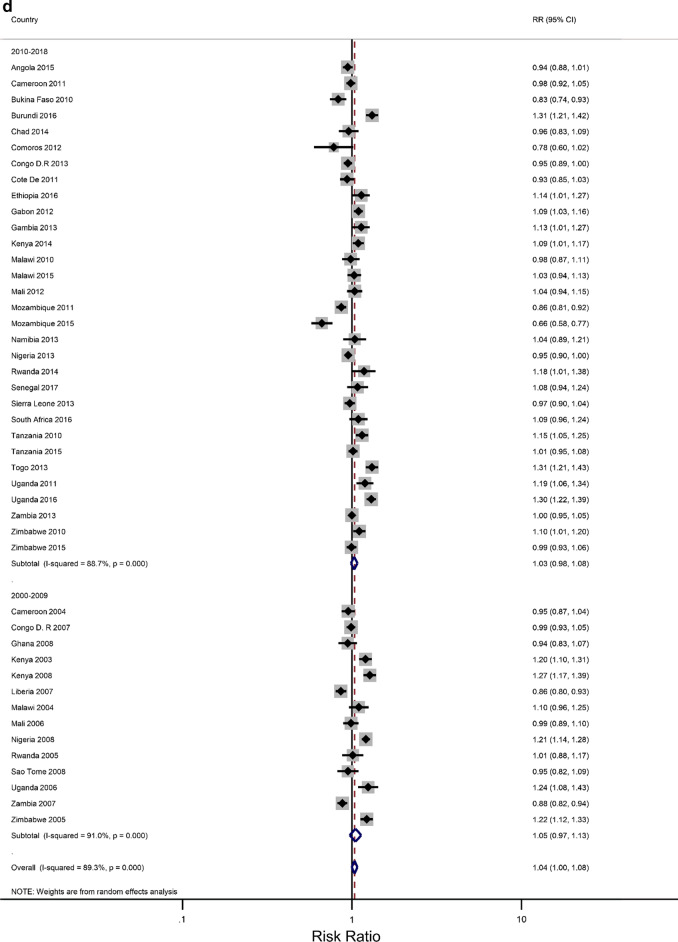
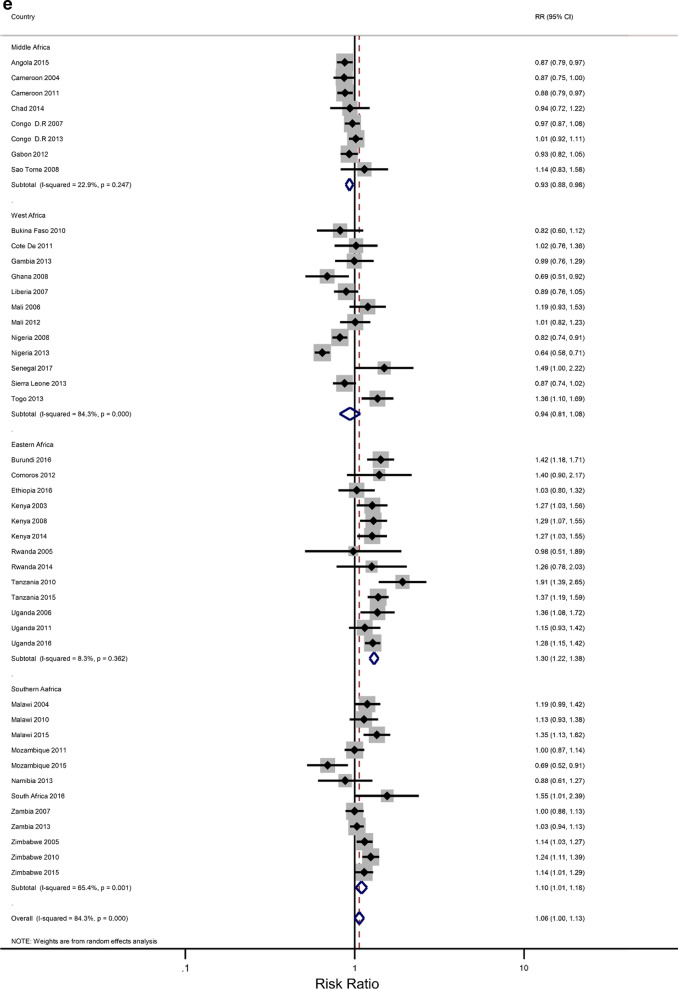
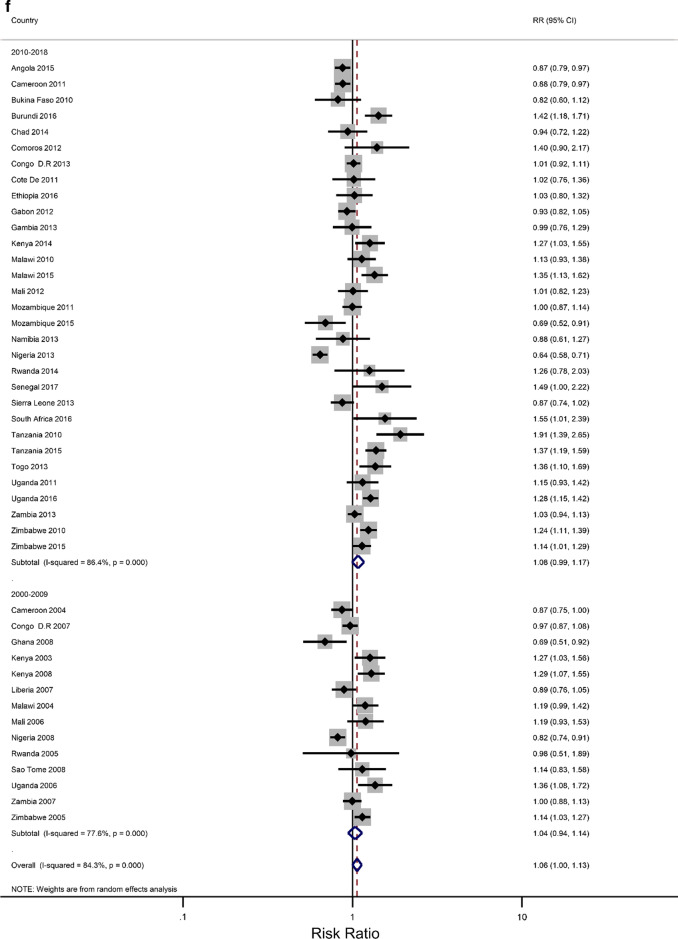
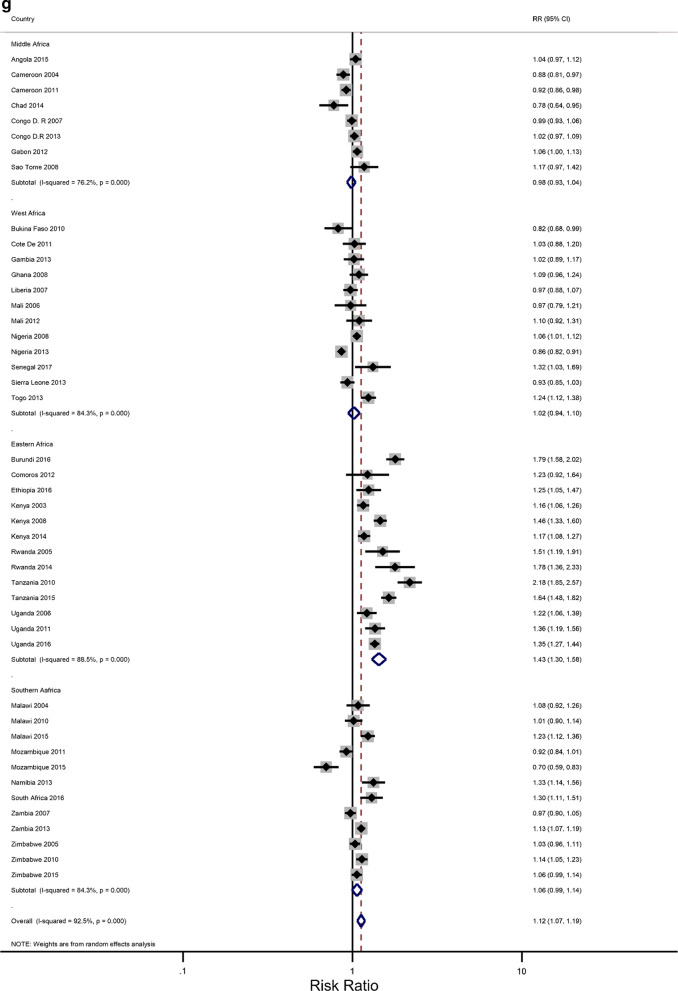
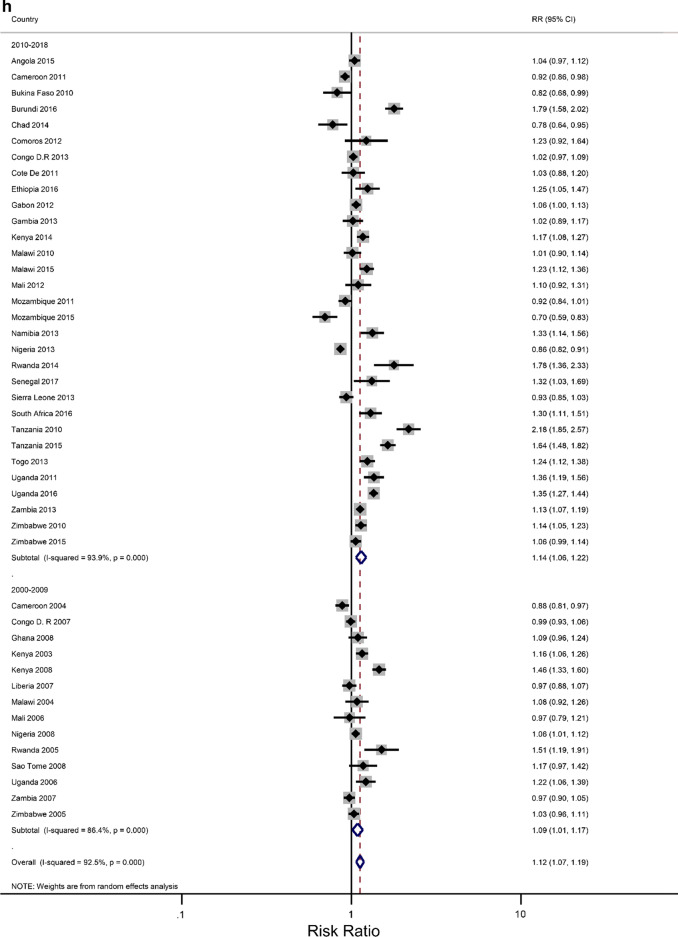
Results: The pooled prevalence of intimate partner violence was estimated to be 41.3% (37.4-45.2%). Regionally, the highest prevalence of IPV was in Middle Africa (49. 3%; 40.32-58.45), followed by East Africa (44.13%; 36.62-51.67), Southern Africa (39.36%; 34.23-44.49), and West Africa (34.30%; 27.38-41.22). The risks of experiencing IPV were significantly higher if the women had less than secondary education (RR = 1.12; 95% CI 1.07-1.22) compared to those with at least a secondary education. Generally, women who resided in a rural area had their risks of experiencing IPV increased (RR = 1.02; CI 0.96-1.06) compared to those who resided in urban areas, but the IPV increases were only significant in East Africa (RR = 1.13; CI 1.07-1.22).

Conclusion: In sub-Saharan Africa, intimate partner violence against women is widespread, but the levels are much higher among women with lower levels of education and residing in rural areas. Our findings have provided additional support to policies aimed at achieving SDG goals on the elimination of all forms of violence against women and girls in sub-Saharan Africa. For example, policies that advocate improved educational attainment, especially among women and communities in rural areas.

Keywords: Education level difference; Intimate partner violence; Meta-analysis; Residence differences; Sub-Saharan Africa.


Conflict of interest statement

The authors declare that they have no competing interests.

Figures

Fig. 1
Fig. 1
a Prevalence of any Intimate Partner Violence according to the region of sub-Saharan Africa. The dotted vertical line represents the pooled prevalence, with its associated 95% confidence interval. b Prevalence of any Intimate Partner Violence according to period. The dotted vertical line represents the pooled prevalence, with its associated 95% confidence interval
Fig. 1
Fig. 1
a Prevalence of any Intimate Partner Violence according to the region of sub-Saharan Africa. The dotted vertical line represents the pooled prevalence, with its associated 95% confidence interval. b Prevalence of any Intimate Partner Violence according to period. The dotted vertical line represents the pooled prevalence, with its associated 95% confidence interval
Fig. 2
Fig. 2
a The excess of Intimate Partner Violence prevalence among women in rural areas, compared to women in urban areas, by region of Africa. The dotted vertical line represents the pooled risk ratio, with its 95% confidence interval. The solid vertical line at the value of 1 represents no difference in IPV rates between the types of residence. b The excess of Intimate Partner Violence prevalence among women with less than a secondary education, compared to women with at least a secondary school education, by region of Africa. The dotted vertical line represents the pooled risk ratio, with its 95% confidence interval. The solid vertical line at the value of 1 represents no difference in IPV rates between the education levels
Fig. 2
Fig. 2
a The excess of Intimate Partner Violence prevalence among women in rural areas, compared to women in urban areas, by region of Africa. The dotted vertical line represents the pooled risk ratio, with its 95% confidence interval. The solid vertical line at the value of 1 represents no difference in IPV rates between the types of residence. b The excess of Intimate Partner Violence prevalence among women with less than a secondary education, compared to women with at least a secondary school education, by region of Africa. The dotted vertical line represents the pooled risk ratio, with its 95% confidence interval. The solid vertical line at the value of 1 represents no difference in IPV rates between the education levels
Fig. 3
Fig. 3
a The excess of Intimate Partner Violence prevalence among women aged 15–24 years in rural areas, compared to women of the same age group in urban areas, by region of Africa. The dotted vertical line represents the pooled risk ratio, with its 95% confidence interval. The solid vertical line at the value of 1 represents no difference in IPV rates between the types of residence. b The excess of Intimate Partner Violence prevalence among women aged 15–24 years in rural areas, compared to women of the same age group in urban areas, by period. The broken vertical line represents the pooled risk ratio, with its 95% confidence interval. The solid vertical line at the value of 1 represents no difference in IPV rates between the types of residence. c The excess of overall Intimate Partner Violence prevalence among women aged 25–49 years in rural areas, compared to women of the same age group in urban areas, by region of Africa. The broken vertical line represents the pooled risk ratio, with its 95% confidence interval. The solid vertical line at the value of 1 represents no difference in IPV rates between the types of residence. d The excess of Intimate Partner Violence prevalence among women aged 25–49 years in rural areas, compared to women of the same age group in urban areas, by period. The broken vertical line represents the pooled risk ratio, with its 95% confidence interval. The solid vertical line at the value of 1 represents no difference in IPV rates between the types of residence. e The excess of Intimate Partner Violence prevalence in women aged 15–24 with less than a secondary education, compared to women with at least a secondary school education, by region of Africa. The broken vertical line represents the pooled risk ratio, with its 95% confidence interval. The solid vertical line at the value of 1 represents no difference in IPV rates between the education levels. f The excess of Intimate Partner Violence prevalence in women aged 15–24 with less than a secondary education, compared to women with at least a secondary school education, by region of Africa. The broken vertical line represents the pooled risk ratio, with its 95% confidence interval. The solid vertical line at the value of 1 represents no difference in IPV rates between the education levels. g The excess of Intimate Partner Violence prevalence in women aged 25–49 with less than a secondary education, compared to women with at least a secondary school education, by region of Africa. The broken vertical line represents the pooled risk ratio, with its 95% confidence interval. The solid vertical line at the value of 1 represents no difference in IPV rates between the education levels. h The excess of Intimate Partner Violence prevalence in women aged 25–49 with less than a secondary education, compared to women with at least a secondary school education, by period. The broken vertical line represents the pooled risk ratio, with its 95% confidence interval. The solid vertical line at the value of 1 represents no difference in IPV rates between the education levels
Fig. 3
Fig. 3
a The excess of Intimate Partner Violence prevalence among women aged 15–24 years in rural areas, compared to women of the same age group in urban areas, by region of Africa. The dotted vertical line represents the pooled risk ratio, with its 95% confidence interval. The solid vertical line at the value of 1 represents no difference in IPV rates between the types of residence. b The excess of Intimate Partner Violence prevalence among women aged 15–24 years in rural areas, compared to women of the same age group in urban areas, by period. The broken vertical line represents the pooled risk ratio, with its 95% confidence interval. The solid vertical line at the value of 1 represents no difference in IPV rates between the types of residence. c The excess of overall Intimate Partner Violence prevalence among women aged 25–49 years in rural areas, compared to women of the same age group in urban areas, by region of Africa. The broken vertical line represents the pooled risk ratio, with its 95% confidence interval. The solid vertical line at the value of 1 represents no difference in IPV rates between the types of residence. d The excess of Intimate Partner Violence prevalence among women aged 25–49 years in rural areas, compared to women of the same age group in urban areas, by period. The broken vertical line represents the pooled risk ratio, with its 95% confidence interval. The solid vertical line at the value of 1 represents no difference in IPV rates between the types of residence. e The excess of Intimate Partner Violence prevalence in women aged 15–24 with less than a secondary education, compared to women with at least a secondary school education, by region of Africa. The broken vertical line represents the pooled risk ratio, with its 95% confidence interval. The solid vertical line at the value of 1 represents no difference in IPV rates between the education levels. f The excess of Intimate Partner Violence prevalence in women aged 15–24 with less than a secondary education, compared to women with at least a secondary school education, by region of Africa. The broken vertical line represents the pooled risk ratio, with its 95% confidence interval. The solid vertical line at the value of 1 represents no difference in IPV rates between the education levels. g The excess of Intimate Partner Violence prevalence in women aged 25–49 with less than a secondary education, compared to women with at least a secondary school education, by region of Africa. The broken vertical line represents the pooled risk ratio, with its 95% confidence interval. The solid vertical line at the value of 1 represents no difference in IPV rates between the education levels. h The excess of Intimate Partner Violence prevalence in women aged 25–49 with less than a secondary education, compared to women with at least a secondary school education, by period. The broken vertical line represents the pooled risk ratio, with its 95% confidence interval. The solid vertical line at the value of 1 represents no difference in IPV rates between the education levels

Similar articles

Cited by

References

    1. McCloskey LA, Boonzaier F, Steinbrenner SY, Hunter T. Determinants of intimate partner violence in sub-Saharan Africa: a review of prevention and intervention programs. Partn Abus. 2016;7(3):277–315. doi: 10.1891/1946-6560.7.3.277. - DOI
    1. García-Moreno C, Pallitto C, Devries K, Stöckl H, Watts C, Abrahams N. Global and regional estimates of violence against women. Geneva: World Health Organization; 2013.
    1. Devries KM, Mak JY, García-Moreno C, Petzold M, Child JC, Falder G, Lim S, Bacchus LJ, Engell RE, Rosenfeld L, Pallitto C, Vos T, Abrahams N, Watts CH. The global prevalence of intimate partner violence against women. Science. 2013;340(6140):1527–1528. doi: 10.1126/science.1240937. - DOI - PubMed
    1. Deyessa N, Berhane Y, Ellsberg M, Emmelin M, Kullgren G, Högberg U. Violence against women in relation to literacy and area of residence in Ethiopia. Glob Health Action. 2010;3(1):2070. doi: 10.3402/gha.v3i0.2070. - DOI - PMC - PubMed
    1. Mukamana J, Machakanja P, Adjei NK. Trends in prevalence and correlates of intimate partner violence against women in Zimbabwe, 2005–2015. BMC Int Health Human Rights. 2020;20(1):2. doi: 10.1186/s12914-019-0220-8. - DOI - PMC - PubMed

Publication types