

Identification of genes and pathways involved in malignant pleural mesothelioma using bioinformatics methods
- PMID: 33849532
- PMCID: PMC8045401
- DOI: 10.1186/s12920-021-00954-7
Identification of genes and pathways involved in malignant pleural mesothelioma using bioinformatics methods
Abstract
Background: Malignant pleural mesothelioma (MPM) is a rare tumor in the pleura. This study was carried out to identify key genes and pathways that may be involved in MPM.
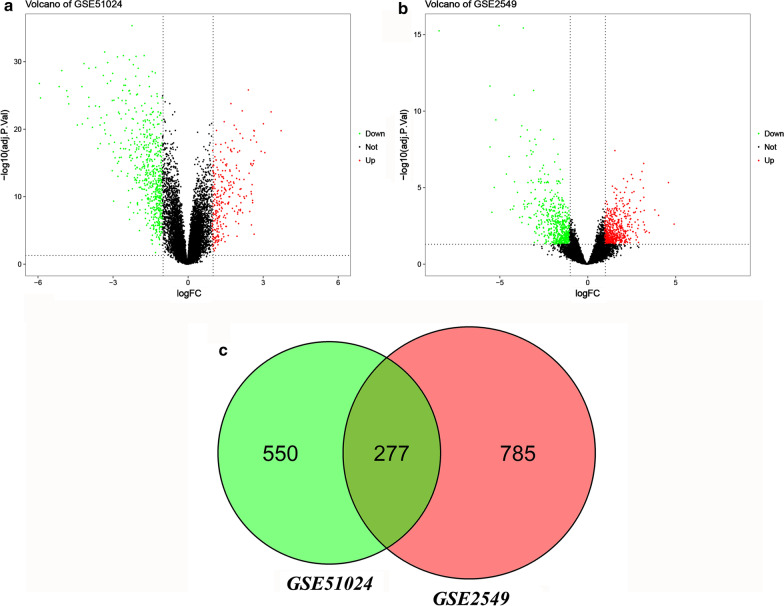
Methods: Microarray datasets GSE51024 and GSE2549 were analyzed for differentially expressed genes (DEGs) between normal and MPM tissues. The identified DEGs were subjected to functional analyses using bioinformatics tools.
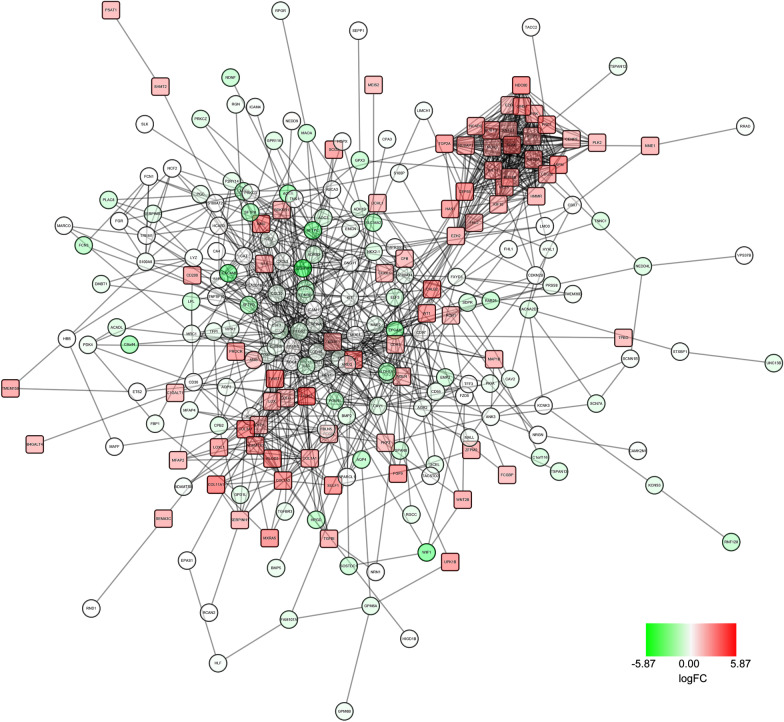
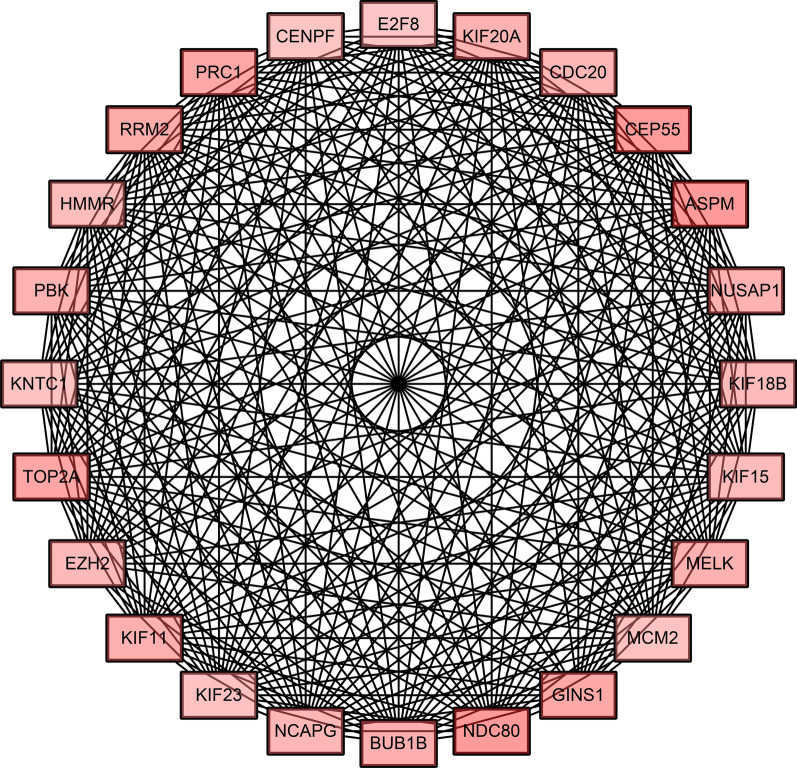
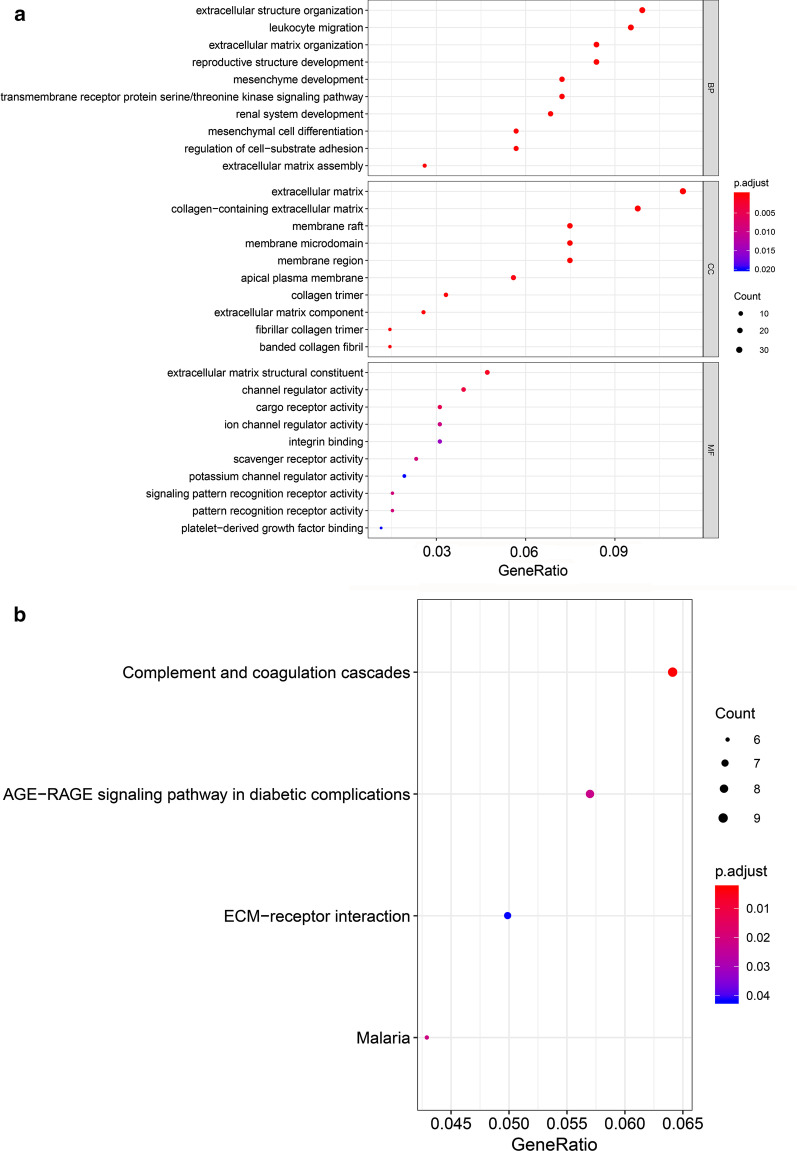
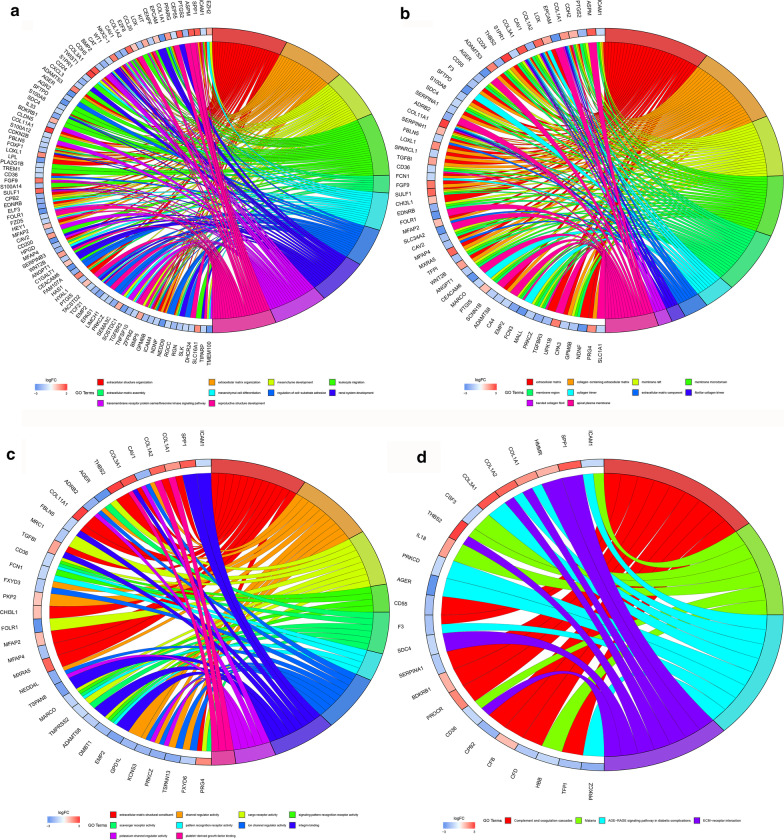
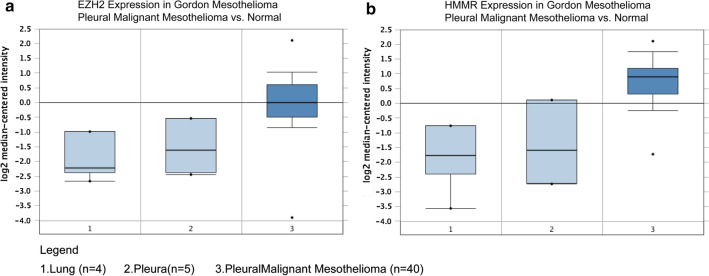
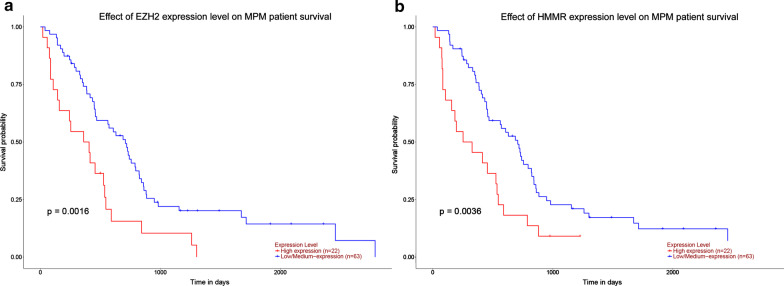
Results: A total of 276 DEGs were identified, consisting of 187 downregulated and 79 upregulated genes. Gene ontology and Kyoto encyclopedia of genes and genomes pathway enrichment analysis indicated that the DEGs were enriched in extracellular structure organization, extracellular matrix, and ECM-receptor interaction. Due to high degree of connectivity among 24 hub genes, EZH2 and HMMR are likely to play roles in the carcinogenesis and progression of MPM. The two genes were found over-expressed in MPM tissues. Patients with elevated EZH2 and HMMR expressions had poor overall survival.
Conclusions: EZH2 and HMMR are identified to be the hub genes for MPM and they may be further characterized to better understand the molecular mechanisms underlying the carcinogenesis of MPM.
Keywords: Bioinformatics; Cancer; Differentially expressed genes; Gene expression profile; Microarray; Protein–protein interaction.
Conflict of interest statement
The authors declare no competing interests.
Figures
Similar articles
-
Identification of Potential Hub Genes and Therapeutic Drugs in Malignant Pleural Mesothelioma by Integrated Bioinformatics Analysis.Oncol Res Treat. 2020;43(12):656-671. doi: 10.1159/000510534. Epub 2020 Oct 8. Oncol Res Treat. 2020. PMID: 33032291
-
[Prognostic significance and immune cell infiltration analysis of differentially expressed genes in malignant pleural mesothelioma].Zhonghua Lao Dong Wei Sheng Zhi Ye Bing Za Zhi. 2023 Sep 20;41(9):641-647. doi: 10.3760/cma.j.cn121094-20220704-00352. Zhonghua Lao Dong Wei Sheng Zhi Ye Bing Za Zhi. 2023. PMID: 37805421 Chinese.
-
Analysis of microRNA expression signatures in malignant pleural mesothelioma, pleural inflammation, and atypical mesothelial hyperplasia reveals common predictive tumorigenesis-related targets.Exp Mol Pathol. 2014 Dec;97(3):375-85. doi: 10.1016/j.yexmp.2014.09.016. Epub 2014 Sep 16. Exp Mol Pathol. 2014. PMID: 25236577
-
Secreted and Tissue miRNAs as Diagnosis Biomarkers of Malignant Pleural Mesothelioma.Int J Mol Sci. 2018 Feb 17;19(2):595. doi: 10.3390/ijms19020595. Int J Mol Sci. 2018. PMID: 29462963 Free PMC article. Review.
-
Heterogeneous Contributing Factors in MPM Disease Development and Progression: Biological Advances and Clinical Implications.Int J Mol Sci. 2018 Jan 13;19(1):238. doi: 10.3390/ijms19010238. Int J Mol Sci. 2018. PMID: 29342862 Free PMC article. Review.
Cited by
-
Comprehensive Analysis Identifies Hyaluronan Mediated Motility Receptor and Cell Division Cycle 25C as Potential Prognostic Biomarkers in Head and Neck Squamous Cell Carcinoma.Cancer Control. 2024 Jan-Dec;31:10732748241287904. doi: 10.1177/10732748241287904. Cancer Control. 2024. PMID: 39323031 Free PMC article.
-
A network-biology approach for identification of key genes and pathways involved in malignant peritoneal mesothelioma.Genomics Inform. 2021 Jun;19(2):e16. doi: 10.5808/gi.21019. Epub 2021 Jun 30. Genomics Inform. 2021. PMID: 34261301 Free PMC article.
-
Pathological Characterization of Tumor Immune Microenvironment (TIME) in Malignant Pleural Mesothelioma.Cancers (Basel). 2021 May 24;13(11):2564. doi: 10.3390/cancers13112564. Cancers (Basel). 2021. PMID: 34073720 Free PMC article. Review.
-
Advances in Immunotherapy of Malignant Pleural Mesothelioma.Onco Targets Ther. 2021 Aug 14;14:4477-4484. doi: 10.2147/OTT.S317434. eCollection 2021. Onco Targets Ther. 2021. PMID: 34429612 Free PMC article. Review.
-
Benefits and Challenges of Inhibiting EZH2 in Malignant Pleural Mesothelioma.Cancers (Basel). 2023 Feb 28;15(5):1537. doi: 10.3390/cancers15051537. Cancers (Basel). 2023. PMID: 36900330 Free PMC article. Review.
References
-
- Suveg K, Putora PM, Berghmans T, Glatzer M, Kovac V, Cihoric N. Current efforts in research of pleural mesothelioma—an analysis of the ClinicalTrials.gov registry. Lung Cancer. 2018;124:12–8. doi: 10.1016/j.lungcan.2018.07.007. - DOI - PubMed
MeSH terms
Substances
Grants and funding
LinkOut - more resources
Full Text Sources
Other Literature Sources
Medical
