. 2021 Apr 13;19(1):72.
doi: 10.1186/s12915-021-00997-3.

Rac1 activation can generate untemplated, lamellar membrane ruffles

Affiliations

Rac1 activation can generate untemplated, lamellar membrane ruffles

F Leyden et al. BMC Biol. .

Abstract

Background: Membrane protrusions that occur on the dorsal surface of a cell are an excellent experimental system to study actin machinery at work in a living cell. Small GTPase Rac1 controls the membrane protrusions that form and encapsulate extracellular volumes to perform pinocytic or phagocytic functions.

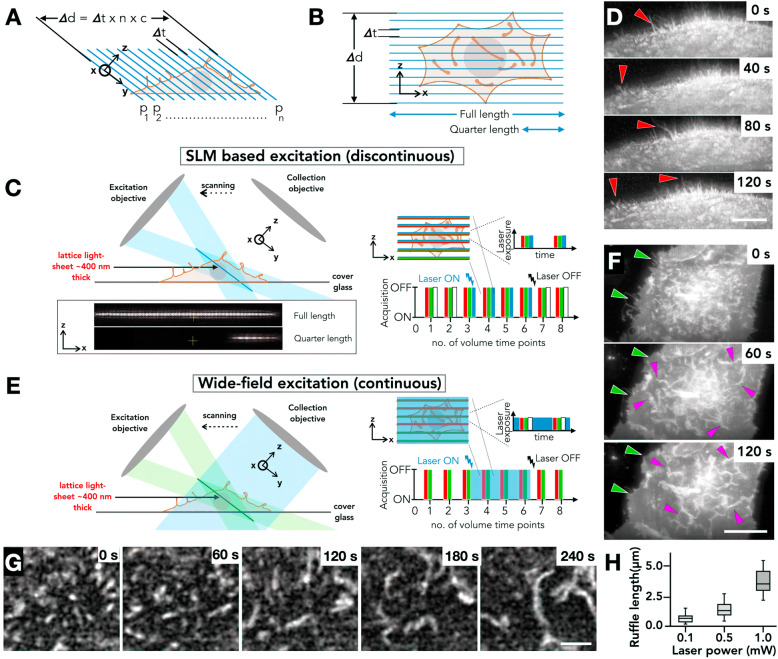
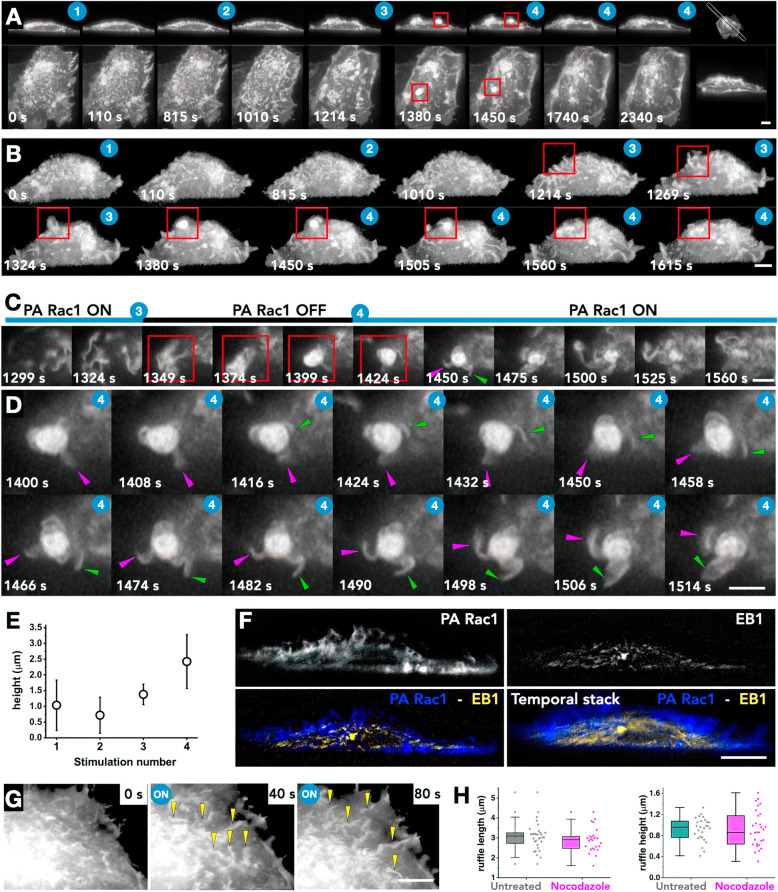
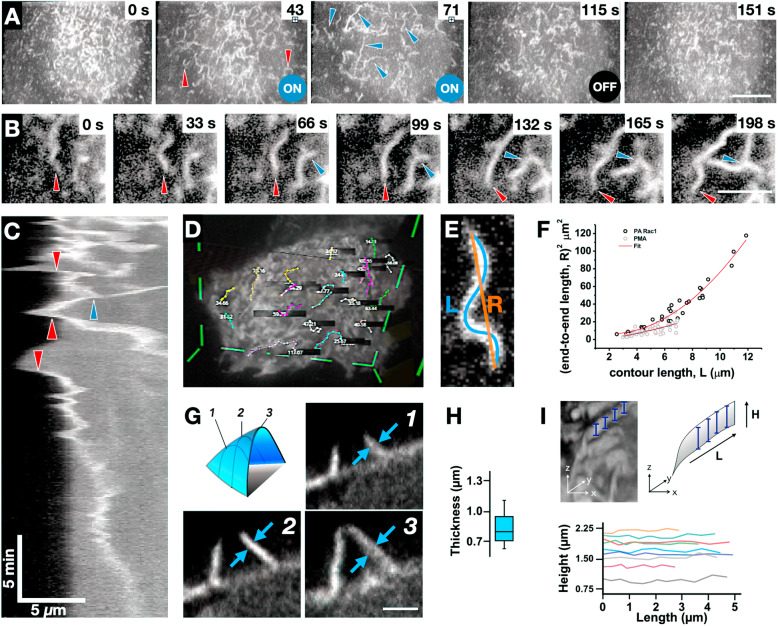
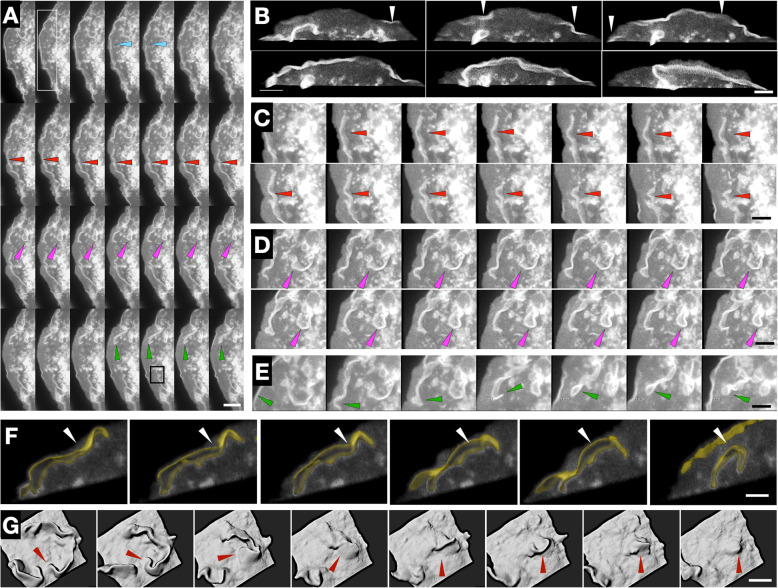
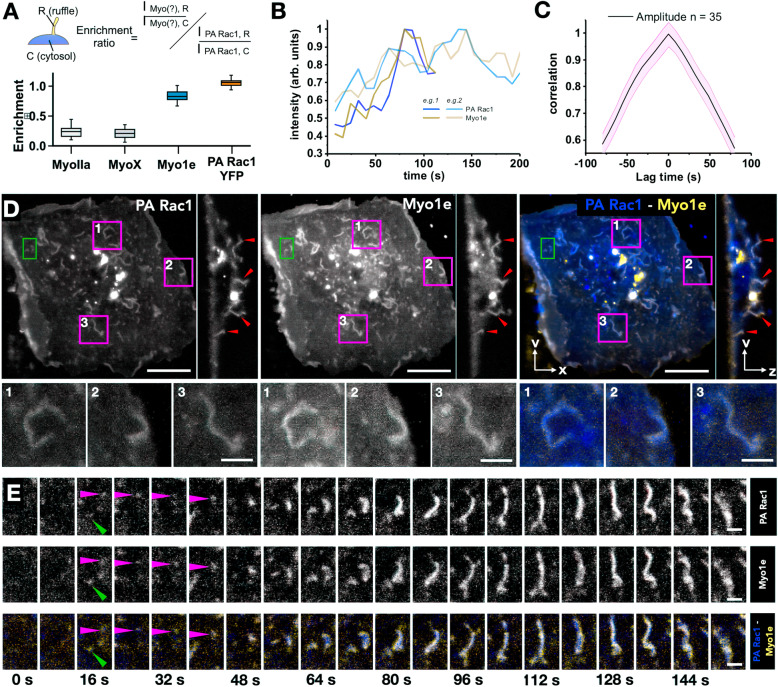
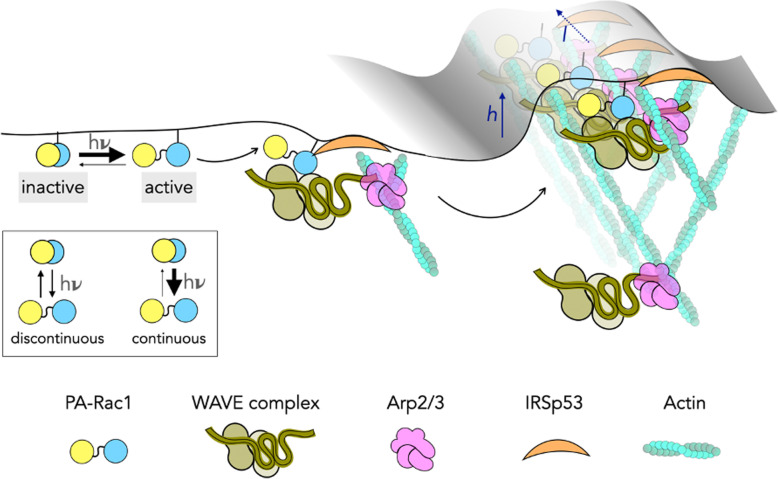
Results: Here, capitalizing on rapid volumetric imaging capabilities of lattice light-sheet microscopy (LLSM), we describe optogenetic approaches using photoactivable Rac1 (PA-Rac1) for controlled ruffle generation. We demonstrate that PA-Rac1 activation needs to be continuous, suggesting a threshold local concentration for sustained actin polymerization leading to ruffling. We show that Rac1 activation leads to actin assembly at the dorsal surface of the cell membrane that result in sheet-like protrusion formation without any requirement of a template. Further, this approach can be used to study the complex morpho-dynamics of the protrusions or to investigate specific proteins that may be enriched in the ruffles. Deactivating PA-Rac1 leads to complex contractile processes resulting in formation of macropinosomes. Using multicolour imaging in combination with these approaches, we find that Myo1e specifically is enriched in the ruffles.

Conclusions: Combining LLSM and optogenetics enables superior spatial and temporal control for studying such dynamic mechanisms. Demonstrated here, the techniques implemented provide insight into the complex nature of the molecular interplay involved in dynamic actin machinery, revealing that Rac1 activation can generate untemplated, lamellar protrusions.

Keywords: Actin polymerization; Lamellipodia; Lattice light-sheet microscopy; Optogenetics; Rac1.


Conflict of interest statement

The authors declare no competing financial interests.

Figures

Fig. 1.
Fig. 1.
Optogenetic stimulation of PA-Rac1 on a lattice light-sheet microscope. a Volumetric acquisition using LLSM. b Top-down view of LLSM acquisition of a cell, in comparison to the lattice light-sheet excitation plane. c Schematic representation of optogenetic excitation using the SLM to produce controlled 445-nm excitation, shown in right panel. Using the SLM in the excitation path results in discontinuous excitation. d RPE1 cell stimulated using SLM-based excitation (as described in c) of PA-Rac1 does not suppress filopodia (red arrows) and no ruffles are observed. Scale bar = 5 μm. e Schematic representation of wide-field optogenetic excitation passed through the detection objective leading to continuous excitation, shown in right panel. f Dorsal membrane ruffles (magenta arrows) and increased protrusion along the coverslip (green arrows) produced following wide-field optogenetic stimulation (as described in e). Scale bar = 10 μm. g Growth of PA-Rac1 ruffles in response to photoactivation. Scale bar = 3 μm. h Boxplot of PA-Rac1 ruffle length (μm) vs photoactivation laser power (mW). Outer range shows total range, box height shows the standard deviation, and inner bar shows mean (n = 45 ruffles)
Fig. 2.
Fig. 2.
Repeated optogenetic activation leads to incremental increases in protrusion length. a Montage of PA-Rac1 membrane ruffles in whole RPE1 cells in response to multiple optogenetic stimulations (Additional file 4: Movie S4). Left to right shows changes in Rac1 with time. Top panel shows a 2D slice through the cell (as marked in the last panel). Bottom panels show top views. The blue number overlays indicate the sequential optogenetic stimulation. The red square highlights a collapse following a photoactivation laser switch off. Scale bars for both panels = 5 μm. b Montage of ruffle evolution in response to multiple optogenetic stimulations of PA-Rac1. With multiple excitations, the ruffles become longer, extruding larger sheet like protrusions. Scale bar = 5 μm. c A temporal zoomed montage of red box in ac. Formation of highly complex collapsed membrane folds post PA-Rac1 inactivation [3] and unfurling of the complex folds upon re-activation of PA-Rac1 [4]. Frames every 20 s. d Unfurling of complex membrane folds undergoing rotational movements with polymerization at ‘leading edges’ of the ruffles. The magenta and green arrows follow the same protrusions across the montage. Frames every 4 s. e Graph of ruffle height vs the number of times stimulated with 445-nm laser. Error bars indicate standard deviation (n = 5 cells, 34 ruffles). f Cross-sectional slice of RPE1 cell transfected with PA-Rac1 (blue) and EB1 (yellow). Bottom right panel shows a temporal stack MIP over 10 min. Scale bar = 5 μm. g Ruffle formation in nocodazole-treated cells (yellow arrows). Scale bar = 3 μm. h Ruffle lengths and widths show no difference between untreated cells and nocodazole-treated cells (n 25 ruffles, 3 cells)
Fig. 3.
Fig. 3.
PA-Rac1 ruffles are lamellar structures that are formed and maintained by actin polymerization. a Representative montage of ruffle formation and elongation in response to optogenetic stimulation in RPE1 cells. Red arrows indicate highly curved membrane ruffles stimulated by PMA; blue arrows indicate large ruffles formed in response to optogenetic stimulation. Scale Bar = 10 μm. b Representative montage of PA-Rac1 stimulated ruffle dynamics. Red arrows show the growing end of the ruffle, blue arrows show branching points. Scale bar = 3 μm. c Kymograph of PA-Rac1 signal at a lamellipodial edge during Rac1 stimulation. The red arrows represent lift-offs of lamellipodia (LOL) and blue arrow points at a merger of two ruffles. X scale bar = 5 μm, Y scale bar = 5 min. d Representative screen capture showing measurements of membrane ruffle contours using Syglass VR. e Representative diagram showing squared end-to-end length (R), and contour length (L) overlaid on a top view of a ruffle. f Squared end-to-end length vs. Contour length of ruffles stimulated by PMA (grey) or PA-Rac1 (black). Curve of fit (red) corresponds to the persistence length derived from the 2D worm-like chain model. g Representative images showing the measurement of ruffle thickness (blue arrows). Image panels show slices through a macropinocytic cup as portrayed in the top left panel. Scale bar = 3 μm. h Boxplot of membrane ruffle thickness (μm). Outer range shows total range, box height shows the standard deviation, and inner bar shows mean. i Representative images showing extraction of ruffle protrusion height. Measured height shown by blue bars top right, overlay top left. Bottom shows ruffle height (μm) vs length (μm). Measurements were taken for 9 representative ruffles
Fig. 4.
Fig. 4.
PMA and PA-Rac1 together give rise to complex coalescence of membrane protrusions. a Montage of PA-Rac1 ruffle coalescence in RPE1 cells treated with PMA (100 nM); figure runs from left to right, top to bottom (Additional file 8: Movie S8). Scale bar = 15 μm. b Insert from Fig. 3a. Marked by the white rectangle, montage of PA-Rac1 ruffle formation with optogenetic stimulation. Arrows indicate ruffle formation. Scale bar = 4 μm. c Insert from Fig. 3a. Indicated by red arrows, montage of ruffle contraction post Rac1 stimulation. Scale bar = 5 μm. d Insert from Fig. 3a. Marked by magenta arrows; montage of ruffle closing, indicated by magenta arrows. Scale bar = 5 μm. e Insert from Fig. 3a, marked by the green arrows; montage of ruffle collapses following Rac1 inactivation, indicated by green arrows. Scale bar = 5 μm. f Insert from Fig. 3a. Marked by black square; montage of ruffle buckling. The segmented ruffles are represented by yellow surface. Scale bar = 3 μm. g Montage of Rac1 ruffle collapse leading to cup-closure as a surface rendered volume. Scale bar = 4 μm
Fig. 5.
Fig. 5.
Myo1e colocalizes to dorsal membrane ruffles. a Boxplot of the enrichment ratio of investigated proteins in membrane ruffles, as determined by the equation above (see the ‘Methods’ section). Bars show range, the inner box shows S.D., and inner bar shows the mean value. n = 4 cells each, > 40 ruffles. b Normalized PA-Rac1 and Myo1e intensities with time (seconds) for two example membrane ruffles. c Correlation of PA-Rac1 and Myo1e signals. Correlation measured from 35 ruffles. d Top, MIP and cross-section of PA-Rac1 (blue) and Myo1e (yellow). Pink boxes refer to zoomed panels, bottom. Red arrows highlight colocalizing dorsal ruffles. Green box refers to zoomed time series (e). Scale bar = 5 μm. e Time series of PA-Rac1 (blue) and Myo1e (yellow). Scale bar = 1.25 μm
Fig. 6.
Fig. 6.
Summary figure of threshold-based assembly of lamellar ruffles generated by PA-Rac1

References

    1. Swanson JA, Watts C. Macropinocytosis. Trends Cell Biol. 1995;5(11):424–428. doi: 10.1016/S0962-8924(00)89101-1. - DOI - PubMed
    1. Swanson JA. Shaping cups into phagosomes and macropinosomes. Nat Rev Mol Cell Biol. 2008;9(8):639–649. doi: 10.1038/nrm2447. - DOI - PMC - PubMed
    1. Yoshida S, Hoppe AD, Araki N, Swanson JA. Sequential signaling in plasma-membrane domains during macropinosome formation in macrophages. J Cell Sci. 2009;122(18):3250–3261. doi: 10.1242/jcs.053207. - DOI - PMC - PubMed
    1. Ridley AJ. Membrane ruffling and signal transduction. BioEssays. 1994;16(5):321–327. doi: 10.1002/bies.950160506. - DOI - PubMed
    1. Buccione R, Orth JD, McNiven MA. Foot and mouth: podosomes, invadopodia and circular dorsal ruffles. Nat Rev Mol Cell Biol. 2004;5(8):647–657. doi: 10.1038/nrm1436. - DOI - PubMed

Publication types

MeSH terms