. 2021 Apr 13;17(1):40.
doi: 10.1186/s13007-021-00742-5.

Experimental comparison of two methods to study barley responses to partial submergence

Affiliations

Experimental comparison of two methods to study barley responses to partial submergence

Alexandra Miricescu et al. Plant Methods. .

Abstract

Background: Crop yield is dependent on climate conditions, which are becoming both more variable and extreme in some areas of the world as a consequence of global climate change. Increased precipitation and flooding events are the cause of important yield losses due to waterlogging or (partial) submergence of crops in the field. Our ability to screen efficiently and quickly for varieties that have increased tolerance to waterlogging or (partial) submergence is important. Barley, a staple crop worldwide, is particularly sensitive to waterlogging. Screening for waterlogging tolerant barley varieties has been ongoing for many years, but methods used to screen vary greatly, from the type of soil used to the time at which the treatment is applied. This variation makes it difficult to cross-compare results.

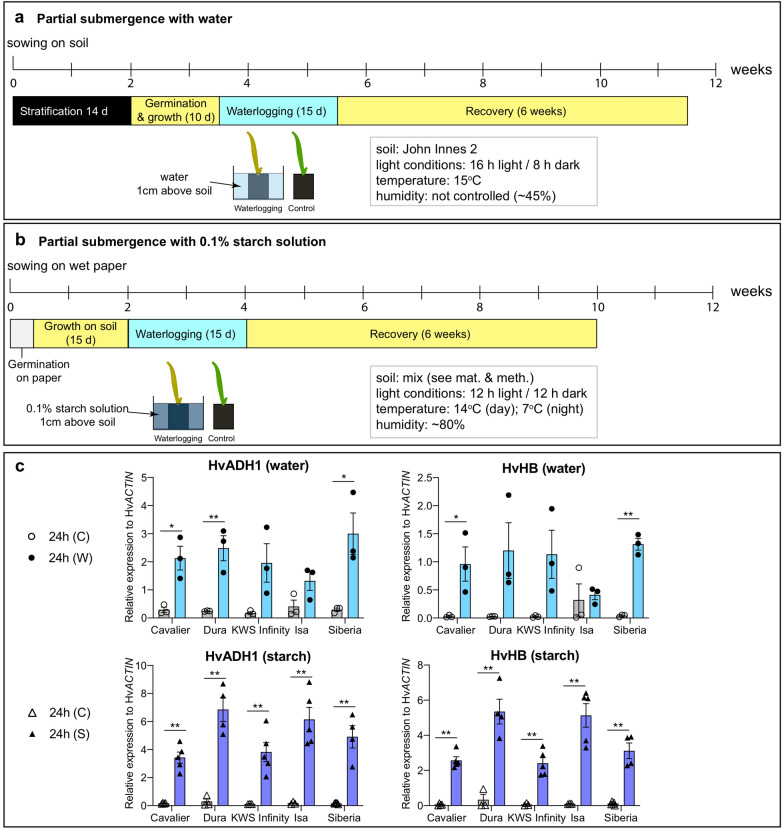
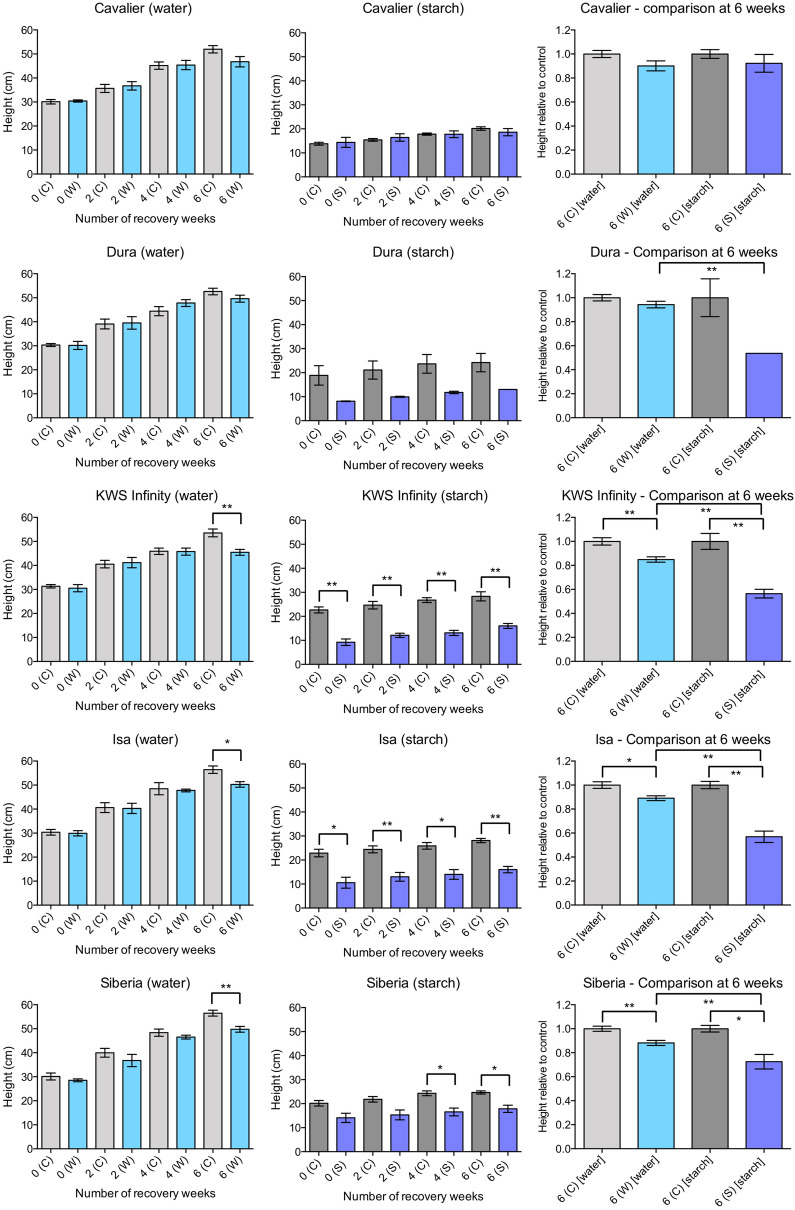
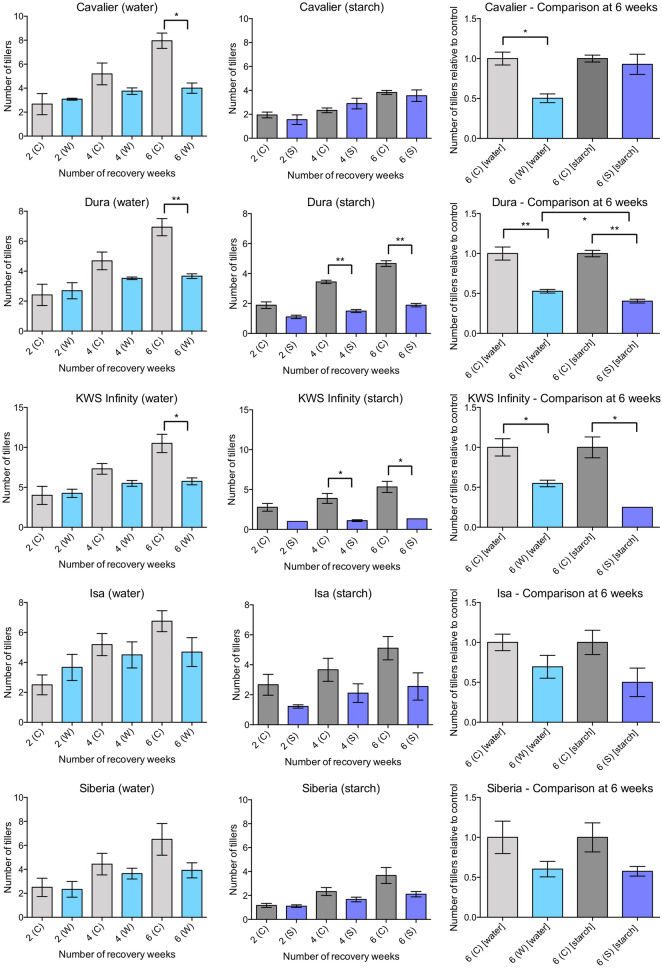
Results: Here, we have devised a scoring system to assess barley tolerance to waterlogging and compare two different methods when partial submergence is applied with either water or a starch solution at an early developmental stage, which is particularly sensitive to waterlogging or partial submergence. The use of a starch solution has been previously shown to result in more reducing soil conditions and has been used to screen for waterlogging tolerance.

Conclusions: Our results show that the two methods provide similar results to qualitatively rank varieties as tolerant or sensitive, while also affecting plants differently, in that application of a starch solution results in stronger and earlier symptoms than applying partial submergence with water.

Keywords: Barley; Crop improvement; Screening; Waterlogging.


Conflict of interest statement

The authors declare that they have no competing interests.

Figures

Fig. 1
Fig. 1
Overview of the growth conditions used in this study. a Growth conditions when applying partial submergence with water. Plants were grown for 10 days (at which point, two leaves had emerged). Partial submergence was applied by transferring the pots to a large tub filled with tap water 1 cm above soil level. The plants were kept in the same growth conditions during the duration of the experiment. Control plants were left in the same growth conditions but received normal watering. For the recovery period, plants were taken out of the water and kept in the same growth conditions with a normal watering regime. b Experimental conditions used when partial submergence with a 0.1% starch solution was applied. This protocol was adapted from Mano and Takeda [22]. The plants were grown for 15 days (two visible leaves), after which half of the pots were transferred to a large container filled with a 0.1% (w/v) starch solution, with solution reaching 1 cm above soil level. The plants were kept in the same growth conditions. Control plants were left in the same growth conditions but received normal watering. For the recovery period, plants were taken out of the 0.1% starch solution and kept in the same growth conditions with a normal watering regime. Detailed experimental conditions are provided in Materials and Methods. c Gene expression changes for two core hypoxia response genes (HvADH1 and HvHB) under control conditions (24 h (C)) and after 24 h of partial submergence with either water (24 h (W)) or a 0.1% starch solution (24 h (S)). Average expression relative to that of the reference gene (HvACTIN) is shown (3 to 4 independent replicates were carried out; 3 roots pooled per replicate and conditions). Error bars correspond to standard error of the mean. Significant statistical differences (determined using Student’s t-test) are indicated with: 0.01; * for p-value < 0.05
Fig. 2
Fig. 2
Effect of partial submergence with water or a 0.1% starch solution on chlorophyll content. SPAD values for leaf 1 were determined using a hand-held SPAD meter. Data on the left was obtained for plants subjected to partial submergence with water or control conditions. Three independent replicates were performed, with four plants per replicate for each condition. Data in the centre was obtained when partial submergence was applied using a 0.1% starch solution or under control conditions. Three independent replicates were performed, with the number of plants used per replicate varying between one and three. Data on the right represent SPAD values after partial submergence relative to the SPAD values obtained with control plants for a given variety. Mean values and standard error of the mean for the three replicates are shown. Statistical significance of the differences was determined using a Welch’s t-test because of unequal variance and sample sizes. Significant statistical differences are indicated with: ** for p-values < 0.01; * for p-value < 0.05
Fig. 3
Fig. 3
Average scores during recovery after partial submergence with water or with a 0.1% starch solution. Data on the left was obtained for plants subjected to partial submergence with water. Three independent replicates were performed, with three to four plants per replicate for each condition (with the exception of the 2-week time point, for which only one plant was used in one of the replicates with Cavalier and Dura). Data on the right was obtained when partial submergence was applied using a 0.1% starch solution. Three independent replicates were performed, with three plants per replicate (with the exception of Dura, for which only two plants were used in one of the replicates). Mean values and standard error of the mean for the three replicates are shown. Significant statistical differences (determined using a Welch’s t-test) are indicated with: ** for p-values < 0.01; * for p-value < 0.05
Fig. 4
Fig. 4
Average plant height during recovery after partial submergence with water or with a 0.1% starch solution. Data on the left was obtained for plants subjected to partial submergence with water or control conditions. Four independent replicates were performed, with three to four plants per replicate for each condition. Data in the centre was obtained when partial submergence was applied using a 0.1% starch solution or under control conditions. Three independent replicates were performed, with two to three plants per replicate for the 0.1% starch treatment. For control conditions with Siberia, the data is representative of two independent replicates with three plants per replicate. Mean values and standard error of the mean for the three replicates are shown. Data on the right represent plant height after partial submergence relative to the height of control plants for a given variety. Significant statistical differences (determined using a Welch’s t-test) are indicated with: ** for p-values < 0.01; * for p-value < 0.05
Fig. 5
Fig. 5
Average number of tillers during recovery after partial submergence with water or with a 0.1% starch solution. Data on the left was obtained for plants subjected to partial submergence with water or control conditions. Four independent replicates were performed, with three to four plants per replicate for each condition. Data in the centre was obtained when partial submergence was applied using a 0.1% starch solution or under control conditions. Three independent replicates were performed, with two to three plants per replicate for the 0.1% starch treatment. For control conditions with Siberia, the data is representative of two independent replicates with three plants per replicate. Mean values and standard error of the mean for the three replicates are shown. Data on the right represent the number of tillers after partial submergence relative to the number of tillers of control plants for a given variety. Statistical significance of the differences was determined using a Welch’s t-test. Significant statistical differences are indicated with: ** for p-values < 0.01; * for p-value < 0.05
Fig. 6
Fig. 6
Ranking of barley varieties based on the two methods applied. Based on each of the traits monitored, varieties that seemed to be the least affected by the partial submergence treatments compared to control plants of the same variety were classified as tolerant (blue). In contrast, varieties that were more strongly negatively affected by the partial submergence were classified as sensitive (orange). Traits for which no significant differences could be detected between control and treated plants are indicated in grey. SPAD and chl a/b measurements were performed during the partial submergence treatment (indicated by dark purple line underneath), while other traits were monitored during the recovery period (highlighted by green line). Note that for the ‘score’ category, ranking was done at day 0 of the recovery for treatment with 0.1% starch, while for partial submergence for water, the scores at four and 6 weeks of recovery were taken into account

References

    1. Bailey-Serres J, Lee SC, Brinton E. Waterproofing crops: effective flooding survival strategies. Plant Physiol. 2012;160(4):1698–1709. doi: 10.1104/pp.112.208173. - DOI - PMC - PubMed
    1. Bailey-Serres J, Fukao T, Gibbs DJ, Holdsworth MJ, Lee SC, Licausi F, Perata P, Voesenek LA, van Dongen JT. Making sense of low oxygen sensing. Trends Plant Sci. 2012;17(3):129–138. doi: 10.1016/j.tplants.2011.12.004. - DOI - PubMed
    1. Sasidharan R, Bailey-Serres J, Ashikari M, Atwell BJ, Colmer TD, Fagerstedt K, Fukao T, Geigenberger P, Hebelstrup KH, Hill RD, et al. Community recommendations on terminology and procedures used in flooding and low oxygen stress research. New Phytol. 2017;214(4):1403–1407. doi: 10.1111/nph.14519. - DOI - PubMed
    1. Vervuren PJA, Blom CWPM, de Kroon H. Extreme flooding events on the Rhine and the survival and distribution of riparian plant species. J Ecol. 2003;91:135–146. doi: 10.1046/j.1365-2745.2003.00749.x. - DOI
    1. Voesenek LA, Bailey-Serres J. Flood adaptive traits and processes: an overview. New Phytol. 2015;206(1):57–73. doi: 10.1111/nph.13209. - DOI - PubMed

LinkOut - more resources