. 2021 Apr 13;14(1):60.
doi: 10.1186/s13045-021-01072-8.

CLK1/SRSF5 pathway induces aberrant exon skipping of METTL14 and Cyclin L2 and promotes growth and metastasis of pancreatic cancer

Affiliations

CLK1/SRSF5 pathway induces aberrant exon skipping of METTL14 and Cyclin L2 and promotes growth and metastasis of pancreatic cancer

Shi Chen et al. J Hematol Oncol. .

Abstract

Background: Both aberrant alternative splicing and m6A methylation play complicated roles in the development of pancreatic cancer (PC), while the relationship between these two RNA modifications remains unclear.

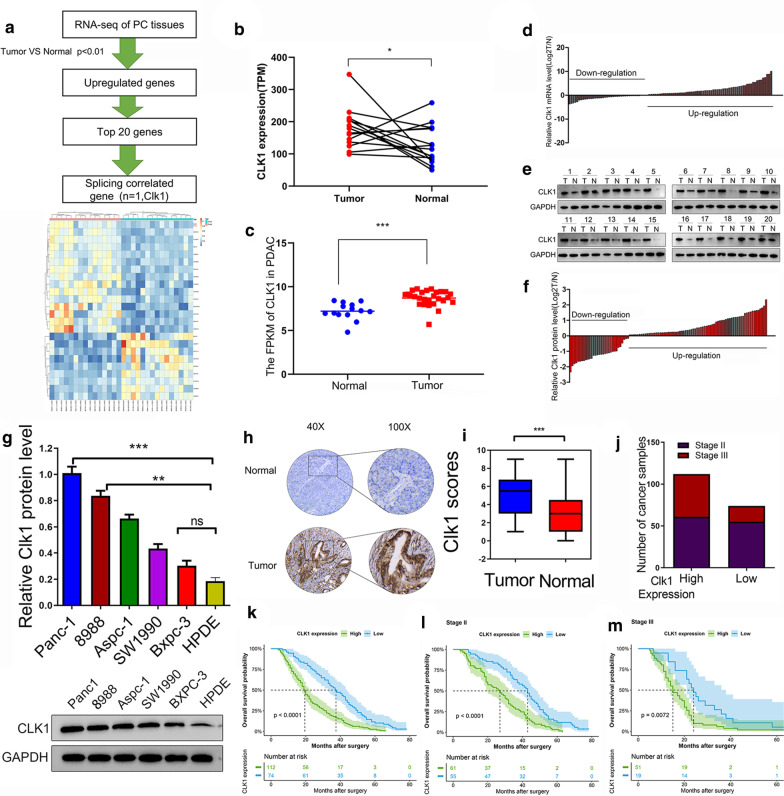
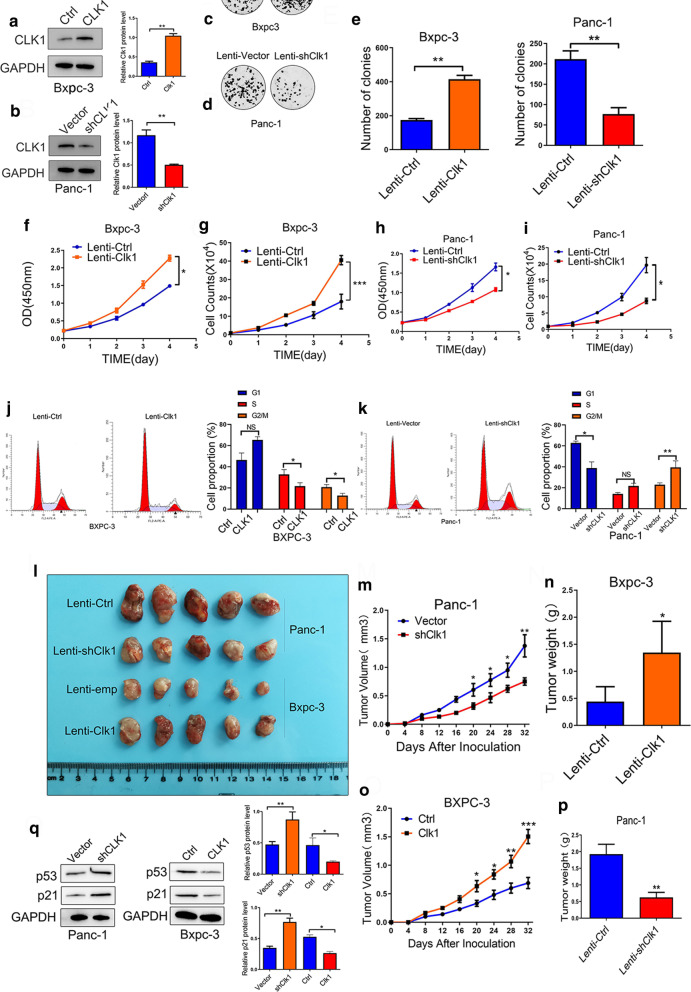
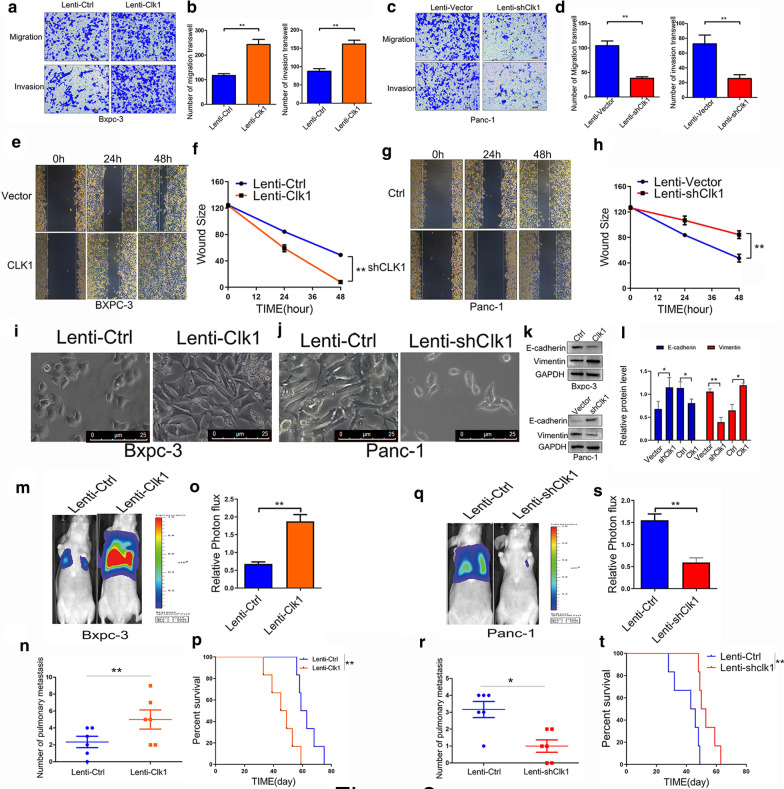
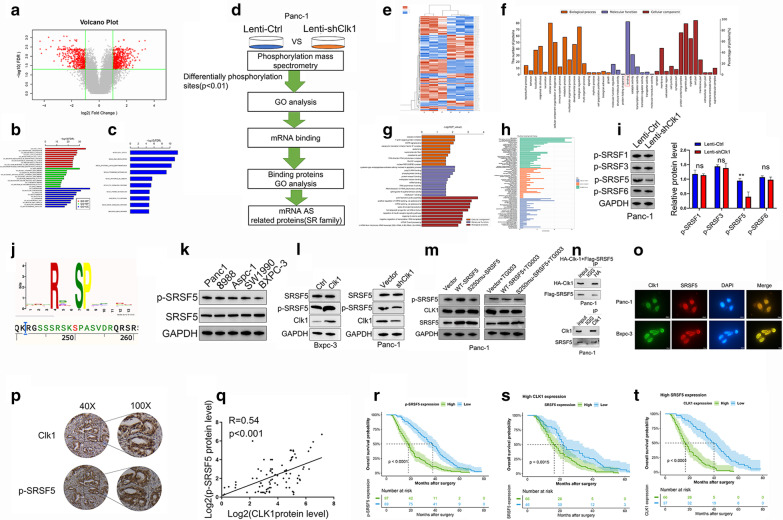
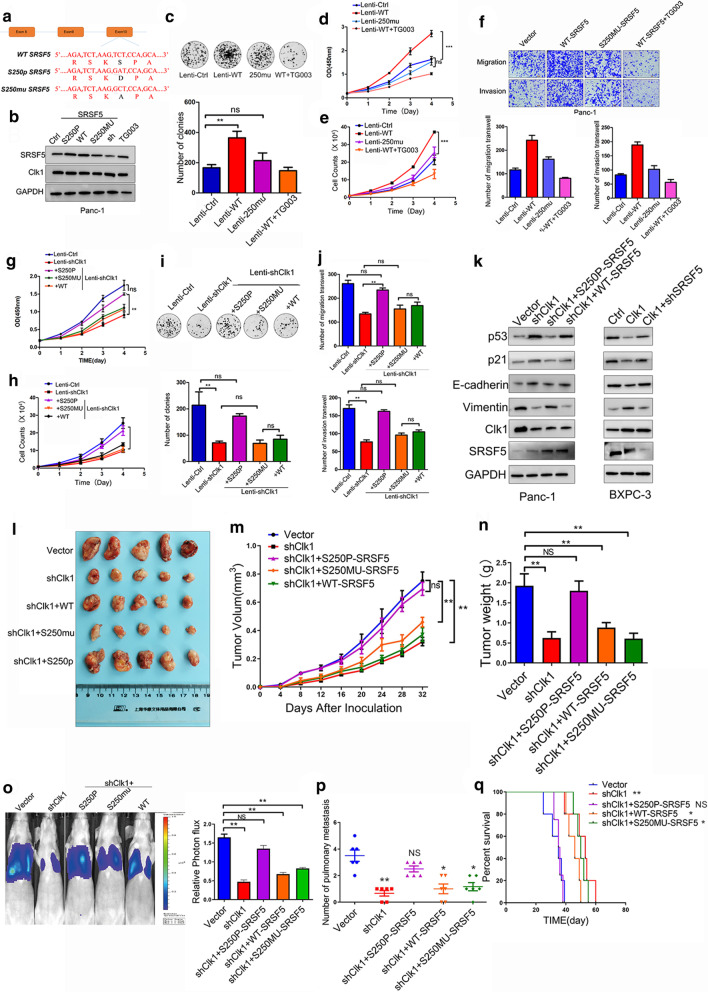
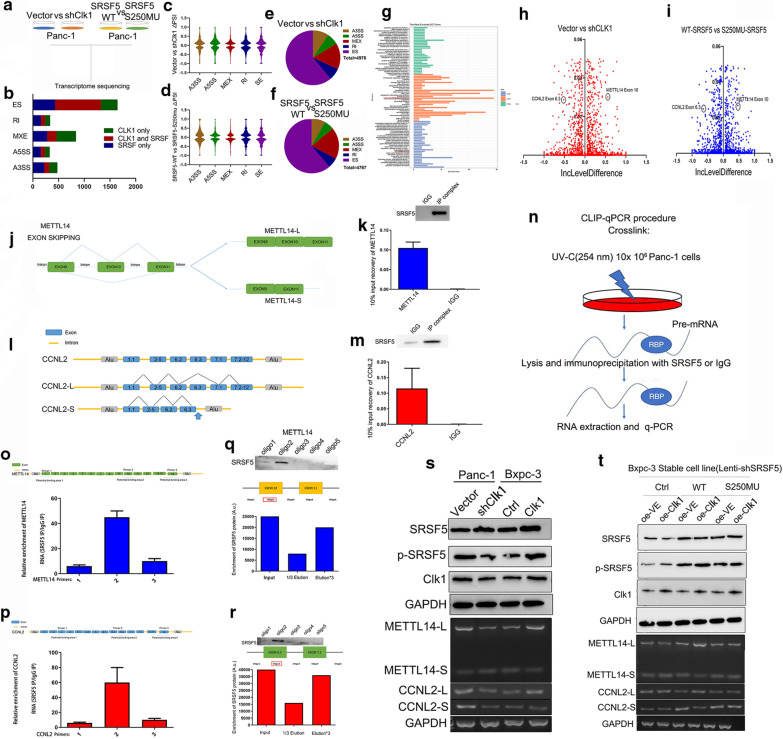
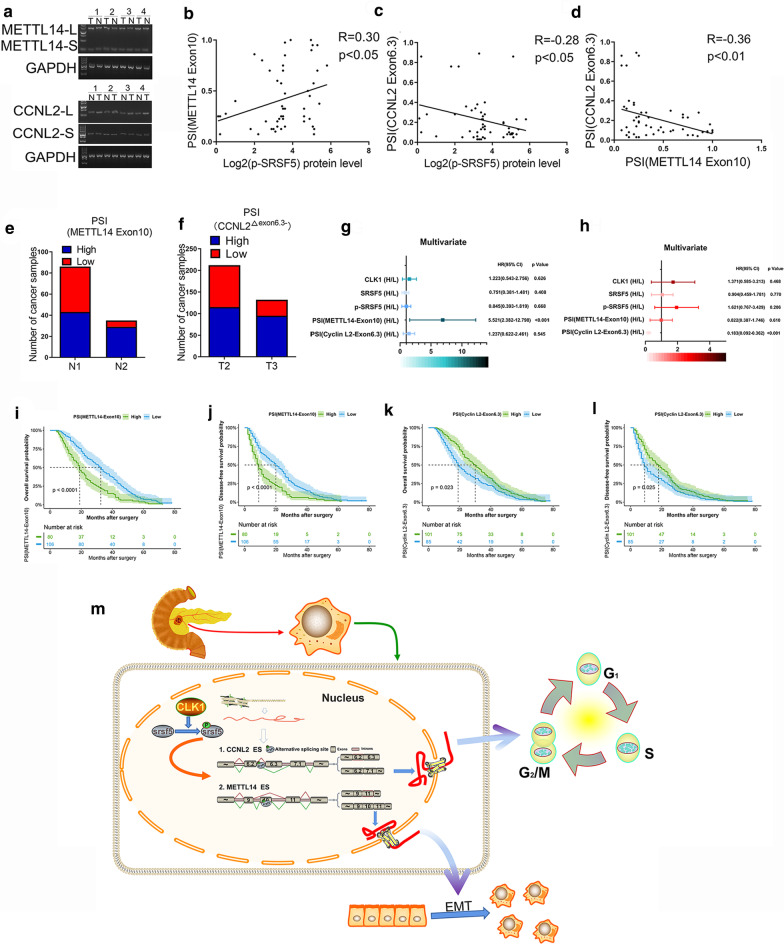
Methods: RNA sequencing (RNA-seq) was performed using 15 pairs of pancreatic ductal adenocarcinoma (PDAC) tissues and corresponding normal tissues, and Cdc2-like kinases 1 (CLK1) was identified as a significantly upregulated alternative splicing related gene. Real-time quantitative PCR (qPCR) and western blotting were applied to determine the CLK1 levels. The prognostic value of CLK1 was elucidated by Immunohistochemistry (IHC) analyses in two independent PDAC cohorts. The functional characterizations and mechanistic insights of CLK1 in PDAC growth and metastasis were evaluated with PDAC cell lines and nude mice. SR-like splicing factors5250-Ser (SRSF5250-Ser) was identified as an important target phosphorylation site by phosphorylation mass spectrometry. Through transcriptome sequencing, Methyltransferase-like 14exon10 (METTL14exon10) and Cyclin L2exon6.3 skipping were identified as key alternative splicing events regulated by the CLK1-SRSF5 axis. RIP assays, RNA-pulldown and CLIP-qPCR were performed to confirm molecular interactions and the precise binding sites. The roles of the shift of METTL14exon 10 and Cyclin L2exon6.3 skipping were surveyed.

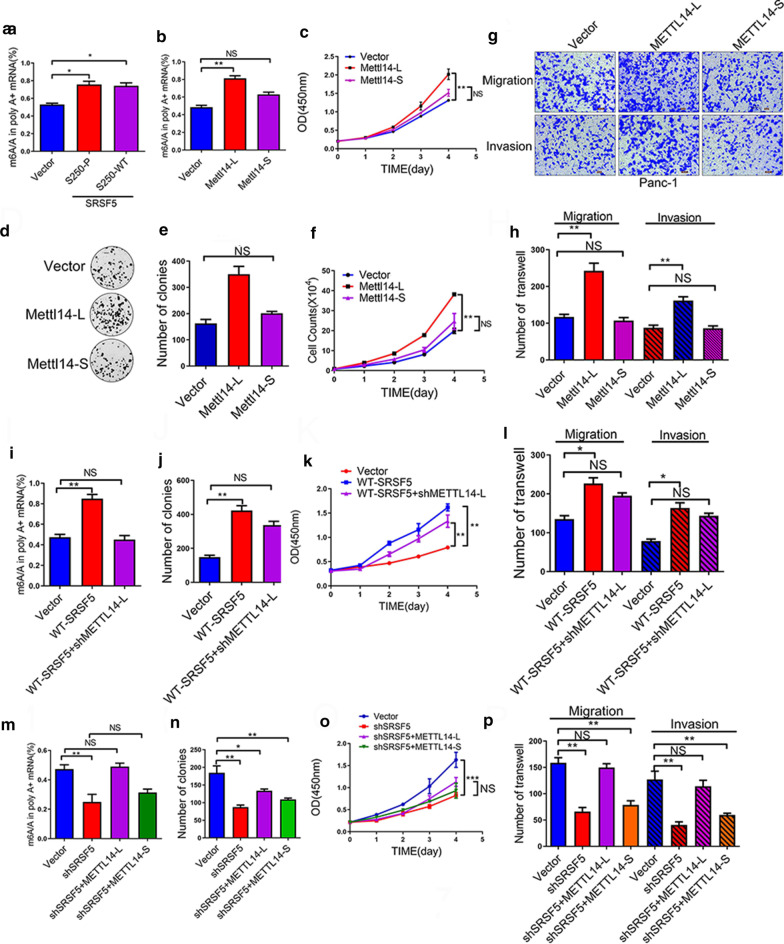
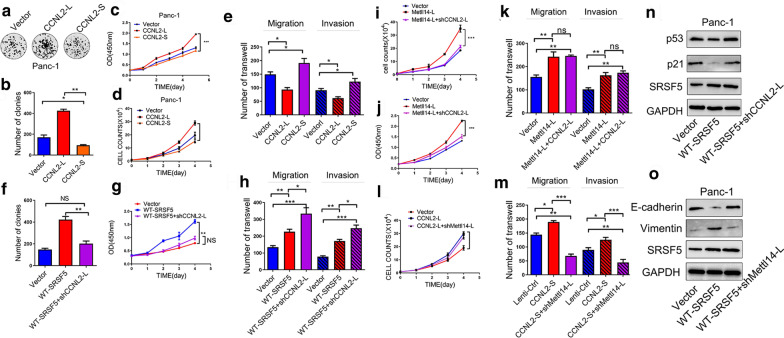
Results: CLK1 expression was significantly increased in PDAC tissues at both the mRNA and protein levels. High CLK1 expression was associated with poor prognosis. Elevated CLK1 expression promoted growth and metastasis of PC cells in vitro and in vivo. Mechanistically, CLK1 enhanced phosphorylation on SRSF5250-Ser, which inhibited METTL14exon10 skipping while promoted Cyclin L2exon6.3 skipping. In addition, aberrant METTL14exon 10 skipping enhanced the N6-methyladenosine modification level and metastasis, while aberrant Cyclin L2exon6.3 promoted proliferation of PDAC cells.

Conclusions: The CLK1/SRSF5 pathway induces aberrant exon skipping of METTL14 and Cyclin L2, which promotes growth and metastasis and regulates m6A methylation of PDAC cells. This study suggests the potential prognostic value and therapeutic targeting of this pathway in PDAC patients.

Keywords: Alternative splicing; CLK1; Cyclin L2; M6A Modification; METTL14; Pancreatic cancer; SRSF5.


Conflict of interest statement

Shi Chen, Can Yang, Zu-Wei Wang, Jian-Fei Hu contributed equally to this work and all should be considered as co-first author. Shi Chen, Yao-Dong Wang, Yi-Feng Tian, Bai-Yong Shen also contributed equally, and all should be considered as co corresponding author. The authors declare that they have no competing interests.

Figures

Fig. 1
Fig. 1
The expression and prognostic value of CLK1 in Human pancreatic cancer. a Flowchart showing the screening process of candidate genes by RNA-seq of normal tissues and PC tissues and alternative splicing analyses. b, c The TPM (transcripts per million (b); and FPKM (fragments per kilobase million (c)) of CLK1 in pancreatic tumor and adjacent normal tissues from GEO database were analyzed. n = 15 for normal tissues, n = 26 for tumor tissues. d The mRNA levels of CLK1 in 102 pairs of PDAC tumor and adjacent normal tissues were measured by qPCR. e, f Representative images of CLK1 protein levels in PDAC tumor and adjacent normal tissues by western blot assays (e). The changes of CLK1 protein expression in 103 pairs normal and tumor tissues were summarized (f). g The protein levels of CLK1 in normal human pancreatic duct epithelial (HPDE) cells and selected human pancreatic cancer cell lines were quantitated by western blot assays. Representative images are shown, and relative expression levels were summarized. h, i The expression of CLK1 in 186 paraffin-embedded specimens from the internal cohort was determined by TMA-based IHC staining. Representative IHC images are shown (h), and the relative CLK1 staining intensity was scored (i). Scale bar, 200 μm. j The number of PDAC tissues with high or low expression levels of CLK1 from patients with Stage III and Stage II pancreatic cancer was summarized. km Kaplan–Meier analyses of the correlations between CLK1 expression and overall survival of all PDAC patients (k), or Stage II patients (l), or Stage III patients (m) in the internal cohort. Data are shown as mean ± SD from three independent experiments. *P < 0.05; **P < 0.01; ***P < 0.001, between the indicated groups
Fig. 2
Fig. 2
CLK1 enhanced the proliferation ability of human pancreatic cancer cells in vitro and in vivo. a, b BxPC3 cells with stable CLK1 overexpression (a) and PANC-1 cells with CLK1 knockdown (b) were generated. The changes in CLK1 expression were confirmed using western blot assays. c–i The proliferative ability of stably transfected PANC-1 or BxPC3 cells was investigated via colony formation assays (ce) and CCK-8 assays (fi). Representative colony formation images are shown (c, d), and the numbers of colonies were summarized (e). j, k Flow cytometry analysis of the cell cycle progression of stably transfected PANC-1 (k) or BxPC3 (j) cells was performed. Representative images and quantification of the results are presented. ln Overexpression of CLK1 promoted the growth of BxPC-3 cells in a subcutaneous xenograft mouse model (ln). The size of the tumors was measured at the indicated time points (m, ***P < 0.001). Tumors were extracted and weighed after mice were sacrificed (n, ***P < 0.001). CLK1 knockdown inhibited the growth of PANC-1 cells in a subcutaneous xenograft mouse model (l, o, p). The size of the tumors was measured at the indicated time points (o, ***P < 0.001). Tumors were extracted and weighed after mice were sacrificed (p, ***P < 0.001). q The protein levels of p21 and p53 were quantitated by western blot assays, and representative images are shown. Data are shown as mean ± SD from three independent experiments. *P < 0.05; **P < 0.01; ***P < 0.001, between the indicated groups
Fig. 3
Fig. 3
CLK1 promoted the migration and invasion ability of pancreatic cells in vitro and in vivo. ad Transwell assays with stably transfected BxPC-3 (a, b) and PANC-1 (c, d) cells were performed. Representative images and quantification of the results are presented. eh Wound-healing assays with stably transfected BxPC-3 (e, f) and PANC-1 (g, h) cells were performed. Representative images and quantification of wound closure are presented. il The epithelial–mesenchymal morphology of BxPC-3 (i) and PANC-1 (j) cells, scale bars for the images are 25 μm. And the protein expressions of E-cadherin, and Vimentin were analyzed, the quantification are presented on the right (k, l). mt Control BxPC-3 cells or CLK-1-overexpressing BxPC-3 cells (mp), or control PANC-1 cells, or CLK-1-knocked down PANC-1 cells (qt) were injected into nude mice via tail vein, and tumor metastasis to lung was evaluated after 6 weeks. Representative bioluminescence images of mice are presented (m, o, q, s), and the number of pulmonary metastasis (n, r) was summarized. Mice survival analysis was further analyzed (p, t). Data are shown as mean ± SD from three independent experiments. *P < 0.05; **P < 0.01; ***P < 0.001, between the indicated groups
Fig. 4
Fig. 4
CLK1 phosphorylates SRSF5 on Serine 250 in human pancreatic cancer cells. a Volcano plot of differential expression genes between CLK-KD and CLK1-vector groups. b, c GO and KEGG analysis of the DEGs was performed and results were represented. d Flowchart showing the process of evaluating the involvement of CLK1 in regulating alternative splicing related proteins. e Phosphorylation mass spectrometry was performed, and clusters plots represents differentially phosphorylation expressed sites (DPS) between CLK1-konckdown and control cells. fh GO analysis of the DPS related proteins was performed and results were represented. i Changes of phosphorylation in the splicing factors (SRSF1, SRSF3, SRSF5, SRSF6) screened by phosphorylation mass spectrometry were confirmed by western blot assays. j Logo pictures represented the 250-Ser of SRSF5. k Relationship between CLK1 expression and phosphorylation level of SRSF5 on Ser250 in different cell lines and l CLK overexpressed or knockdown cell lines was determined by western blot assays. m CLK1 activated the phosphorylation level of SRSF5 on Ser250. n Up, the interaction between CLK1 and SRSF5 was analyzed in Panc-1 cell transfected with plasmids encoding HA-CLK1 and Flag-SRSF5 by co-immunoprecipitation and western blot assays. Bottom, Endogenous interaction between CLK1 and SRSF5 was assayed in PANC-1 cell lysates by co-im0munoprecipitation and western blot assays using an anti-CLK1 or anti-SRSF5 antibody, respectively. Ten percent of the input was loaded, and normal IgG was used as a control. o Immunofluorescence staining of CLK1 (green), SRSF5 (red) and DAPI (blue) in PANC-1 and BxPC3 cells was conducted. Scale bars for the images are 50 μm. p The expressions of phosphorylated SRSF5 and CLK1 in tumor tissues of PDAC patients were evaluated by IHC. q The correlation between P-SRSF5 and CLK1 levels in tumor tissues was analyzed. rt Kaplan–Meier analyses of the correlations between P-SRSF5 (r), SRSF5 in the condition of High CLK1 expressions (s) CLK1 in the condition of High SRSF5 expressions (t) and overall survival of PDAC patients. Data are shown as mean ± SD from three independent experiments. *P < 0.05; **P < 0.01; ***P < 0.001, between the indicated groups
Fig. 5
Fig. 5
CLK1-induced SRSF5 phosphorylation on Ser250 contributed to the proliferation and metastasis of pancreatic cancer cells. a A schematic diagram shows the nuclear and amino acid sequences of wild type, mutated, and phosphorylated SRSF5 at Ser250 site. b PANC-1 cells were left untreated (Ctrl), or transduced with plasmids expressing wild type (WT)/mutated (S250MU)/phosphorylated (S250P) SRSF5, or treated with TG003 for 24 h. The protein levels of SRSF5 and CLK1 were determined by western blot assays. cf The colony formation (c) and proliferation (d, e) ability, migration and invasion ability (f) of the indicated cell lines were evaluated. gk PANC-1 cells were infected control lentivirus, or lentivirus expressing CLK1-specific shRNA, or lentivirus expressing CLK1 shRNA together with lentivirus expressing wild type (WT)/mutated (S250MU)/phosphorylated (S250P) SRSF5. The cell proliferation ability (g, h), colony formation ability (i), migration and invasion ability (j) of the indicated cells were determined. The protein levels of p21, p53, E-cadherin, and Vimentin in the indicated cells were determined by western blot assays (k). lq PANC-1 cells as indicated in (h) were inoculated into nude mice, and mice were sacrificed. The images of tumors (l), bioluminescence images of mice (o), and tumor growth curves (m), tumor weight (n), mice survival (p), and number of pulmonary metastasis (q) are shown. All data are shown as mean ± SD from three independent experiments. *P < 0.05; **P < 0.01; ***P < 0.001, between the indicated groups
Fig. 6
Fig. 6
SRSF5 controlled the exon skipping of METTL14 and CyclinL2. a A schematic diagram shows the experimental design of transcriptome sequencing in Group A and Group B. b Genes with different AS patterns were represented according to the type of AS events. c, d The constituent ratios of different AS events were showed in two groups. e, f The changes of PSI of different AS events were showed in two groups. g GO analysis of genes with shift of exon skipping in two groups. h, i Analysis of △PSI in two groups: X axis represents IncLevelDifference: Difference expression of Exon Inclusion Isoform between Vector and sh-CLK1 (h) or overexpressed SRSF5wt and SRSF5mu (i). Y axis represents FDR. j, l Schematic diagrams show the alternative splicing of METLL14 (J) and Cyclin L2 (L) by exon skipping. k, m RIP assays were performed to confirmed the interaction between SRSF5 and pre-mRNA of METTL14 (k) or CyclinL2 (m). n Schematic diagrams show the CLIP-qPCR. CLIP assays were performed in Panc-1 cells to confirmed the interaction between SRSF5 and the region of METTL14 (o) or CyclinL2 (p). q, r A series of bait-oligo were constructed, and RNA pull down assays were conducted to identified the site of METTL14 (q), or CyclinL2 (r) that SRSF5 interacted with in PANC-1 cells. s, t Representative images and quantification of the relationships between CLK1-SRSF5 axis and AS patterns of METTL14 (s) and Cyclin L2 (t) are presented. n = 3 for each group; data are shown as mean ± SD from three independent experiments. *P < 0.05; **P < 0.01; ***P < 0.001, between the indicated groups
Fig. 7
Fig. 7
SRSF5 elevated the m6A level and promoted cell proliferation and metastasis in PC cells by inhibiting METTL14 exon10+ skipping. a, b m6A immunoprecipitation assays were performed to determine the m6A levels in PANC-1 cells transduced with control vector plasmid, or plasmids expressing wild type (WT)/ phosphorylated (S250P) SRSF5 (a) or PANC-1 cells infected with control lentivirus, or lentivirus expressing METTL14-L or METTL14-S (b). ch The proliferation ability (c, f), colony formation ability (d, e), migration and invasion ability (g, h) of PANC-1 cells infected with control lentivirus, or lentivirus expressing METTL14-L or METTL14-S were evaluated. il The m6A levels (i), colony formation ability (j), cell proliferation ability (k), migration and invasion ability (l) of PANC-1 cells infected with control lentivirus, or lentivirus expressing WT SRSF5 or WT SRSF5 together with METLL14 exon10-specific shRNA were evaluated. mo The m6A levels (m), colony formation ability (n), cell proliferation ability (o) of PANC-1 cells infected with control lentivirus, lentivirus expressing SRSF5-specific siRNA alone, or SRSF5-specific siRNA together with METTL14-L or METTL14-S were evaluated. Representative images and quantification of the results are presented. n = 3 for each group; data are shown as mean ± SD from three independent experiments. *P < 0.05; **P < 0.01; ***P < 0.001, between the indicated groups
Fig. 8
Fig. 8
SRSF5 promoted tumor proliferation in PC cells by promoting cyclinL2△exon6.3 skipping. ae PANC-1 cells were infected with control lentivirus, or lentivirus expressing cyclinL2△exon6.3- (CCNL2-L) or cyclinL2△exon6.3+ (CCNL2-S). The colony formation ability (a, b), cell proliferation ability (c, d), and migration and invasion ability (e) of the indicated stable cells were evaluated. fh PANC-1 cells were infected with control lentivirus, or lentivirus expressing WT SRSF5, or lentivirus expressing WT SRSF5 and CCNL12-L-specific siRNA. The colony formation ability (f), cell proliferation ability (g), and migration and invasion ability (h) of the indicated stable cells were evaluated. ik PANC-1 cells were infected with control lentivirus, or lentivirus expressing METTL14-L, or lentivirus expressing METTL14-S and CCNL12-L-specific shRNA. The cell proliferation ability (i, j), and migration and invasion ability (k) of the indicated stable cells were evaluated. l, m PANC-1 cells were infected with control lentivirus, or lentivirus expressing CCNL12-L, or lentivirus expressing CCNL12-L and METTL14-L-specific siRNA. The cell proliferation ability (l), and migration and invasion ability (m) of the indicated stable cells were evaluated. n, o The protein levels of p21, p53 (n), E-cadherin, N-cadherin, and Vimentin (o) in PANC-1 cells as described in (fh) were determined by western blot assays. Representative images and quantification of the results are presented. n = 3 for each group; data are shown as mean ± SD from three independent experiments. *P < 0.05; **P < 0.01; ***P < 0.001, between the indicated groups
Fig. 9
Fig. 9
Aberrant alternative splicing of METTL14△exon10 and CyclinL2△exon6.3 possessed prognostic values for PDAC patients. a PCR of cyclinL2△exon6.3 and METTL14△exon10 in PDAC samples was evaluated by PCR. Representative images of DNA gel electrophoresis are shown. bd The correlations between the levels of METTL14exon10 (b) or CyclinL2△exon6.3 (c) and the expression levels of p-SRSF5 and their correlations (d) were determined by IHC staining in tumor tissues were performed. e, f The correlations between the levels of METTL14exon10 (e) or CyclinL2△exon6.3 (f) and lymphatic metastasis and tumor size. g, h Multiple-factor analysis between CLK1-SRSF5-METTL14/SRSF5 axis and lymphatic metastasis and tumor size. Il Overall and disease-free survival analyses were performed to assess the impact of PSI of METTL14exon10 or CyclinL2△exon6.3 shift in PDAC patients. m A proposed working model of the CLK1-SRSF5 axis induced aberrant exon skipping of m6A methyltransferase METTL14 and Cyclin L2 in promoting the development of the pancreatic cancer through regulating cell cycle progression, cell proliferation, and metastasis. Overall (a, c) and disease-free (b, d) survival analyses were performed to assess the impact of PSI of METTL14exon10 or CyclinL2△exon6.3 shift in PDAC patients in external corhort

References

    1. Valle S, Alcala S, Martin-Hijano L, Cabezas-Sainz P, Navarro D, Munoz ER, et al. Exploiting oxidative phosphorylation to promote the stem and immunoevasive properties of pancreatic cancer stem cells. Nat Commun. 2020;11:5265. doi: 10.1038/s41467-020-18954-z. - DOI - PMC - PubMed
    1. Rahib L, Smith BD, Aizenberg R, Rosenzweig AB, Fleshman JM, Matrisian LM. Projecting cancer incidence and deaths to 2030: the unexpected burden of thyroid, liver, and pancreas cancers in the United States. Cancer Res. 2014;74:2913–2921. doi: 10.1158/0008-5472.CAN-14-0155. - DOI - PubMed
    1. Sharma GG, Okada Y, Von Hoff D, Goel A. Non-coding RNA biomarkers in pancreatic ductal adenocarcinoma. Seminars Cancer Biol. 2020. - PMC - PubMed
    1. Sano M, Takahashi R, Ijichi H, Ishigaki K, Yamada T, Miyabayashi K, et al. Blocking VCAM-1 inhibits pancreatic tumour progression and cancer-associated thrombosis/thromboembolism. Gut. 2020. - PubMed
    1. Liang C, Shi S, Qin Y, Meng Q, Hua J, Hu Q, et al. Localisation of PGK1 determines metabolic phenotype to balance metastasis and proliferation in patients with SMAD4-negative pancreatic cancer. Gut. 2020;69:888–900. doi: 10.1136/gutjnl-2018-317163. - DOI - PubMed

Publication types

MeSH terms