

The coronavirus disease 2019 (COVID-19) stay-at-home order's unequal effects on trauma volume by insurance status in Southern California
- PMID: 33849732
- PMCID: PMC9757901
- DOI: 10.1016/j.surg.2021.02.060
The coronavirus disease 2019 (COVID-19) stay-at-home order's unequal effects on trauma volume by insurance status in Southern California
Abstract
Background: The rapid spread of coronavirus disease 2019 in the United States led to a variety of mandates intended to decrease population movement and "flatten the curve." However, there is evidence some are not able to stay-at-home due to certain disadvantages, thus remaining exposed to both coronavirus disease 2019 and trauma. We therefore sought to identify any unequal effects of the California stay-at-home orders between races and insurance statuses in a multicenter study utilizing trauma volume data.
Methods: A posthoc multicenter retrospective analysis of trauma patients presenting to 11 centers in Southern California between the dates of January 1, 2020, and June 30, 2020, and January 1, 2019, and June 30, 2019, was performed. The number of trauma patients of each race/insurance status was tabulated per day. We then calculated the changes in trauma volume related to stay-at-home orders for each race/insurance status and compared the magnitude of these changes using statistical resampling.
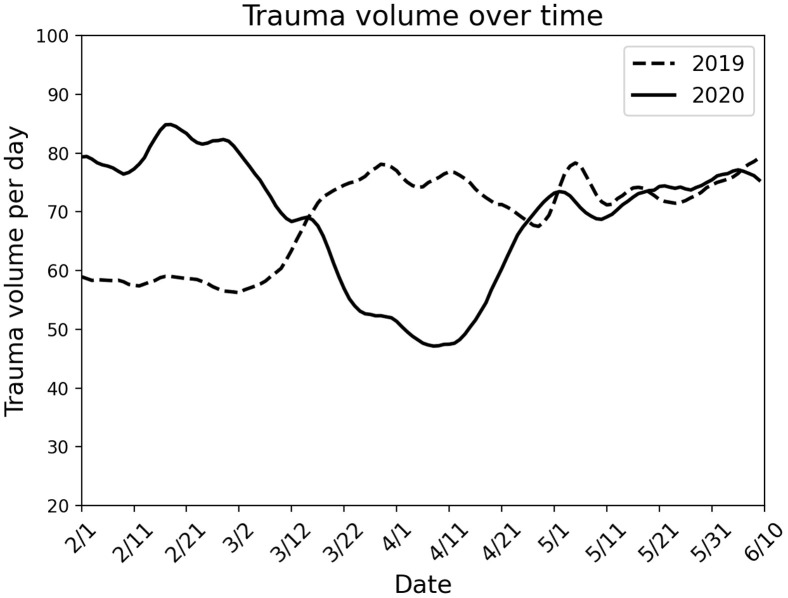
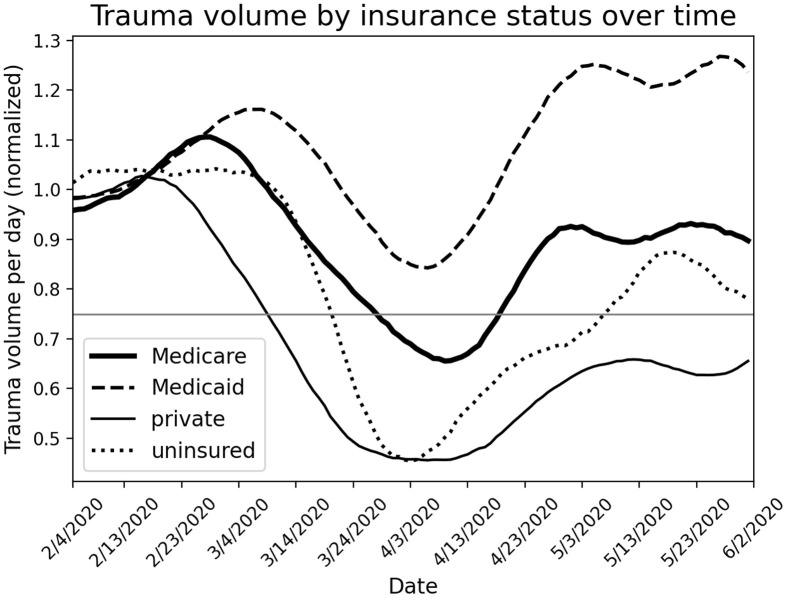
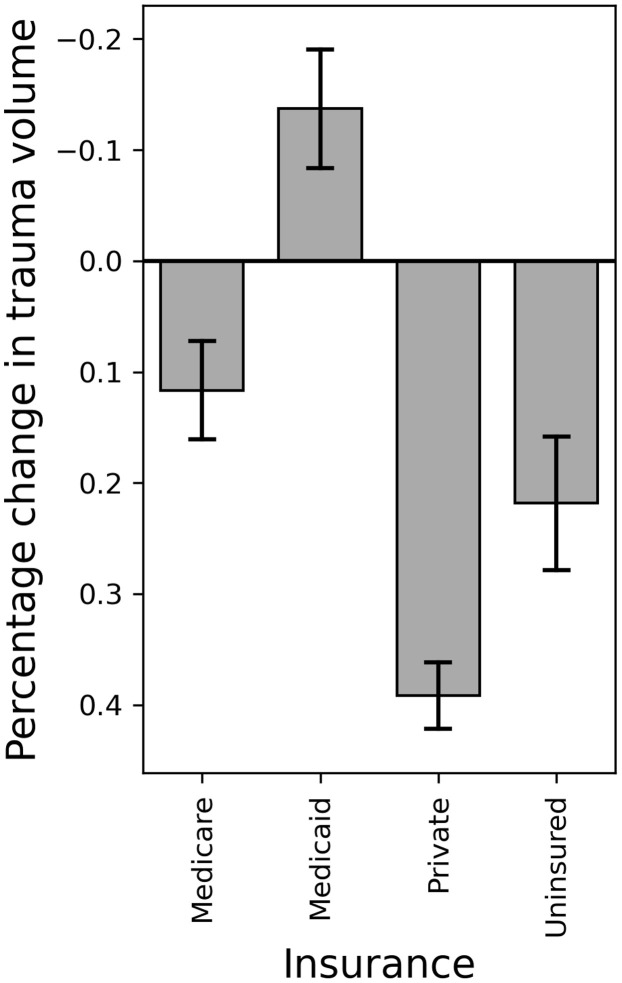
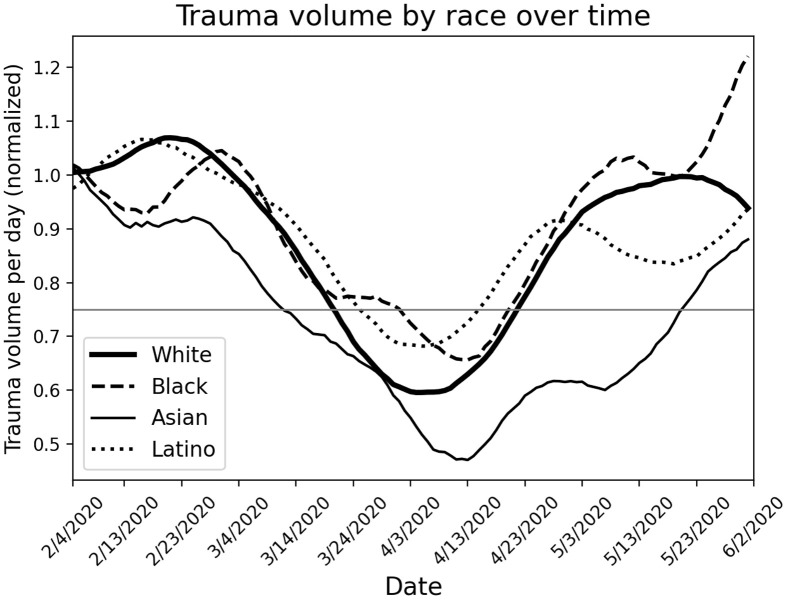
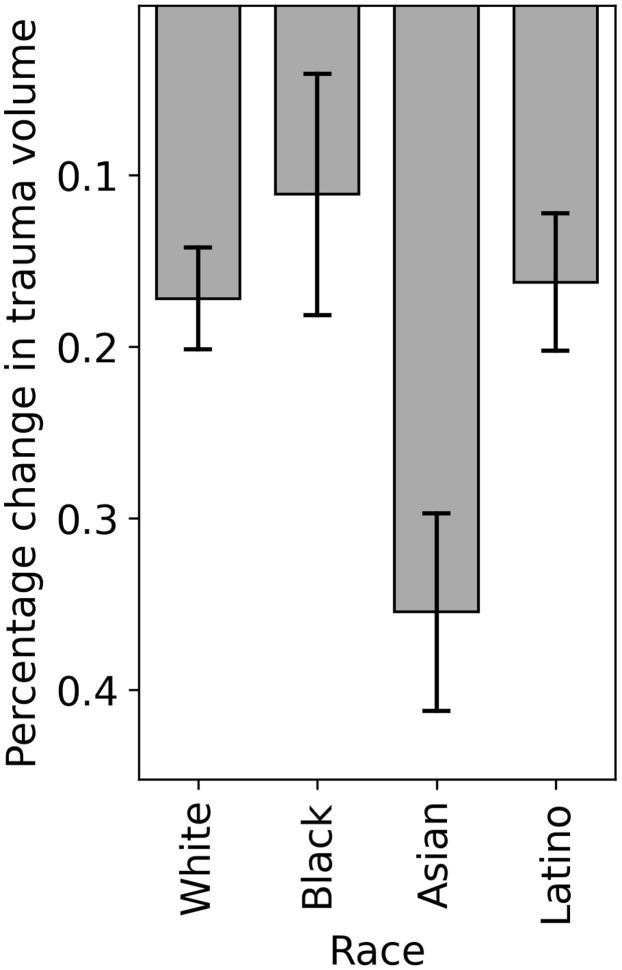
Results: Compared to baseline, there was a 40.1% drop in total trauma volume, which occurred 20 days after stay-at-home orders. During stay-at-home orders, the average daily trauma volume of patients with Medicaid increased by 13.7 ± 5.3%, whereas the volume of those with Medicare, private insurance, and no insurance decreased. The average daily trauma volume decreased for White, Black, Asian, and Latino patients with the volume of Black and Latino patients dropping to a similar degree compared to White patients.
Conclusion: This retrospective multicenter study demonstrated that patients with Medicaid had a paradoxical increase in trauma volume during stay-at-home orders, suggesting that the most impoverished groups remain disproportionately exposed to trauma during a pandemic, further exacerbating existing health disparities.
Copyright © 2021 Elsevier Inc. All rights reserved.
Figures
Similar articles
-
Association of insurance status with health outcomes following traumatic injury: statewide multicenter analysis.West J Emerg Med. 2015 May;16(3):408-13. doi: 10.5811/westjem.2015.1.23560. Epub 2015 Mar 17. West J Emerg Med. 2015. PMID: 25987915 Free PMC article.
-
Socioeconomics affecting quality outcomes in Asian trauma patients within the United States.J Surg Res. 2018 Aug;228:63-67. doi: 10.1016/j.jss.2018.02.060. Epub 2018 Mar 26. J Surg Res. 2018. PMID: 29907231
-
Race and insurance status are risk factors for orchiectomy due to testicular trauma.J Urol. 2012 Mar;187(3):931-5. doi: 10.1016/j.juro.2011.10.152. Epub 2012 Jan 20. J Urol. 2012. PMID: 22264470
-
Drug and alcohol positivity of traumatically injured patients related to COVID-19 stay-at-home orders.Am J Drug Alcohol Abuse. 2021 Sep 3;47(5):605-611. doi: 10.1080/00952990.2021.1904967. Epub 2021 Jun 4. Am J Drug Alcohol Abuse. 2021. PMID: 34087086
-
The impact of coronavirus 2019 on trauma.Curr Opin Anaesthesiol. 2022 Apr 1;35(2):154-159. doi: 10.1097/ACO.0000000000001096. Curr Opin Anaesthesiol. 2022. PMID: 35045003 Review.
Cited by
-
Racial Disparities Among Trauma Patients During the COVID-19 Pandemic.J Surg Res. 2023 Jan;281:89-96. doi: 10.1016/j.jss.2022.08.015. Epub 2022 Aug 29. J Surg Res. 2023. PMID: 36137357 Free PMC article.
-
COVID-19: A national rise in penetrating trauma cared for by a prepared trauma system.Surg Open Sci. 2024 Jul 3;20:131-135. doi: 10.1016/j.sopen.2024.06.007. eCollection 2024 Aug. Surg Open Sci. 2024. PMID: 39055372 Free PMC article.
-
Effect of the COVID‑19 pandemic on the management and outcomes of patients with traumatic injuries (Review).Biomed Rep. 2023 Sep 5;19(4):76. doi: 10.3892/br.2023.1658. eCollection 2023 Oct. Biomed Rep. 2023. PMID: 37746590 Free PMC article. Review.
-
Effects of the COVID-19 pandemic on pediatric trauma in Southern California.Pediatr Surg Int. 2022 Feb;38(2):307-315. doi: 10.1007/s00383-021-05050-6. Epub 2021 Dec 1. Pediatr Surg Int. 2022. PMID: 34853885 Free PMC article.
-
Trends in gastrointestinal disease hospitalizations and outcomes during the first year of the coronavirus pandemic.World J Gastroenterol. 2023 Jan 28;29(4):744-757. doi: 10.3748/wjg.v29.i4.744. World J Gastroenterol. 2023. PMID: 36742171 Free PMC article.
References
-
- National Conference of State Legislatures State action on coronavirus (COVID-19); 2021. https://www.ncsl.org/research/health/state-action-on-coronavirus-covid-1...
Publication types
MeSH terms
LinkOut - more resources
Full Text Sources
Other Literature Sources
Medical
